EKHOA .....Let's SeeEKHOA, let's see if this analysis would be valid or not. I think 28 level will be the base to go up to reach 38.42, then 48.72 then 59 as third target.

EGX:ASCM Long Call ... EGX:ASCM
For fellow traders evaluating a long position, here’s the reasoning behind the setup:
Falling wedge breakout: The price has successfully broken out of a falling wedge, a bullish reversal pattern. Additionally, the breakout level has been retested, confirming it as a solid support zone.
88% retracement: The asset has retraced 88% from its recent bottom, aligning with typical wave 2 behavior in a larger motive wave. This deep pullback strengthens the likelihood of an upcoming impulsive move.
RSI confirmation: The Relative Strength Index (RSI) is forming higher lows, indicating weakening bearish momentum and increasing buying pressure.
Monitoring volume and key resistance levels could help refine the entry strategy. Let me know if you’d like to expand on any specific details! EGX:ASCM


#RtvcRamco stock presents a strong opportunity with a small stop-loss and a potential gain exceeding 100%. Entry point at 3.25, target at 7.00, with a stop-loss at 15%. A very promising setup

Trend is your Friend Confirmation showed up Hello Traders,
very clean setup and easy for any one you can see the trend confirmation buy signal from the support line clean close above the prev close
im buying and getting out from the 7.5 area no need to complicate things up

ETRC_strong investment opportunityEgyptian Transport and Commercial Services Company S.A.E. (EGX:ETRS)
Company Overview:
Egyptian Transport and Commercial Services Company S.A.E. (EGX:ETRS) is an Egyptian logistics provider offering a wide range of professional and cost-effective logistic services. The company was established in 1973 and is listed on the Egyptian Exchange (EGX).
Investment Highlights:
• Significant Undervaluation: Trading at EGP 5.90, below fair value of EGP 9.10 (54.2% upside)
• Exceptional Financial Strength: Low P/E ratio, strong profit margin, minimal debt
• Positive Technical Outlook: Bullish trend in Elliott Wave and Wyckoff analysis
• Favorable Risk-Reward Profile: Upside potential (54.2%) outweighs downside risks (15-20%)
• Strong Sector Outlook: Egyptian transportation and logistics sector projected to grow at 7% CAGR.
Fair Value Range
• Ostoul Securities Brokerag Conservative Fair Value: EGP 7.82 (+32.5% upside)
• DCF Fair Value: EGP 7.6 (+28.2% upside)
• Optimistic Fair Value: EGP 11.00 (+86.4% upside)
• Cairo Financial Holding Research Fair Value: EGP 9.5 (+61% upside)
Base Case on the above Fair Value: EGP 9.10 (+54.2% upside)
ETRS is Financial Health and is considered a strong investment opportunity based on
Fundamentals:
• Low P/E ratio of 4.17
• High profit margin of 30.83%
• ROE: 45.14%
• Low debt-to-equity ratio of 0.09
• EV/EBITDA: 4.06 (Undervalued)
• P/FCF: 23.02 (Suggests weaker cash flow compared to earnings)
Technical analysis:
Based on my analysis average accumulation price:4.30 EGP by Smart Money Holdings
According to Wyckoff theory, smart money typically begins distribution likely begin distribution in the 8.50-9.50 EGP range the price approaches fair value.
• Primary Support: 5.00-5.20 EGP (previous resistance turned support)
• Secondary Support: 4.80 EGP (entry point)
• Strong Support: 4.30-4.60 EGP (previous accumulation zone)
• Elliott Wave Theory Analysis Wave 5 Scenario: If in early Wave 5, we would expect a final push upward with a price target of approximately 7.50-9.00 EGP forecast Oct.2025
• Long-term (12+ months) target is +11.00 EGP

#ATQA - Egyptian stock#ATQA timeframe 1 hour
Created a bearish Gartley pattern
Sell point around 10.00
Stop loss / reentry 10.20 (estimated loss -1.65%)
First target at 9.60 (estimated profit 4.20%)
Second target 9.25 (estimated profit up to 7.70%)
NOTE: this data according to timeframe 1 hour.
NOTE: stock remains positive for long term.
It's not an advice for investing, only my vision according to the data on chart.
Please consult your account manager before investing.
Thanks and good luck.

DIGITIZE EGX | Breakout or Breakdown? Key Levels & Trading StratDIGITIZE FOR INVESTMENT AND TECHNOLOGY (EGX) is currently trading at EGP 3.00, showing signs of consolidation within a descending triangle pattern. The price is attempting to break out from a downtrend, with Ichimoku cloud resistance and key support levels in play.
In this analysis, I outline a Stop-Loss & Take-Profit strategy to navigate the next move efficiently.
🔹 Key Resistance Levels:
EGP 3.60 → First target
EGP 3.90 → Second target
EGP 4.90 - 5.00 → Strong breakout potential
🔹 Key Support Levels:
EGP 2.75 → Near-term support
EGP 2.30 - 2.40 → Strong support zone
Entry: Buy after a confirmed breakout above EGP 3.20
Take-Profit 1: EGP 3.60
Take-Profit 2: EGP 3.90
Take-Profit 3: EGP 4.90 - 5.00
Stop-Loss: Below EGP 2.75

tweezers magnet = trend shift Hello Traders,
i love this price action when i see it especially on the big frames when it happens it confirms the buy or the sell option and give me more confident in my trade you will the last 3 candles first 2 was bearish and the last one turns bullish again with another day in green
*conclusion :
im going long from here to the 6.1 target this is more than 60% in profits
good luck

#LUTS Egyptian stock#LUTS time frame 1 DAY
Created a bearish Gartley pattern
Sell point around 0.74
Stop loss / reentry 0.77 ( estimated loss -4% )
First target at 0.683 ( estimated profit 8% )
Second target 0.628 ( estimated profit up to 15% )
Although all indicators is positive but the prices at sell point according to bearish Gartley pattern ( prices at 0.886 FIP ) , also there is negative diversion on RSI time frame 15m , may tha support or idea
any way if prices closed daily uber 0.77 with volume at least 40 M shares , re bay .
the profit in this case is saving your invest from losses up to 13% .
in case the prices still rises then re entry for targets 2.75 , 2.83 , 2.93 up to 3.11.
NOTE : this data according to time frame 1 DAY
Its not an advice for investing only my vision according to the data on chart
Please consult your account manager before investing
Thanks and good luck

PHGC - Egyptian stock#PHGC timeframe 1 DAY
Created a bearish Gartley pattern
Sell point around 1.48 ( PRICE NOW 1.50 )
Stop loss / reentry 1.574 (estimated loss -6.35%)
First target at 1.267 (estimated profit 14.40%)
Second target 1.077 (estimated profit up to 27.63%)
NOTE: this data according to timeframe 1 DAY.
It's not an advice for investing, only my vision according to the data on chart.
Please consult your account manager before investing.
Thanks and good luck.

COMI Egypt can exceed 104 in 6 monthsWeekly chart,
The stock EGX:COMI has formed a symmetrical triangle chart pattern, and crossed the Resistance line R.
One more week above R, to confirm, the target will be 104.3 - passing through several resistance levels as shown on the chart.
A new entry (buy) can be made immediately before confirmation with higher risk, and consider a stop loss below 76.0
Technical indicators RSI and MACD are positive.
NOTE: Keep a near Profit Protection/ Stop Loss level.

#EFIH Egyptian stock#EFIH time frame 1 DAY
Created Gartley Bullish pattern ,
Entry level at 18.65 to 18.45
Stop loss 17.45 ( estimated loss - 7.20% )
First target at 20.66 ( estimated profit 10% )
Second target 22.50 ( estimated profit 21% )
Third target 24 ( with profit 28% )
MACD show positive diversion that is may support our idea
NOTE : this data according to time frame I DAY , it`s may take period up to 3 months to achieve targets , you must study well the Alternative opportunities before invest in this stock .
In addition EGX30 is negative.
Its not an advice for investing only my vision according to the data on chart
Please consult your account manager before investing
Thanks and good luck

#CIEB Egyptian stock#CIEB time frame 1 DAY
created a bullish Gartley pattern
entry level at 19.25
stop loss 18.70
first target at 20.70
second target 21.20 up to 21.75 and 22.50
NOTE : this data according to time frame I DAY
Its not an advice for investing only my vision according to the data on chart
Please consult your account manager before investing
Thanks and good luck

Cup and Handle** pattern with a breakout.
- The **cup** formation represents a rounded bottom, indicating a period of consolidation and accumulation.
- The **handle** represents a minor pullback or sideways movement before a potential breakout.
In this case, the breakout seems to have occurred, as indicated by the sharp upward movement following the handle. The target price is likely projected based on the depth of the cup, which is typically added to the breakout level.
The chart suggests a **Cup and Handle** pattern with a breakout. Based on standard technical analysis, the price target is typically measured by adding the depth of the cup to the breakout level.
From the chart:
- **Cup depth** (approximate) = ~3.2 EGP (from ~3.1 to ~6.3 EGP)
- **Breakout level** = ~6.3 EGP
- **Target** = **6.3 + 3.2 = ~9.5 EGP**
### Key Levels:
- **Entry**: Around 5.5 - 6.3 EGP (breakout confirmation)
- **Stop-loss**: Below ~5.0 EGP (previous resistance turned support)
- **First target**: ~7.5 EGP (psychological resistance)
- **Final target**: ~9.5 EGP
If volume remains strong and market sentiment is bullish, the price could reach the full target. However, always watch for pullbacks and retests.

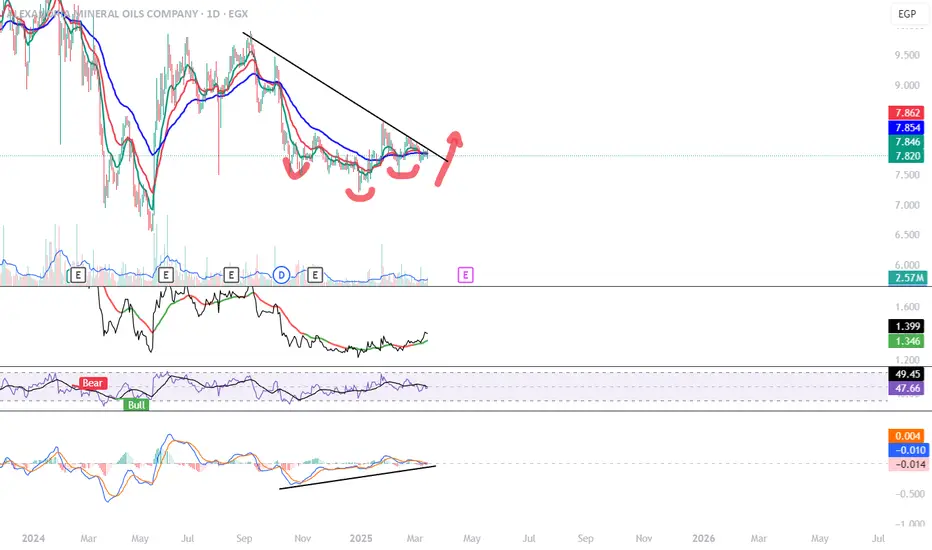
ELSH (El Shams Housing & Urbanization) – Symmetrical Triangle Br📈 AMOC (Alexandria Mineral Oils Company) – Bullish Breakout Ahead? 🚀**
🔎 **Technical Analysis (1D Chart):**
AMOC has been trading in a long-term downtrend but is now showing signs of a potential reversal. The price action has formed what appears to be an **inverse head and shoulders pattern**, which is a strong bullish reversal signal when confirmed with a breakout.
- **Inverse Head and Shoulders:** The formation is visible with three distinct lows, suggesting a possible trend reversal.
- **Descending Trendline Resistance:** The stock has been respecting a major downward trendline. A breakout above this level could lead to a strong upside move.
- **Moving Averages:** The price is hovering around the short-term moving averages. A bullish crossover between the moving averages could act as further confirmation of upward momentum.
- **MACD Bullish Divergence:** The MACD indicator is showing a rising trend while the price has been forming lower lows, indicating weakening bearish momentum and potential bullish strength.
- **RSI Near Key Levels:** The RSI is moving around neutral levels, suggesting that the stock has room to rally if buyers step in.
🔑 **Key Levels to Watch:**
- **Immediate Resistance:** **7.85 - 7.86 EGP** (needs to break for confirmation)
- **Support Levels:** **6.97 EGP** (holding above this is crucial)
- **Breakout Target:** **9+ EGP** (based on the pattern projection)
📊 **Market Sentiment:**
Volume has started to pick up, which is a positive sign, but a clear breakout above resistance is needed to confirm a sustained move higher. If buyers step in with strong volume, AMOC could see a trend reversal and a push towards higher price levels.
⚠️ **Risk Management & Disclaimer:**
This is **NOT financial advice**. Always conduct your own research and apply proper risk management before making any trading decisions. Markets are unpredictable, and technical patterns are not guaranteed to play out as expected. Stay cautious and trade responsibly!
🔥 **What’s Next?**
A daily close above the resistance level could signal the beginning of a new bullish trend. If the stock fails to break out, it may consolidate or retest support before attempting another move. Keep an eye on volume and confirmation signals before entering any trade.
📢 **What do you think? Will AMOC break out soon? Share your thoughts below!** 👇
#AMOC #EGX #Trading #Breakout #TechnicalAnalysis #StockMarket #Investing

For Long-Term Investors _Delta Sugar Company (EGX:SUGR)Delta Sugar Company (EGX:SUGR)
On 7th April 2025 close at 47.30 EGP/Share
Overview
Delta Sugar Company engages in the manufacture and sale of sugar beets in Egypt. The company was founded in 1978.
📊 Financial Snapshot
✅ Strengths:
• EPS (Trailing): 7.60 → Solid earnings power.
• PE Ratio: 6.22 → Undervalued vs. market.
• Book Value/Share: 23.71 EGP → P/B ratio ≈ 2 → Moderately priced on asset basis.
• Strong ROE: 39.38%
• ROIC: 22.22% → Efficient capital use.
• Net cash position: +557.5 million → No leverage risk, ample liquidity.
⚠️ Weaknesses:
• Free Cash Flow: -181.79 million → Negative FCF is a concern, suggests reinvestment isn't translating into near-term cash.
• Operating CF: -38.57 million → Not generating core operational cash right now.
Fair Value Estimates:
• Cairo Financial Holding: 71.80 EGP
• Ostoul Securities Brokerage
• Sector-based Book Value Multiple 76.58 EGP/Share
• Sector-based PE Multiple 98.069 EGP/Share
Financial Highlights – FY 2024
EGX:SUGR has a market cap or net worth of EGP 6.89 billion. The enterprise value is 8.5 billion.
Enterprise Valuation
The stock's EV/EBITDA ratio is 6.91, with an EV/FCF ratio of -46.75.
Income Statement
In the last 12 months, EGX:SUGR had revenue of EGP 6.22 billion and earned 1.08 billion in profits. Earnings per share was 7.60 with Perpetual growth rate is 3%
Balance Sheet
The company has 557.70 million in cash and 193,412 in debt, giving a net cash position of 557.50 million or 3.92 per share.
Cash Flow
In the last 12 months, operating cash flow was -38.57 million and capital expenditures -143.22 million, giving a free cash flow of -181.79 million.
Financial Efficiency
Return on equity (ROE) is 39.38% and return on invested capital (ROIC) is 22.22%.
📌 Investment Strategy Summary
For Long-Term Investors:
• The current zone of 44–54 EGP is seen as accumulation by smart money.
• Money flow profile (ROC) is 55 EGP/Share
• Price is still under EMA 200, but any breakout with ROC reversal could confirm Wave 5 uptrend.
• Targets:
Refer to Gann analysis
o TP1: 61.13 EGP (July 2025)
o TP2: 77.8 EGP (Nov 2025)
Refer Elliott Wave Analysis Wave 5 Target Zone: 98–132 EGP/share (2025–2026 outlook)
🧠 Final Thoughts
Delta Sugar is currently fundamentally undervalued with a strong balance sheet, but cash flow concerns persist. The technical setup indicates it's near the end of a corrective phase, and potential for a strong Wave 5 rally exists — though the key breakout zone is 54–55 EGP

AMOC (Alexandria Mineral Oils Company) – Bullish Breakout Ahead?
**📈 AMOC (Alexandria Mineral Oils Company) – Bullish Breakout Ahead? 🚀**
🔎 **Technical Analysis (1D Chart):**
AMOC has been trading in a long-term downtrend but is now showing signs of a potential reversal. The price action has formed what appears to be an **inverse head and shoulders pattern**, which is a strong bullish reversal signal when confirmed with a breakout.
- **Inverse Head and Shoulders:** The formation is visible with three distinct lows, suggesting a possible trend reversal.
- **Descending Trendline Resistance:** The stock has been respecting a major downward trendline. A breakout above this level could lead to a strong upside move.
- **Moving Averages:** The price is hovering around the short-term moving averages. A bullish crossover between the moving averages could act as further confirmation of upward momentum.
- **MACD Bullish Divergence:** The MACD indicator is showing a rising trend while the price has been forming lower lows, indicating weakening bearish momentum and potential bullish strength.
- **RSI Near Key Levels:** The RSI is moving around neutral levels, suggesting that the stock has room to rally if buyers step in.
🔑 **Key Levels to Watch:**
- **Immediate Resistance:** **7.85 - 7.86 EGP** (needs to break for confirmation)
- **Support Levels:** **6.97 EGP** (holding above this is crucial)
- **Breakout Target:** **9+ EGP** (based on the pattern projection)
📊 **Market Sentiment:**
Volume has started to pick up, which is a positive sign, but a clear breakout above resistance is needed to confirm a sustained move higher. If buyers step in with strong volume, AMOC could see a trend reversal and a push towards higher price levels.
⚠️ **Risk Management & Disclaimer:**
This is **NOT financial advice**. Always conduct your own research and apply proper risk management before making any trading decisions. Markets are unpredictable, and technical patterns are not guaranteed to play out as expected. Stay cautious and trade responsibly!
🔥 **What’s Next?**
A daily close above the resistance level could signal the beginning of a new bullish trend. If the stock fails to break out, it may consolidate or retest support before attempting another move. Keep an eye on volume and confirmation signals before entering any trade.
📢 **What do you think? Will AMOC break out soon? Share your thoughts below!** 👇
#AMOC #EGX #Trading #Breakout #TechnicalAnalysis #StockMarket #Investing
Bullish Trend Analysis ,Trend is your Friend ### **📈 Egyptian Transport (EGYTRANS) – Bullish Trend Analysis 🚀**
Your chart on **EGYTRANS (EGX:ETRS)** shows signs of a potential **bullish trend**, but confirmation is needed. Here’s a detailed analysis:
---
### **✅ Bullish Trend Confirmation:**
1️⃣ **Support Holding at 4.507 EGP** – Important level.
2️⃣ **Breakout Possible Above 4.968 EGP** – Key resistance zone.
3️⃣ **RSI at 48.89** – Neutral, needs to cross 55 for bullish momentum.
4️⃣ **MACD Crossover Forming** – Could push price higher.
5️⃣ **Volume Profile Shows Buyers** accumulating around 4.9-5.2 EGP.
---
### **📈 Trade Setup:**
- **Entry:** Above **5.208 EGP** for strong confirmation.
- **Target 1:** **6.199 EGP** (Resistance level).
- **Stop-Loss:** Below **4.507 EGP** to limit downside.
---
### **🔍 Key Observations:**
✅ If price **stays above moving averages**, bullish trend strengthens.
✅ **Volume must increase** on breakout to confirm trend shift.
✅ **Watch for a retest of 5.208 EGP** before a stronger rally.
---
🔥 **Final Verdict:** **Bullish but needs breakout confirmation above 5.208 EGP.**

#EKHOA Egyptian stock - great opportunity - great fundamental.#EKHOA time frame 1 DAY
created 3 Bullish Gartley patterns ( patterns by time frame 1 day and anther one by time frame 1 hour ) , so we can see action price in this point but in anther hand we are in a downtrend targeted 27.00 .
Entry level at 30.10 to 30.30
Stop loss 29.00 ( loss may go to up -3.70% )
First target at 31.95 ( with profit around 6% ) , resistance at 31.20
Second target 33.50 ( with profit around 11% )
Third target 34.50 ( with profit 15% )
NOTE : this data according to time frame I DAY , it`s may take period up to 3 months to achieve targets , you must study well the Alternative opportunities before invest in this stock .
Its not an advice for investing only my vision according to the data on chart
Please consult your account manager before investing
Thanks and good luck

AIH -Long Arabia Investments Holding (EGX:AIH)
Arabia Investments Holding engages in the non-banking financial, engineering, contracting, and manufacturing businesses in Egypt. Arabia Investments Holding was founded in 1985 and is based in Cairo, Egypt.
At close: Apr 6, 2025 0.490 EGP/share is slightly undervalued
Key Investment Highlights
1. Undervaluation Opportunity
o Current Price (0.49 EGP) vs. Book Value (0.91 EGP): Trading at ~46% discount to book value.
o Fair Value (1.18 EGP): Ostoul Securities estimates 141% upside based on sector P/E.
o Low Trailing P/E (10.52): Suggests earnings are reasonably priced.
2. Strong Financial Growth (2023)
o Revenue Growth: +11.48% (1.41B EGP).
o Earnings Growth: +27.95% (90.16M EGP).
o Market Cap CAGR (5.17% since 2013): Steady but modest long-term appreciation.
3. Technical Indicators Suggest Bullish Reversal
o Wyckoff Accumulation Phase (Since Oct 2024): Potential upward breakout.
o Falling Wedge Pattern (Monthly Chart): Targets 1.01 EGP.
o Elliott Wave Analysis: Wave 1 target at 0.721 EGP.
o Point of Control (POC) at 0.6 EGP: Near-term resistance.
o EMA200 Below Price: Indicates bearish trend, but reversal signals emerging.
🔑 Strategy Suggestion:
• Entry Zone: 0.48–0.52 EGP
• Stop-loss: Below 0.44 EGP
• TP1 refers to volume Money flow profile =POC is 0.6 EGP/share
• TP2 refers to Elliot analysis current in wave 1and TP is 0.721 EGP/share
• TP3refers to daily falling wage 0.737 EGP/share and Flag in monthly to be 1.01 EGP/share
• TP4 refers Book Value Per Share 0.91 EGP/share
📌 Investment Thesis Summary
✅ Positives
• Undervalued vs. Book Value and Sector P/E
• Strong revenue and earnings growth in 2023
• Technical setup suggests a bullish reversal (accumulation + falling wedge)
• Fair value (1.18 EGP) implies significant upside (~141%)

#ETEL- Egyptian stock#ETEL timeframe 1 hour.
Created a Bullish Gartley pattern
Entry level at 35.13 - price closed at 35.05
Stop loss 34.70 (-1.20% estimated loss)
First target at 36.00 (2.65% estimated profit)
Second target 36.90 (5.00% estimated profit)
NOTE: this data is according to time frame 1 hour, also there is a positive divergence on MACD.
It's not an advice for investing, only my vision according to the data on chart.
Please consult your account manager before investing.
Thanks and good luck.
