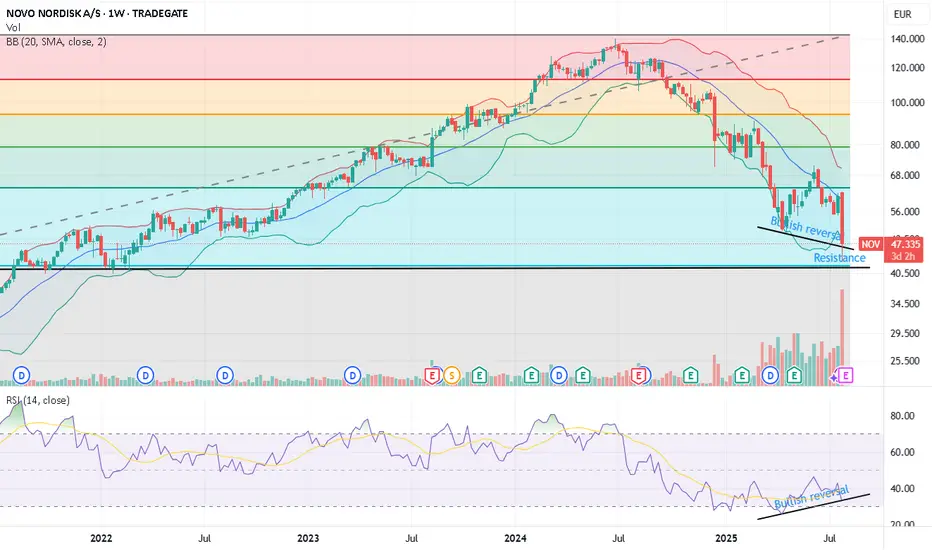
Fib resistance + RSI bullish reversal After the bearish news earlier today, it seems like Novo has had its final capitulation.
There's a fib resistance + historical resistance dating back to '21-'22.
On the weekly, the RSI is also presenting a bullish divergence - although we may want to await the closing of this week to confirm this.
T
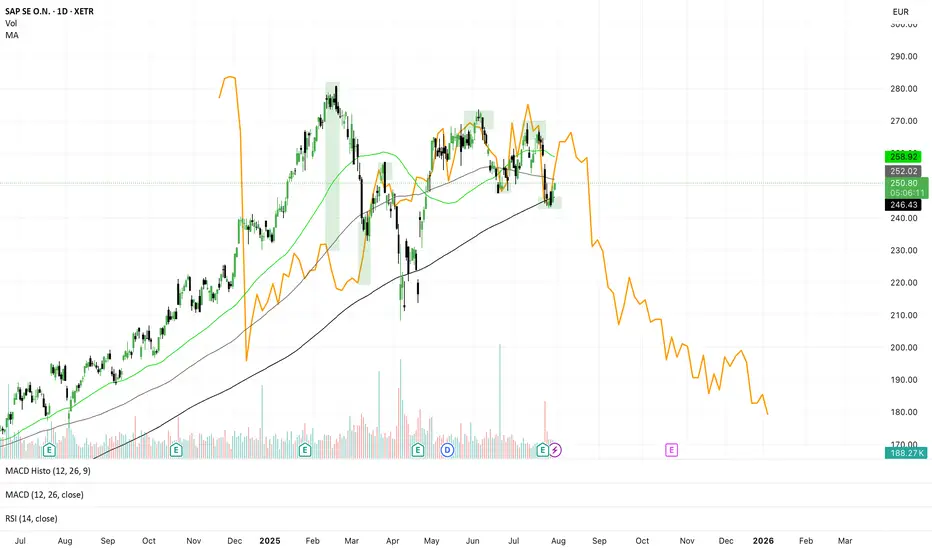
SAP Gann-Method... down potential📈 SAP SE – Gann Projection Signals Major Downside Risk
📅 July 30, 2025 | TF: Daily | Ticker: SAP.XETR
🧠 Concept
Using a historical correction (orange line) from SAP’s past — projected into the future using Gann symmetry — we might be witnessing a repeating time-price pattern. This method suggests t
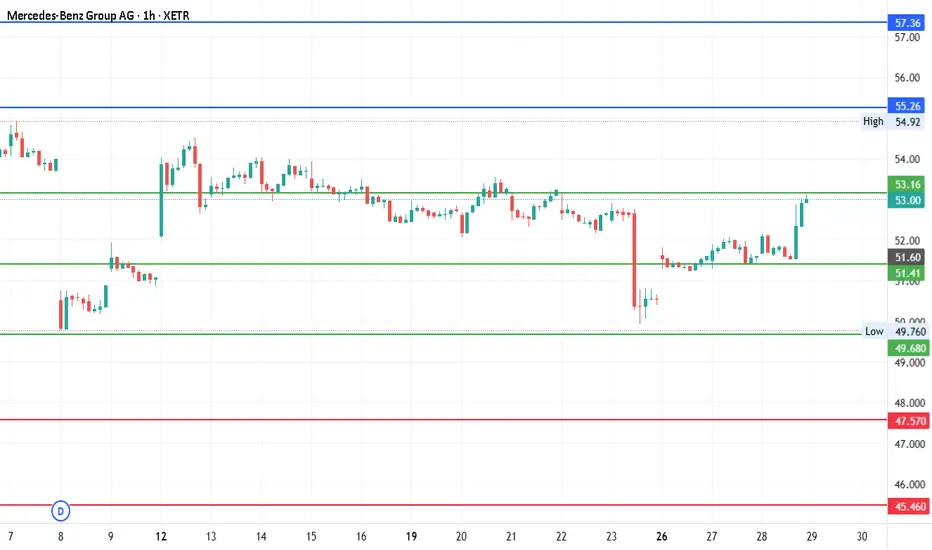
#Mercedes Benz Group AG - Pivot is 51.41Date: 28-05-25
#Mercedes Benz Group AG
Current Price: 53
Pivot Point: 51.41
Upside Target: 55.26, 57.36, 59.59 and 61.83
Downside Targets: 47.5745,46, 43.23 and 41.00
Support: 49.68
Resistance: 53.16
Retro Editors' picks 2022Going further in our retro EP selection , we present to you the third collection of additional scripts that have earned a spot in our Editors' picks, now from 2022.
These retrospective selections reflect our continued commitment to honoring outstanding contributions in our community, regardless o
Rheinmetall now faces a crucial testWill it continue to dominate as Germany’s biggest defence player—or is the soaring rally over, giving smaller names in the sector a chance to gain strength?
🟢 The green scenario outlines what I see as the healthiest outcome: a controlled correction to absorb parts of the massive rally, allowing the

Porsche Break-out! Porsche finally broke out of the long resistance trendline with a strong 7% push. Will the stock finally flip its downtrend?
Alot of EMA's crossed, as well as squeese indicators.

$DHER to $40- XETR:DHER i.e Delivery Hero is working towards profitability and exiting markets where it doesn't want to burn on operations.
- Company is becoming leaner, meaner and strategic in areas where it operates and dominates.
- Region MENA is growing (31% YoY)
- It has nice free cash flow per share g

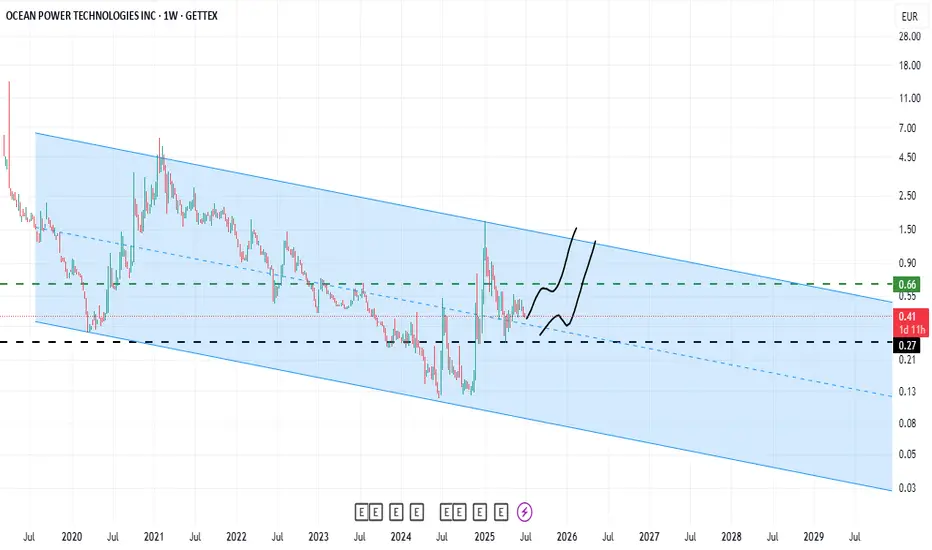
#RUOCThe success of #Ocean_Power in registering an innovative patent has provided a good opportunity for these stocks to exit the downward channel and grow, although from a technical perspective, some corrections seem necessary.
LVMH BUYLVMH is trading at around €468, well below its 2023 highs and at a significant discount to historical valuation multiples. The forward P/E is approximately 17x, versus a 5-year average of 24x. EV/EBITDA is under 10x, and the dividend yield is near 3%.
Fundamentals remain strong. LVMH continues to g

Rheinmetall Ag - Micro Timeframe EW-analysisI have two possible short-term scenarios for Rheinmetall. Both share the same structure on the higher degrees, but they differ slightly in the short term. Despite the difference in micro-counts, both scenarios remain bullish in the near term. As shown here, in this scenario, Wave 5 (yellow) is unfol

See all popular ideas
Community trends
Stock collections
All stocksTop gainersBiggest losersLarge-capSmall-capLargest employersHigh-dividendHighest net incomeHighest cashHighest profit per employeeHighest revenue per employeeMost activeUnusual volumeMost volatileHigh betaBest performingHighest revenueMost expensivePenny stocksOverboughtOversoldAll-time highAll-time low52-week high52-week lowSee all
Today
HAGHENSOLDT AG
Actual
—
Estimate
0.19
EUR
Today
KBXKNORR BREMSE AG
Actual
—
Estimate
0.94
EUR
Today
NEMNEMETSCHEK SE
Actual
—
Estimate
0.38
EUR
Today
LHALUFTHANSA AG VNA O.N.
Actual
—
Estimate
0.39
EUR
Today
FPEFUCHS SE
Actual
—
Estimate
0.59
EUR
Today
BMWBAY.MOTOREN WERKE AG ST
Actual
—
Estimate
3.28
EUR
Today
AIXAAIXTRON SE
Actual
—
Estimate
0.15
EUR
Today
PUMPUMA SE
Actual
—
Estimate
−0.83
EUR
See more events
Sector 10 matches | Today | 1 week | 1 month | 6 months | Year to date | 1 year | 5 years | 10 years |
|---|---|---|---|---|---|---|---|---|
| Technology Services | ||||||||
| Electronic Technology | ||||||||
| Finance | ||||||||
| Health Technology | ||||||||
| Retail Trade | ||||||||
| Consumer Non-Durables | ||||||||
| Producer Manufacturing | ||||||||
| Consumer Durables | ||||||||
| Energy Minerals | ||||||||
| Communications |