Fresenius (FRE.de) bearish scenario:The technical figure Channel Up can be found in the daily chart in the German company Fresenius SE & Co. KGaA (FRE.de). Fresenius SE & Co. KGaA is a European multinational healthcare company. It provides products and services for dialysis in hospitals and inpatient and outpatient medical care. It is involved in hospital management and in engineering and services for medical centers and other healthcare facilities. Channel Up broke through the support line on 24/02/2023. If the price holds below this level, you can have a possible bearish price movement with a forecast for the next 15 days towards 24.00 EUR. According to experts, your stop-loss order should be placed at 29.710 EUR if you decide to enter this position.
Fresenius SE is exploring steps to relinquish control of its dialysis subsidiary as Elliott Investment Management puts pressure on the German healthcare company to simplify its business.
Risk Disclosure: Trading Foreign Exchange (Forex) and Contracts of Difference (CFD's) carries a high level of risk. By registering and signing up, any client affirms their understanding of their own personal accountability for all transactions performed within their account and recognizes the risks associated with trading on such markets and on such sites. Furthermore, one understands that the company carries zero influence over transactions, markets, and trading signals, therefore, cannot be held liable nor guarantee any profits or losses.

WCH | 2 Buy zones and 1 long idea | Solutions and matterGeneral
WCH is currently in a no buy area for me as price approaching the top of the range with a big resistance zone. (red rectangle + Level 2).
I marked 2 buy zones where i would buy equally stocks for long term hold - therefor no SL (Stop- Loss).
First buy zone is based on the 50% of the range and a big s/r level.
Major buy zone is at the bottom of the range with 2 big support levels.
The 1 long idea (blue arrow) is another scenario under which i would buy.
Target: Fib extension in confluence with the % of the full range - ETL1
Requirements: Price breaks above the resistance area (red rectangle), generates swing and enter on break of that swing.
Good luck
Disclaimer:
- This information does not constitute as financial advice and is only for entertainment purposes. I am not your financial advisor.
- You trade entirely at your own risk
- Make your own research
- Finance and trading is evil, capitalism is bad, duh

Mercedes-Benz Group: In the Parking Lot 🚗 🚗 🚗Mercedes-Benz has found a parking spot in the big green parking lot between €67.31 and €77.90 and is about to finish wave in green. Though, as the course has just turned slightly downwards, the current movement could also already be complete. As soon as this high is finalized, the share should pay its parking ticket, leave the parking lot and drive southwards, crossing the support at €62.41 and subsequently heading for the next one at €50.19 as well.

The 1. Chapter of Rheinmetall2 areas marked (green rectangle) where i plan to buy for the long term. Not sure if those area will be reached with the current sentiment but i dont want to buy without a retrace.
+ aswell on a retake of the blue line as shown with the blue arrow
Targets:
Closing 20% of the position every 25% of stock increase
Fundamentals:
- Increase of military budget Germany + other NATO Nations
- War in the Ukraine

Facebook collapse are we witnessing a Facebook collabs soon !
well, since other social media platform are taking over like (Snapchat) and others, and after this news is revealed, lets watch and see what will be the future value of FB:
Meta CEO Mark Zuckerberg announced a new paid subscription service for Facebook and Instagram on Sunday, granting users a hallowed blue check for a monthly fee.
Meta Verified will cost $11.99 a month on web and $14.99 a month on iOS. It's launching in Australia and New Zealand this week ahead of a wider rollout.
The subscription "lets you verify your account with a government ID, get a blue badge, get extra impersonation protection against accounts claiming to be you, and get direct access to customer support," Zuckerberg said. The Facebook founder noted that providing direct access to customer support will cost "a significant amount of money," which will be made up for with subscription revenue.
LAYOFFS ARE ON THE RISE, BUT NEARLY 50% OF WORKERS ARE STILL LOOKING TO QUIT IN 2023
The new option comes after Twitter launched a revamped version of its own paid service, Twitter Blue, which allows users to get a verified profile and other benefits.
Elon Musk rolled out Twitter Blue soon after closing his $44 billion deal to purchase the company last year. He said at the time that Twitter was seeing a "massive drop in revenue" due to an exodus of advertisers from the platform.

Rev Your Engines: Why BMW is Poised to Dominate the Electric CarAlright folks! Today we're going to talk about a company that you might have heard of before, but maybe not in the way I'm about to present it. I'm talking about Bayerische Motoren Werke AG, or as most people know it, BMW.
Now, BMW has been around for a long time. They've been making cars since 1916, and in that time they've built a reputation for producing high-quality, luxury vehicles. But there's more to BMW than just luxury cars. They've also been at the forefront of innovation, particularly when it comes to electric vehicles and self-driving technology.
Now, I know what you're thinking. "Joe, I don't care about electric cars, I want to make money!" Well, let me tell you, investing in BMW is a smart move for a few reasons.
First of all, the company is a leader in the luxury car market, which is a highly profitable niche. They have a strong brand that's synonymous with quality and prestige, and they've consistently delivered on that promise. That means that they're able to charge premium prices for their vehicles, which translates into higher profit margins.
But it's not just about luxury cars. BMW has also been investing heavily in electric vehicles and self-driving technology, and they're making real progress in these areas. Their i3 electric car is one of the best-selling EVs in Europe, and they're set to release several new electric models in the coming years. And when it comes to self-driving technology, BMW has partnered with Intel and Mobileye to develop the technology that will power their upcoming iNext vehicle.
And here's the thing. Electric vehicles and self-driving cars are the future of the automotive industry. As governments around the world look to reduce carbon emissions and improve road safety, these technologies are going to become increasingly important. That means that BMW is well-positioned to capitalize on these trends and stay ahead of the competition.
So, to sum it up, investing in BMW is a smart move. They're a leader in the luxury car market, they're making real progress in the electric and self-driving space, and they have a strong brand that's built on a history of quality and innovation. If you're looking for a company that's poised for growth in the coming years, BMW seems like a great bet.

ADS falling wedge pattern falling wedge pattern occurs when the asset's price is moving in an overall bullish trend before the price action corrects lower.

TMV TEAMVIEWER has the potential for a 50% upsideTMV Teamviewer had its good momentum in 2020 and thereafter fell of from the traders radars. In the meantime the company has proved that it should not be mixed up as another "Zoom" company as it targets institutional accounts through its AR platform.
The recovery should be underway and a 23 eur PT could be realistic.
Watch to stop if the stock drops below 11 eur.

Corrected OutbreakWe've come back 50% from the top 1 week ago. As we are operating within a support zone another bullish attempt seem more likely the more that the MACD supports this and indicates a still prevailing bullish sentiment.

This Mix of Tools May Make You More Fearless When Trading AIREven with relatively high volatility, the use of the two Gann Fans and Fibonacci along with MACD indicator - which I normally don't like to use - based on Heikin Ashi log-scaled chart proves to be quite powerful to capture the behavior of AIR price.
On the daily chart, the area between 11.52-106.42 is the target after that AIR breaks below the ascending channel. Also, the previous swing area between 102.32-101.68 is the next bearish target if a further breakdown would occur.
On the flip side, a break above the upper 3/1 and the lower support line of the channel may set the area between 121.20 and the upper 4/1 as the next bullish targets.
I would appreciate any opinion concerning this analysis :)

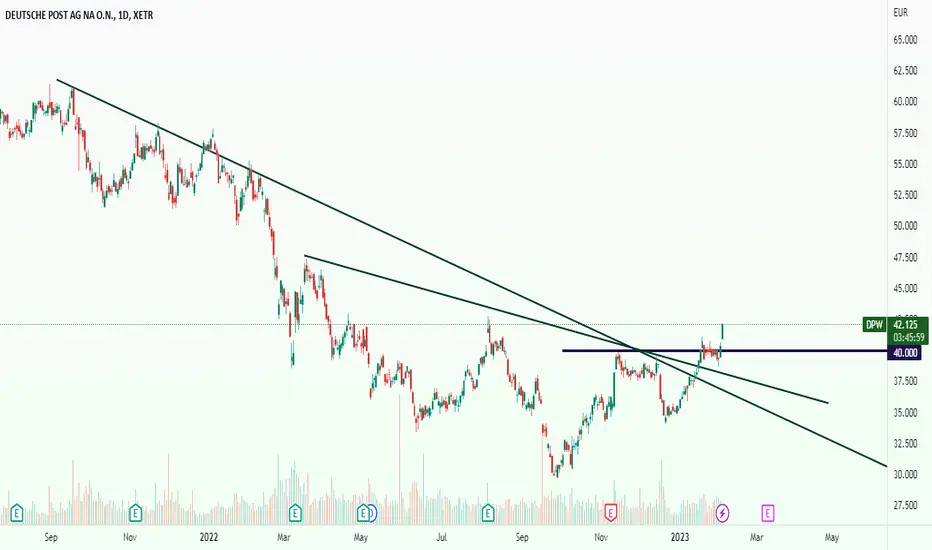
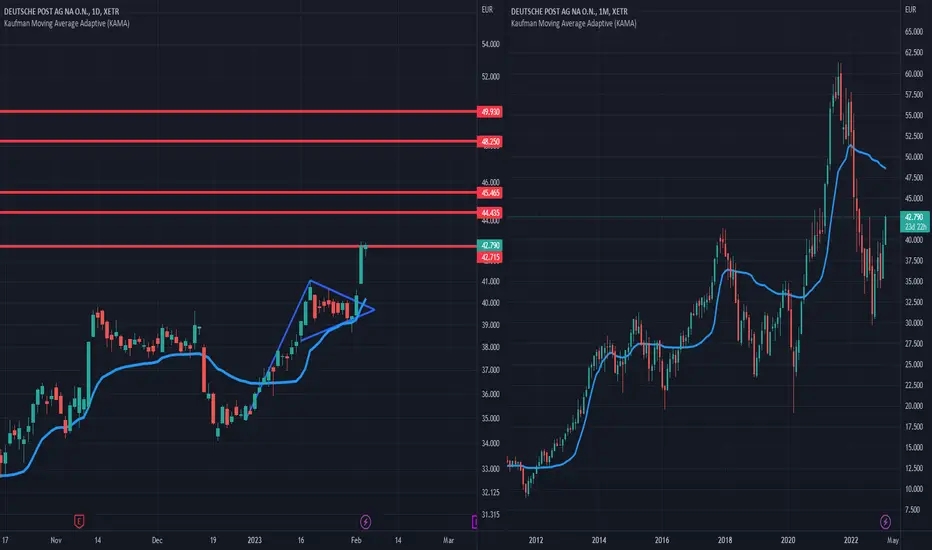
DPW // pennant formationWhile there is pennant formation on the chart, pay attention to the wedge resistance on the monthly time frame.
FRE // Triangle patternThe triangle needs to be broken to the upside for the formation. Pay attention to the wedge resistance on the daily timeframe.

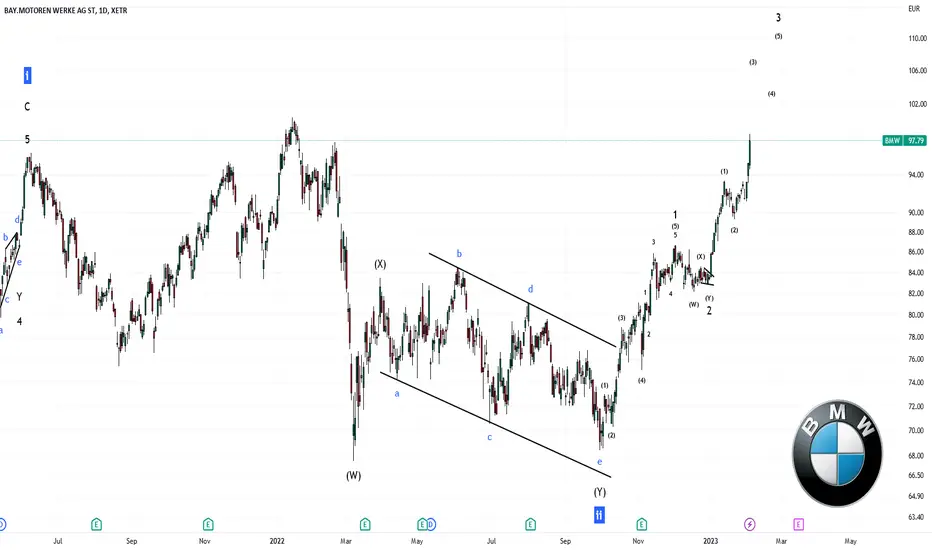
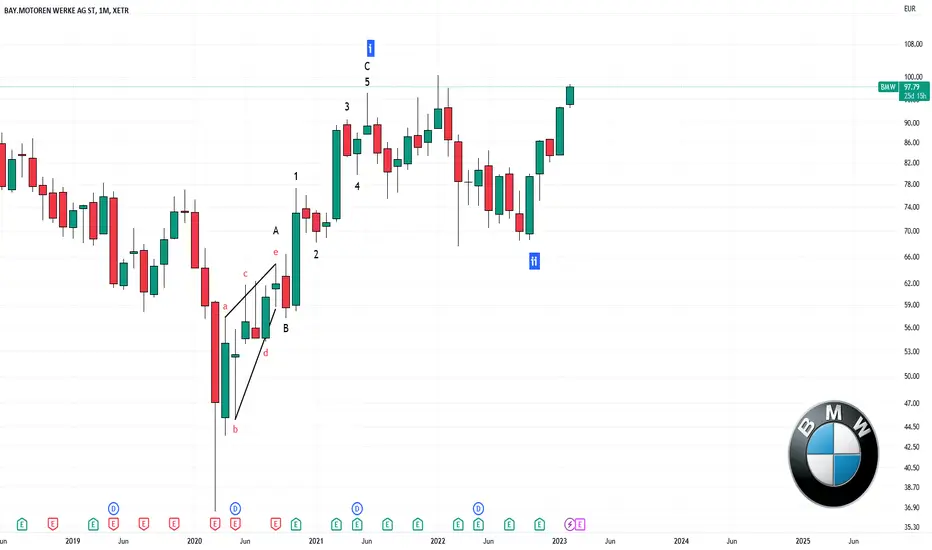
BAYN // Pennant formationWhile there is pennant formation on the chart, pay attention to the wedge resistance on the monthly time frame.

VOW3 // Flag formationWhile there is a flag formation on the chart, pay attention to the wedge resistance on the weekly timeframe.

World militarisation?Rheinmetall looks bullish for couple of next decades. If no extension, it looks like it passed middle of its projected growth. Since I am from Ukraine this picture looks horrendous.
Huge leep was made on 28th of February, 4 days after the invasion. Not on 24th. Perhaps, after "smart money" understood that it is not a 3 days conflict and RHM production will be in demand in the nearest time.
For now it looks lie the whole impulse is coming to an end. Started from Mar.2020. That seems like a kinda positive news.
But the whole wave picture still implies that future for RHM is bright. Whatever that means... Anyway, just couple of guesses what that can mean: 1. WW3. 2. Europe will become separate power apart from the US. As Zbigniew Brzezinski wrote in his books. 3. The world will be bying RHM products more as one proven to be good.

Adidas TP 158,30€ (+14,8%)Adidas has activated a second impulse with target price at 158,30€ that is +14,8% from current price. Stop loss would be below the trend line or in last instance below 114,60€ that is the fibo level of the retracement.

BMW roadmapHello my friend
According to the counting of the waves, we expect that the share of BMW will continue to rise and after the completion of the three main waves, we will have the correction of the 4th.
The BMW has started to moveHello dear friends
In the chart of BMW company, according to the formed waves, it seems that the share correction is over and we should wait for a powerful upward wave. Of course, it is better to see if it succeeds in breaking the upcoming resistance or not.

BMW is slowly getting ready to climb!!!Hello dear friends
In the chart of BMW company, according to the formed waves, it seems that the share correction is over and we should wait for a powerful upward wave. Of course, it is better to see if it succeeds in breaking the upcoming resistance or not.
BMW is fighting a resistance zone!!!Hello friends
BMW has always moved in an ascending channel since the beginning of its movement, and recently it has approached the middle line of the channel, if it can pass this resistance, it can gradually reach the top of the channel.

Mercedes-Benz is ready to go!!!Hello friends
If Mercedes-Benz can reject the upcoming resistance, it can reach the specified area over time. Of course, this correction may be done in 3 steps and we will continue to decline and then rise.
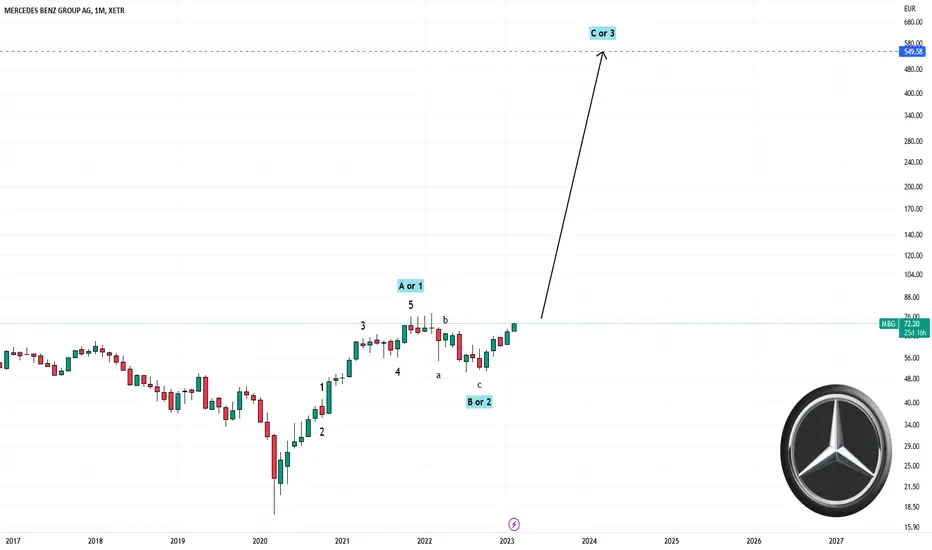
MBG walking through the thought process. further researchMBG walking through the thought process. further research

DEUTSCHE POST ,,, Buy opportunity Uptrend
It's passed of a major price level and i suppose uptrend has been started from here. Set a sure SL for it.