Long Sap stock. Outside barOn this stock we had have 3 linear closes and then a reversal outsidie bar. We bet for reversal from this point for several weeks.
Stop loss 90
Tp 120 or hold 7 -10 weeks

Double TopDouble Top.
Price is at neck line . If price stay below neck line so pattern became confirmed.


Volkswagen Germany Sun Storm Investment Trading Desk & NexGen Wealth Management Service Present's: SSITD & NexGen Portfolio of the Week Series
Focus: Worldwide
By Sun Storm Investment Research & NexGen Wealth Management Service
A Profit & Solutions Strategy & Research
Trading | Investment | Stocks | ETF | Mutual Funds | Crypto | Bonds | Options | Dividend | Futures |
USA | Canada | UK | Germany | France | Italy | Rest of Europe | Mexico | India
Disclaimer: Sun Storm Investment and NexGen are not registered financial advisors, so please do your own research before trading & investing anything. This is information is for only research purposes not for actual trading & investing decision.
#debadipb #profitsolutions

Raiffeisen Bank International Sweden EuropeSun Storm Investment Trading Desk & NexGen Wealth Management Service Present's: SSITD & NexGen Portfolio of the Week Series
Focus: Worldwide
By Sun Storm Investment Research & NexGen Wealth Management Service
A Profit & Solutions Strategy & Research
Trading | Investment | Stocks | ETF | Mutual Funds | Crypto | Bonds | Options | Dividend | Futures |
USA | Canada | UK | Germany | France | Italy | Rest of Europe | Mexico | India
Disclaimer: Sun Storm Investment and NexGen are not registered financial advisors, so please do your own research before trading & investing anything. This is information is for only research purposes not for actual trading & investing decision.
#debadipb #profitsolutions

BMW: update: hold your breath, ready to dive deeperIn the weekly chart, we will probably be witnesses of a trading range, and after that, only if the strong resistance is brokern, 47$ would be a descent stop for bmw shares.

EXL above daily EMA ribbon huge upsideThis one held support despite global weakness.
Targets
8
11,5
15,5
above let it run :D
Management is buying

GWI2D GERRY WEBER INTL INH O.N. GermanySun Storm Investment Trading Desk & NexGen Wealth Management Service Present's: SSITD & NexGen Portfolio of the Week Series
Focus: Worldwide
By Sun Storm Investment Research & NexGen Wealth Management Service
A Profit & Solutions Strategy & Research
Trading | Investment | Stocks | ETF | Mutual Funds | Crypto | Bonds | Options | Dividend | Futures |
USA | Canada | UK | Germany | France | Italy | Rest of Europe | Mexico | India
Disclaimer: Sun Storm Investment and NexGen are not registered financial advisors, so please do your own research before trading & investing anything. This is information is for only research purposes not for actual trading & investing decision.
#debadipb #profitsolutions


Symrise about to rise again?For taking a speculative long position you can assume that this triangle got broken to the top. At least we've reasched already the 50 % retracement mark of the last upward swing.

BP PLC Sweden Europe Sun Storm Investment Trading Desk & NexGen Wealth Management Service Present's: SSITD & NexGen Portfolio of the Week Series
Focus: Worldwide
By Sun Storm Investment Research & NexGen Wealth Management Service
A Profit & Solutions Strategy & Research
Trading | Investment | Stocks | ETF | Mutual Funds | Crypto | Bonds | Options | Dividend | Futures |
USA | Canada | UK | Germany | France | Italy | Rest of Europe | Mexico | India
Disclaimer: Sun Storm Investment and NexGen are not registered financial advisors, so please do your own research before trading & investing anything. This is information is for only research purposes not for actual trading & investing decision.
#debadipb #profitsolutions
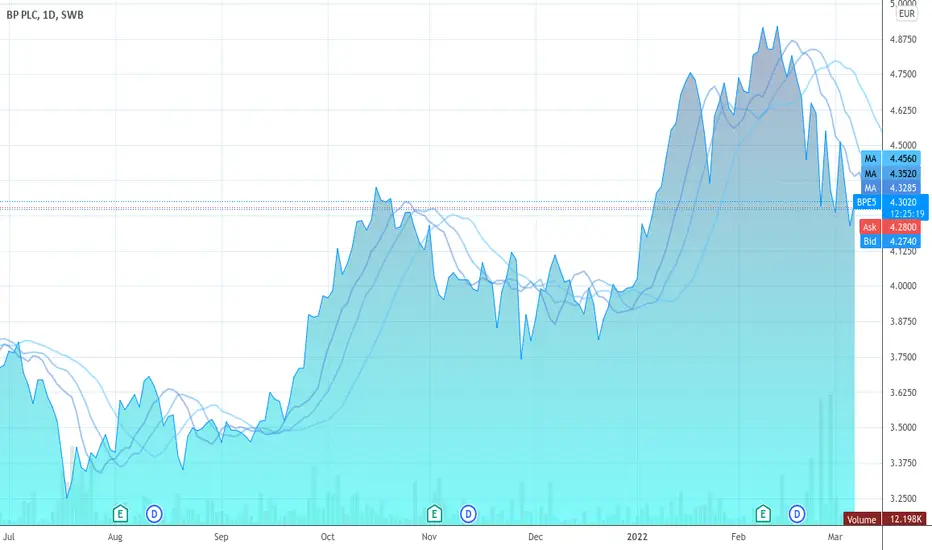
🔜 bullish move ahead!Technicals
The 50 % retracement of the correction from the bullish movement from the high last April was reached. It's a healthy correction so far.
We're above the EMA 17 and SMA 30 and 50 on a daily basis.
An inverse shoulder-head-shoulder-formation has been built and already broken.
As we have cut through the SMA 200 (red) without any major resistance the last time(s), we could consider it not a significant resistance when moving upwards.
We've got a bullish seasonal pattern in HEI over the last 15 years considering Seasonality. 80 % win rate in the date range from the 24th of February until the 9th of May.
Fundamentals
A growth by 1.5 % in 2022 is expected in the construction sector: www.bauindustrie.de
Construction volume is growing in 2022: www.tga-fachplaner.de
Economic growth is expected in the construction industry: www.deutsche-handwerks-zeitung.de
So I'm bullishly invested.

VOW long term viewTrading at 55.6% below our estimate of its fair value
Earnings are forecast to grow 7.09% per year
Earnings grew by 338.4% over the past year

SAP, Head-Shoulder-Formation, Pivotal Determinations!Hello,
Welcome to this analysis about SAP on the monthly timeframe perspectives. As when looking at my chart we can watch there SAP os forming this massive head-shoulder-formation which is almost completed as the left shoulder and the head already developed. Now with the right shoulder SAP also broke down below the 65-EMA which is an important EMA that actually held the bullish trend to the upside previously, now as this EMA condition has changed this gives an additional indication that the head-shoulder-formation has a high possibility to complete in the upcoming times. Once SAP has formed the breakout below the neckline this will be the setup of completion for this whole head-shoulder-formation and SAP will activate the targets as seen in my chart, once these have been reached the situation needs to be elevated again.
In this manner, thank you for watching the analysis, all the best!
"The past like the future is indefinite and exists only as a spectrum of possibilities."
Information provided is only educational and should not be used to take action in the markets.

100 % legit idea on semiconductor industry 100 % legit idea on semiconductor industry , This analysis was support on 2.6 billion projevt made by infineon.
no doubt on this jus follow.

LHA - niceSpot at 4.2ishAfter they gave a big PT in the high 7´s, I´m looking for a long setup at the 4.2 ish area.

Is RAIFAISEN bank ready to push it back to the upside?I mean yes. technicaly it should spike up a lot... after this dump... for me this is great opportunity for buy now... and all institution with infinite capital are watching too... expecting 20-50% up

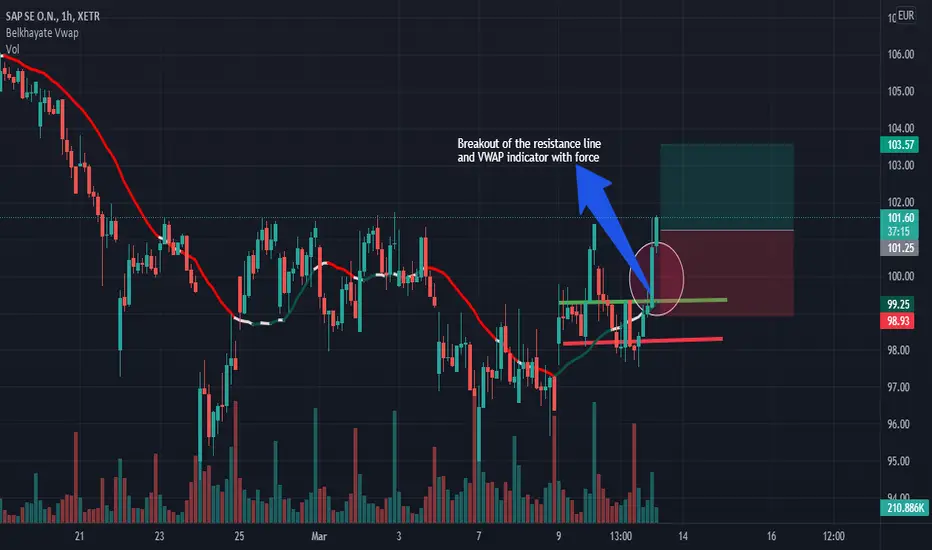
Breakout from a bullish consolidation1. very strong upward movement
2. consolidation in the form of a pennant
3. breakout out of the chart formation
4. Rising volume at the breakout of the trend line.

TESLA found supportTesla got a big rejection on the support area and we'll be looking for buying opportunities to continue its up run.


maybe a cup and handle Hi Traders,
this stock may be forming a trend reversal formation in form of a cup and handle.
Buy now is a good ratio with a strong support at about €11.
Have a successful week.
