Cameco may grow 8.74% in the next five daysHey, welcome to another analysis of GETTEX:CJ6 by me. The focus of this analysis is solely on Short-Term growth. If you like to see my Long-Term take on the Stock, look at my previous fundamental analysis:
From my last analysis, Cameco sadly missed my previous Short-Term goal by roughly 2.0%, only gaining about 8.6% after my analysis. This was due to Cameco not hitting my “Definite Buy” line, which I used as reference. If it had hit the line, Cameco would have probably risen up to more than €40.00. Now, here is my more conservative analysis of the next five bar potential.
Cameco has an 8.74% growth potential in the next 5 bars (7 days) according to my analysis, to Fibonacci(0), located at the upper POI (Point of interest, in this case resistance line). This would throw the Stock at €39.135, before it will likely regress a little bit.
By extending the Fibonacci from the last lower POI (in this case support) we can see that there's an optimistic potential of getting to the “Maximum Target line”, which would mean a growth of about 10% to €40.158.
In terms of risk management, I would not recommend leverage above 10, as Cameco's support is set at €30.2, 16.65% down from current price, causing a total loss.
I hope you liked my analysis, I would kindly ask you, to share suggestions and your own thoughts in the comments. Thank you!
-- Henrik B.

Is DHL Group ready to break the long term triangle? 200dma is still acting as major resistance but approaching the end of the triangle. The chances might be high that breakout occur before the end of the year. 2nd quarter numbers were good. 6-6.5 billion EUR operating profit confirmed for 2024. Decent dividend of 4.5% at current prices.
Melanie Kreis, CFO DHL Group: "Thanks to our unique logistics portfolio we are well prepared for when global trade regains momentum."

UniCredit and Commerzbank: The Challenge of the European Megaban
UniCredit SPA (Ticker AT: CRDI.IT) has taken a significant step by acquiring a 9% stake in Commerzbank AG (CBK.GE), sparking speculation about a possible merger between the two European giants. This move marks a milestone in UniCredit's ambition to consolidate its presence in the European banking market. Commerzbank’s shares have risen by more than 18% since the news, reflecting market optimism about a potential consolidation.
Key Obstacles to the Merger:
1. Resistance from the German Government: The German state, which holds a 12% stake in Commerzbank, might insist on maintaining a national listing and a supervisory board in Germany due to the bank's strategic importance to the German economy.
2. German Unions: Unions in Germany may strongly oppose the merger, concerned about potential layoffs and the shift of power from Frankfurt to Milan.
3. Deutsche Bank's Interest: There is a possibility that Deutsche Bank, Germany's largest bank, could revive its interest in Commerzbank, further complicating the situation.
4. Shareholder Concerns: UniCredit's shareholders, who have seen a 230% increase in their earnings over the past three years, may fear that a merger could impact profitability, even though UniCredit has promised to maintain a 15% return on investment.
Despite these challenges, UniCredit CEO Andrea Orcel is determined to push forward with his ambitious consolidation plans, which could significantly transform the banking sector in Europe.
Technical Analysis:
Looking at the chart, Commerzbank AG experienced a slowdown in its rise at the end of May, reaching €15,825. After some attempts to recover at the end of July, the stock showed an upward gap, potentially signaling another attempt to reach its historical highs. Meanwhile, UniCredit had a relatively consistent rise until July, reaching €39,330, when its price fell, but it is in the process of recovering towards its highs with current support at €35,615.
Ion Jauregui - ActivTrades Analyst
*******************************************************************************************
The information provided does not constitute investment research. The material has not been prepared in accordance with the legal requirements designed to promote the independence of investment research and such should be considered a marketing communication.
All information has been prepared by ActivTrades ("AT"). The information does not contain a record of AT's prices, or an offer of or solicitation for a transaction in any financial instrument. No representation or warranty is given as to the accuracy or completeness of this information.
Any material provided does not have regard to the specific investment objective and financial situation of any person who may receive it. Past performance is not reliable indicator of future performance. AT provides an execution-only service. Consequently, any person acing on the information provided does so at their own risk.

$AG1 Breaks the DowntrendAuto1 ( XETR:AG1 ) was in a downtrend for an extended period. However, following positive company reports, the trend is now reversing gradually.

$DHER is currently in Wave 3, with a price target of €40.Around €20 is an ideal accumulation range for the upcoming bull run. XETR:DHER has presented multiple buying opportunities in the past, and it appears we are now in Wave 3, with a price target of €40.

VOW3: Favourable risk rewardVolkswagen:
- most of the negative news factored in?
- Stock trading near multi year support (86 - 92)
- attractive dividend yield
- favourable risk reward with SL of 86 on WCB

Deutsche Bank (DBK): A Perfect Reversal?Our analysis on Deutsche Bank (DBK) dates back to June, but we've continued to monitor the stock closely for you. We saw that DBK respected the last possible level within our targeted area, which was aligned with the level of Wave 1. Typically, for a Wave 4, we don't want to see the asset linger too long in this area, but in the case of DBK, it only dipped into it briefly before reversing, showing a strong and positive reaction.
We now anticipate a surge above the Wave 3 level, which would also push the stock above the trend channel. Such a conclusion to this cycle would be a very bullish sign, likely leading to a deeper pullback in the overarching Wave (2). At that point, we would definitely consider buying shares as the setup looks promising for long-term gains.

VW - The rise and fall of a giantFUNDEMENTALS
Volkwagen - the people's car, once upon a time this was the world's most valuable automobile company. So what happened to this car manufacturing giant? Unfortunately, they had installed software to cheat emissions test, causing a 40% drop in the stock price. That was back in 2015 and once again we are approaching are the same price level once again.
What does the future hold? Can they survive the competitive landscape of this industry, with the rise of the Chinese EVs? Can the tariffs have a meaningful impact and save this business from collapse?
TECHNICALS
Looking at the price chart, this is a great example of Elliot Wave theory. I think we are only getting started and there's lower to come. I have been short since 150 Euros and will compound my short with any rips that may occur. Restructuring plans and cost saving might bring a relief rally, which is where i'll be looking to add more to my position.
DYOR, not financial advice.

Volkswagen AGThe price is currently around 101.50 EUR.
The chart suggests two potential scenarios:
Bearish Scenario: A red arrow suggests a possible further decline to the long-term support level around 63.37 EUR before potentially rebounding.
Bullish Scenario: A blue arrow suggests a strong upward move that could occur after a potential bottom or a breakout. This move could potentially target levels above 500 EUR, which might be a longer-term projection if the price breaks out of the downward sloping black trendline.

FRA • Fraport AG (FRA.DE) • XETRA LONG TF M30FRA • Fraport AG (FRA.DE) • XETRA LONG TF M30
The trend continues, the nearest support level according to my calculations TP = 46.01

3U Holding on Critical Path 3U holding has reached the 10 years low trend cycle.
Positive:
- The forecast price target changed to 3,00 - 3,50 on short/ Mid term.
- Trend cycle is testing now. Will it hold 220 level of breaking trough cycle (yellow line).
Negative:
- Negative trend cycle is strong. but mainly due tue a huge dividend given to investors. 3,20 per share in may 2023 at a price of 5,15!
Investors have been rewarded in the past.
Taking position in 3U follow the underlaying uptrend cycle of 10 years +
- Today's uptrend 4,5%. Taking position E 1,80
Long Year Trend
Zoom on current positions

Porsche - Long1H Hammer, 4H in PB&J, Monthly at Yearly Pivots S3 and 127.20 extension support (currently Doji), Daily bullish divergence. Daily Trading The 9 strategy long.

Volkswagen: BUYThe Doji on the Monthly chart shows that the downtrend is exhausted at historic Change of Polarity support. Stochastics are oversold. Price hit the Monthly Bollinger lower band and Yearly Pivots Fibonacci S1 support. Target is next major Fibonacci level above which coincides with Daily chart Falling Window resistance.
Long: 105.70
Target: 125.00
SL: 100.7
Max 10% of trading capital.

BMW FORECAST Reasons for execution
1)PWH LIQUIDATION
2) +BOS
3)0.382 Fibonacci Support
4)Dfvg
5)1.618 Fib Expansion

Rheinmetall just surpassed their All-time high!Good afternoon everyone. GETTEX:RHM just surpassed their All-Time high (Adjusted for dividends). They tested their new resistance at €568.274, which is about 0.8% above their previous All-Time high from April 09th.
There will likely be a small correction in the next few days. Worst case, Rheinmetall has a downward potential of 17.9% to their last big support zone, but in my opinion, this is highly unlikely.
I will personally hold Rheinmetall, as I'm still seeing big potential in them.
I'm working on a bigger Analysis on Rheinmetall's Long-Term potential, which will be published in the next few days. Please check out my Analysis on the Uranium mine GETTEX:CJ6
I wish you a pleasant weekend, see you soon.

Cameco Corp. (CJ6) is short term and long term bullish!Welcome to my first public analysis on this platform. Today, I am sharing my thoughts on GETTEX:CJ6 .
In my opinion, Cameco Corp. has a bullish outlook, both long-term and short-term.
When Cameco reaches the buy line at €35.174, there is a 14-day (10-bar) potential for up to 13.68%, based on Fibonacci retracement and MACD indicators. The buy line is validated by previous support levels and the Bollinger Bands, as shown in my chart.
Long-term potential:
Cameco's long-term potential is backed by several political and economic factors, especially in the context of global energy transitions and geopolitical developments.
1. Increased Focus on Nuclear Energy
The shift towards clean energy and decarbonization efforts has increased reliance on nuclear power as a reliable, low-carbon energy source. This global shift boosts uranium demand, of which Cameco is the largest supplier globally.
2. Geopolitical Risks and Uranium Supply
Ongoing political tensions and potential sanctions on Russian uranium put pressure on Western countries to diversify their supply chains. Since Russia is a key supplier of enriched uranium, potential restrictions could force Western nations to depend more heavily on Cameco, increasing long-term demand for its politically secure uranium supplies.
3. Western Energy Security Policies
With growing concerns over energy security, particularly in Europe, many governments are reducing reliance on Russian resources, including uranium. Governments may provide subsidies or support to companies like Cameco, ensuring stable and allied sources of uranium.
4. Supply Chain Tightness
Years of underinvestment, mine closures, and geopolitical risks have constrained the global uranium supply. As nuclear energy demand rises, supply shortages could push prices higher, benefiting Cameco as a top producer outside Russia.
5. Long-term Contracts with Utilities
Cameco has secured several long-term contracts with utilities in North America, Europe, and Asia. These contracts provide stability and predictability in revenue, especially important in a volatile geopolitical landscape where energy resource security is crucial.
---
Cameco Corp. is well-positioned for growth, driven by its strong foothold in the uranium market, favourable long-term contracts, and the geopolitical drive towards clean and secure energy solutions, making it an attractive long-term investment opportunity.
I will personally buy Cameco somewhere around the €36.00 mark, as I am not just interested in its short-term growth. I have not yet fully decided where I will put my Stop-Loss, though.
I hope you've enjoyed my Analysis and I would kindly ask you to write suggestions, corrections and or your own thoughts in the comments.
-- Henrik B.

Volkswagen (VOW3) | Approaching an Interesting Area!Hi,
Volkswagen's stock price has fallen quite deep and is probably heading to the strong area. Multiple rejections between 70 to 88.
Do your homework and keep an eye on this area.
Good luck,
Vaido

Rheinmetall opportunity of 25% upsideRheinmetall dipped today due to concerns of the European "far-right" (half of them centrists lmao) wanting peace with Russia in the future. This doesn't change anything for Rheinmetall though.
Key facts:
- Earnings grew by 21.8% over the 2023.
- Earnings are forecast to grow 26.06% per year.
- Revenue expected to grow 40% this year.
- New deal with Continental Ag. to hire new employees to fulfill the demand.
- Fair value estimated at 1100-1200 EUR per share.
War scenarios:
- A new conflict means growth of 5% + for each arms dealer as seen many times.
- If the war in Ukraine continues, Rheinmetall gets more deals.
- If the war ends, European countries will need to replenish ammunition storages, which is expected to take up to 10-15 years.
Additionaly:
- Both Trump and Kennedy Jr. expressed how European NATO members should start to fulfill their obligations of 2% GDP budget for army if they want the US to protect them.
- Around 17-18 countries do not meet this obligation yet, most of them being customers of Rheinmetall already.
- The total combined deficit of these countries sits around 44 billion USD as of 2024.
Sources:
www.reuters.com
www.reuters.com
www.ft.com
simplywall.st

Tullow oil 30% Asc Tri Bullish case if oil price holds up or steady then this stock should perform to the lower target
30% seems sensible
Loads of other oil stocks moving up Marathon looks v nice
Not advice just for education purposes

Argo Blockchain LONG ( 15 % Upside Momentum ) Argo Blockchain shows short-term momentum opportunity with entry above 0.15 EUR and a TP at 0.18 EUR. This is a exotic high risk play.
GLHF!

NVDIA IN CORRECTIONAstrolgical events were very effective on stock course mentioned parallel to blue lines
Today one is repeated so expecting up move
Wave analysis we will have up move wave X TO 120-122 then down y wave to 88.1 which will close the gap
For discussion and observation not advise to buy or sell

Porsche down?Porsche might fill the gap again and then I should be stopped in. Despite the fact that this stock is going down since a long time, I wouldn't hold it through the earnings which are coming up. So maybe the trarget would be the area around the local low.

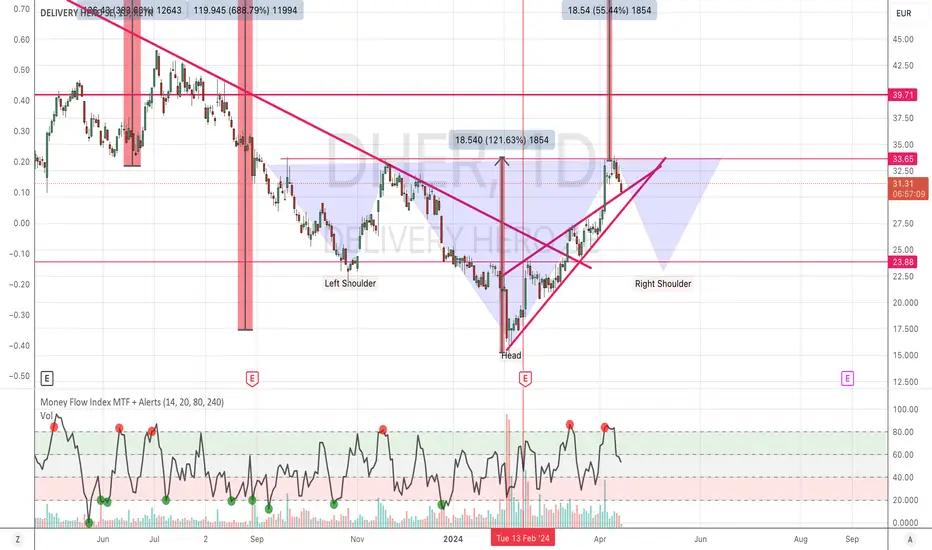
DHER: Inverted H&S developingWe seem to have the 20 Region as the short term Target, but staying bullish till 50-55 Region.