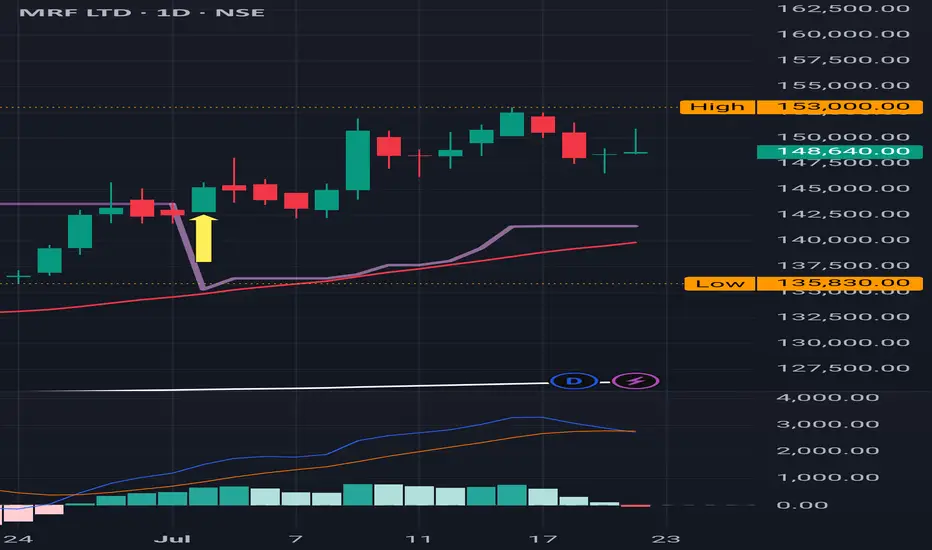
MRF : After a Buy Signal, made it to ATH MRF : After a Buy Signal, made it to ATH .
( Not a Buy / Sell Recommendation
Do your own due diligence ,Market is subject to risks, This is my own view and for learning only .)
Paytm : Monthly Time Frame, Sitting at a major Red Band Resistan
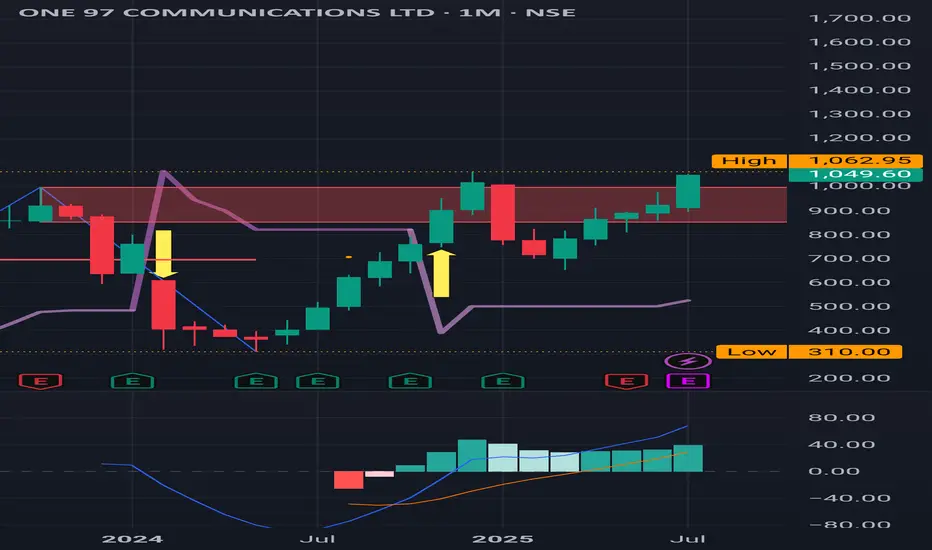
Paytm : Monthly Time Frame, Sitting at a major Red Band Resistance.
Last timr it turned back from 1062 , very important level to test .
( Not a Buy / Sell Recommendation
Do your own due diligence ,Market is subject to risks, This is my own view and for learning only .)
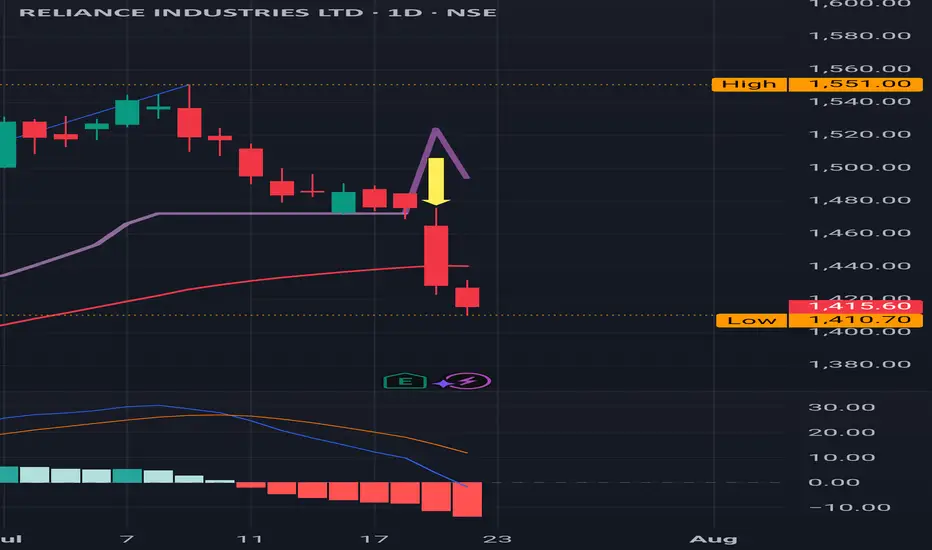
REL : Sell Triggered , around 1400 is an important support levelREL : Sell Triggered .
1390 to 1400 is an important support level.
( Not a Buy / Sell Recommendation
Do your own due diligence ,Market is subject to risks, This is my own view and for learning only .)
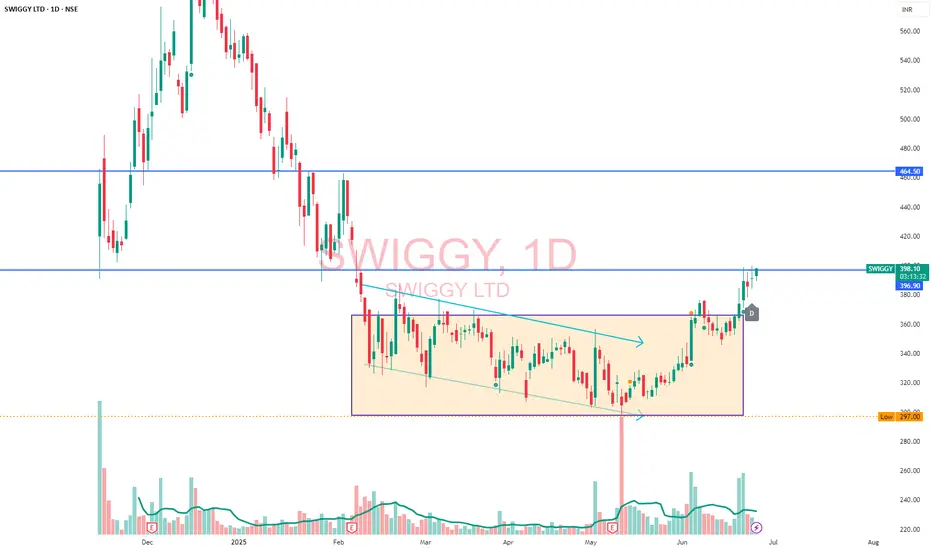
SWIGGY LimitedKeep this stock on radar... looking good on daily chart frame.. Potential target can be seen 410, 420 in short span.

Sharda motorsSharda Motor 🚘 | Strong Positional Setup
Price showing strength with supportive volumes.

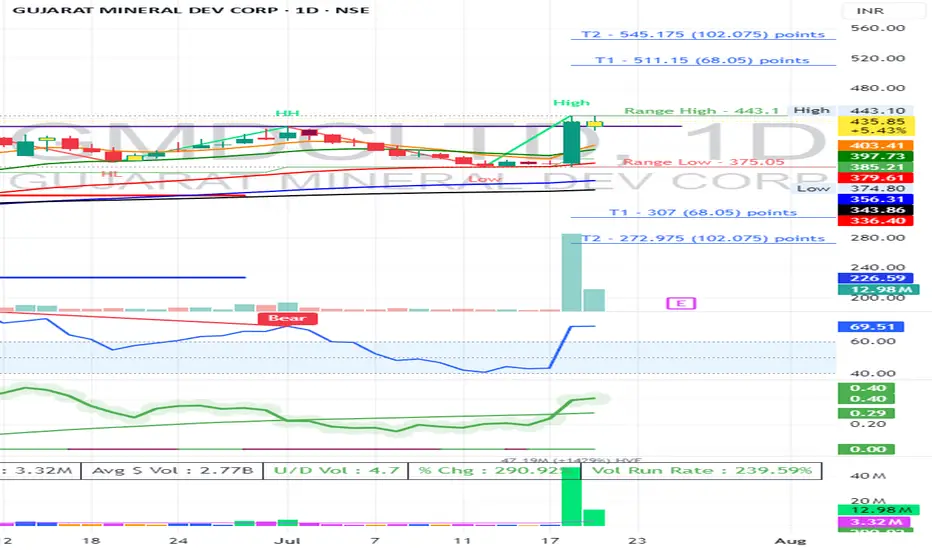
GMDC Inside Bar Strategy Entry 443
SL 422
RSI above 60 Daily / Weekly / Monthly
W Pattern formed
Volume Growth
MAYUR UNIQcompany is giving good results qtr by qtr . It looks from chart that 750-800 is the resistance zone if we presume it to be C wave . If crosses 805-10 then cn target higher range of 900 plus level as 3rd wave would be confirmed.

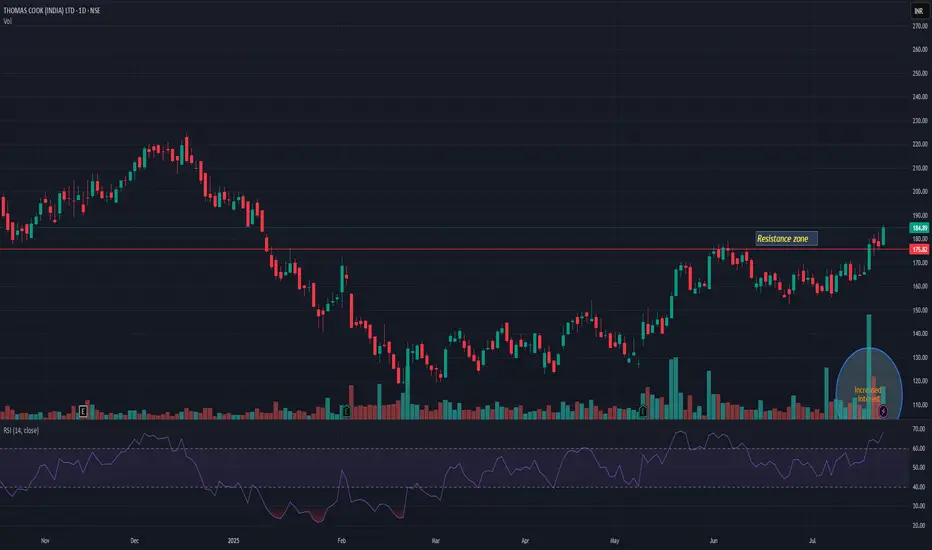
THOMASCOOKTHOMASCOOK has broken previous resistance level. Market participation is also increased with breakout. It may resist nr 210-12 level. Closing below 175 may change my view. Keep it on radar.
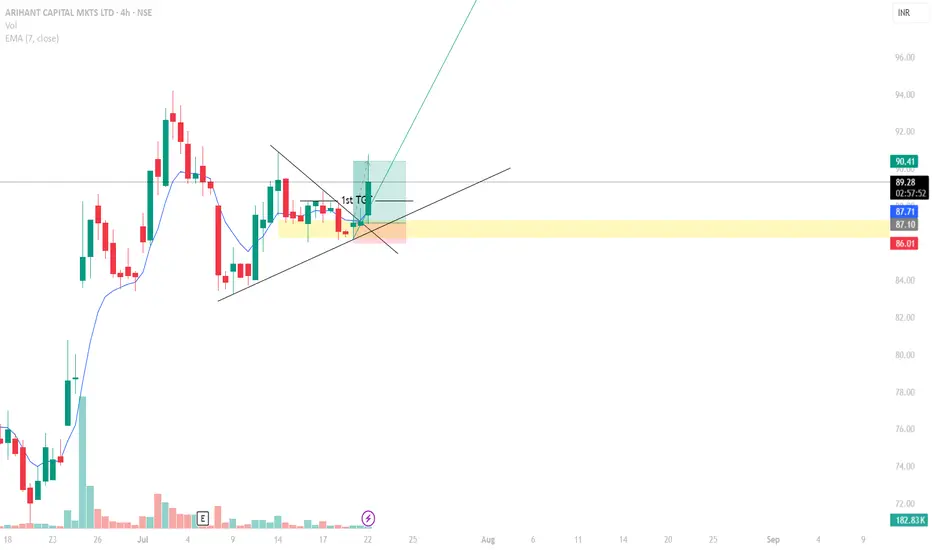
ARIHANT CAPITALSame Strategy!!!
Identified the golden zone and entered the trade.
Risk to Reward ratio of 3:1, booked a profit of Rs. 3 per share.
Although, the profit might seem small, but assume you have 1000 shares of the same stock and you are making Rs. 3000 in just 2 days,
Now you get it,
Its more about the setup and patience and hitting your TP than making profit.
Titan conflicting ideas Based of my pivot idea it looks like price should head down to 2795 approx, we have been rejected from R1 & Breakout levels
on second thought it honestly looks like we are in accumulation manipulation & distribution pattern, will be watching the green support zone for a reaction, if bullish reaction triggered will be longing the market for NEW ATH

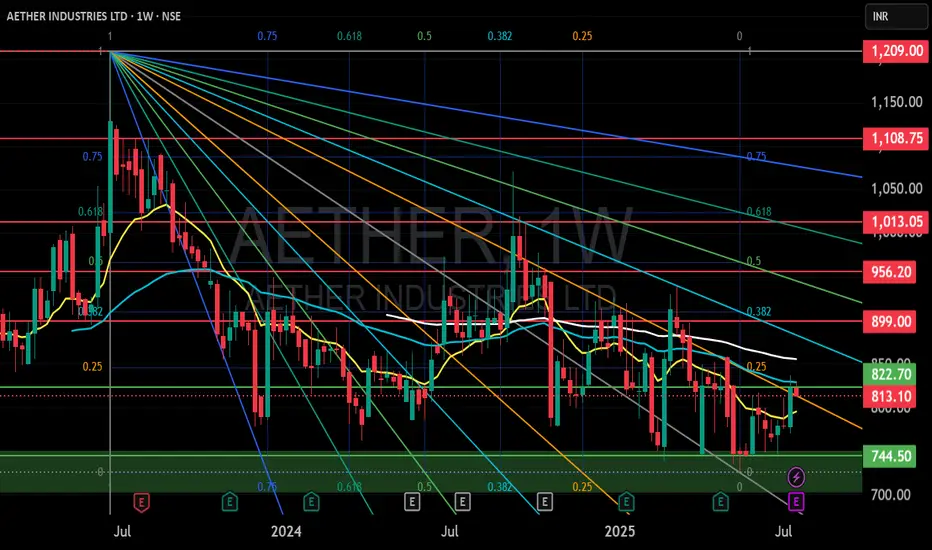
AETHER INDUSTRIES LTD S/R Support and Resistance Levels:
Support Levels: These are price points (green line/shade) where a downward trend may be halted due to a concentration of buying interest. Imagine them as a safety net where buyers step in, preventing further decline.
Resistance Levels: Conversely, resistance levels (red line/shade) are where upward trends might stall due to increased selling interest. They act like a ceiling where sellers come in to push prices down.
Breakouts:
Bullish Breakout: When the price moves above resistance, it often indicates strong buying interest and the potential for a continued uptrend. Traders may view this as a signal to buy or hold.
Bearish Breakout: When the price falls below support, it can signal strong selling interest and the potential for a continued downtrend. Traders might see this as a cue to sell or avoid buying.
MA Ribbon (EMA 20, EMA 50, EMA 100, EMA 200) :
Above EMA: If the stock price is above the EMA, it suggests a potential uptrend or bullish momentum.
Below EMA: If the stock price is below the EMA, it indicates a potential downtrend or bearish momentum.
Trendline: A trendline is a straight line drawn on a chart to represent the general direction of a data point set.
Uptrend Line: Drawn by connecting the lows in an upward trend. Indicates that the price is moving higher over time. Acts as a support level, where prices tend to bounce upward.
Downtrend Line: Drawn by connecting the highs in a downward trend. Indicates that the price is moving lower over time. It acts as a resistance level, where prices tend to drop.
Disclaimer:
I am not a SEBI registered. The information provided here is for learning purposes only and should not be interpreted as financial advice. Consider the broader market context and consult with a qualified financial advisor before making investment decisions.
Deepak Chemtex - Super Numbers - LongRecently listed. Promoters hold 70%+
No debt
Food colors company
Sales and profit increasing
All ratios good.
Chart also stabilising ina range.
Overall stockholder numbers are also less than 1000. This will be a long play.
To buy and hold for a long time. Atleast 4-5 years from today. This will amply reward.

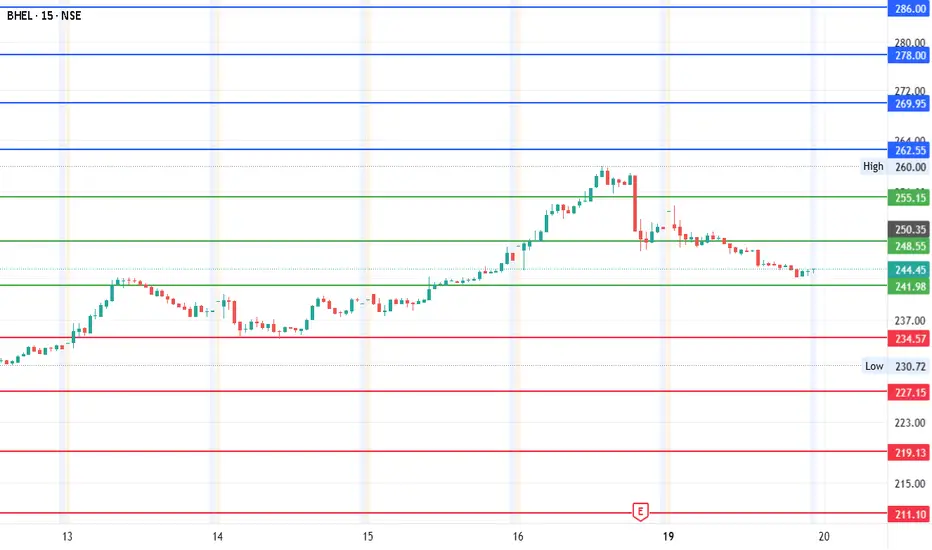
#BHEL - Target 211 or 286? Date: 19-05-2025
#BHEL
Current Price: 243.78
Mid-Point: 248.55
Upside Targets: 262.56, 269.95, 277.98 and 286.00
Downside Targets: 234.57, 227.15, 219.13 and 211.10
Support: 241.98
Resistance: 255.17
If you are planning to trade, the mid-point is the best place with the hedging.
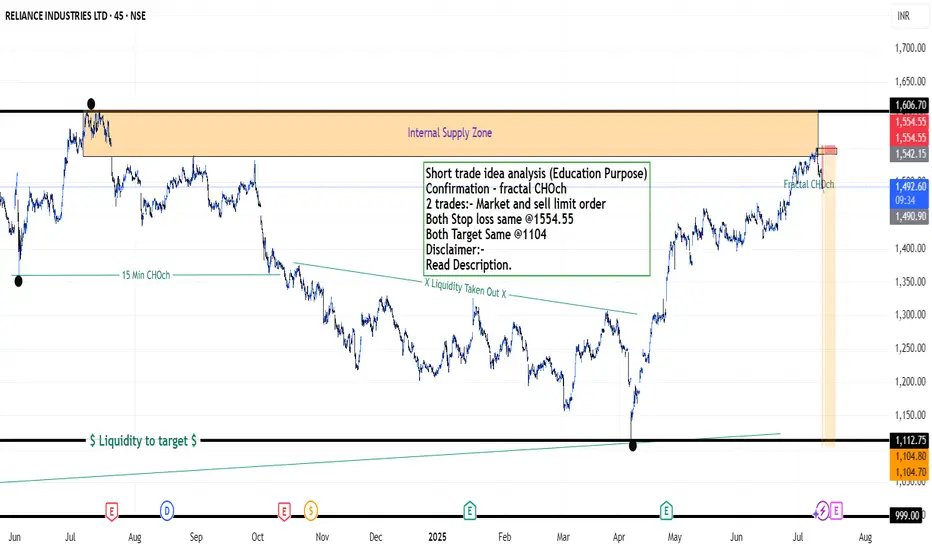
Reliance Industries Stock(India) - {11/07/2025}Educational Analysis says that Reliance Industries (Indian Stock) may give trend Trading opportunities from this range, according to my technical analysis.
Broker - NA
So, my analysis is based on a top-down approach from weekly to trend range to internal trend range.
So my analysis comprises of two structures: 1) Break of structure on weekly range and 2) Trading Range to fill the remaining fair value gap
Let's see what this Stock brings to the table for us in the future.
DISCLAIMER:-
This is not an entry signal. THIS IS FOR EDUCATIONAL PURPOSES ONLY.
I HAVE NO CONCERNS WITH YOUR PROFITS OR LOSS,
Happy Trading,
Stocks & Commodities TradeAnalysis.
My Analysis is:-
Short term trend may be go to the external demand zone.
Long term trend breaks the new high after going from discount zone.
Short trade idea analysis (Education Purpose)
Confirmation - fractal CHOch
2 trades:- Market and sell limit order
Both Stop loss same @1554.55
Both Target Same @1104
Please check the comment section to see how this turned out.
Review and plan for 22nd July 2025Nifty future and banknifty future analysis and intraday plan.
Quarterly results.
This video is for information/education purpose only. you are 100% responsible for any actions you take by reading/viewing this post.
please consult your financial advisor before taking any action.
----Vinaykumar hiremath, CMT

HEROMOTOCO is ready for big breakoutHEROMOTOCO is making inverted Head & Shoulder pattern. Making Pole & Flag pattern on weekly timeframe. Possibility of golden cross over on daily timeframe. Spent more than 2 months within short range and now spending time near high end of the range. Very high chances of break out. 4410 SL 4295 T 4810

CONTROL PRINT - FALLING WEDGE PATTERNControl Print chart seems to break the falling wedge pattern which is considered as bullish pattern.
This chart is only for educational purpose and please do your own analysis before taking any trades.

WIPRO & the Squiggle Prophecy Drew this green curve a year ago just for vibes… and WIPRO said “bet.”
Now it’s casually forming a monstrous cup, heading toward the ₹320 neckline.
If that breaks, we might see ₹370+, and maaaybe ₹480-ish… ish. Idk. Don’t ask me. Ask the squiggle.
Hopefully the squiggle squiggle prophecy holds true and I make more money lmao 💸
📈 When price action meets prophecy.

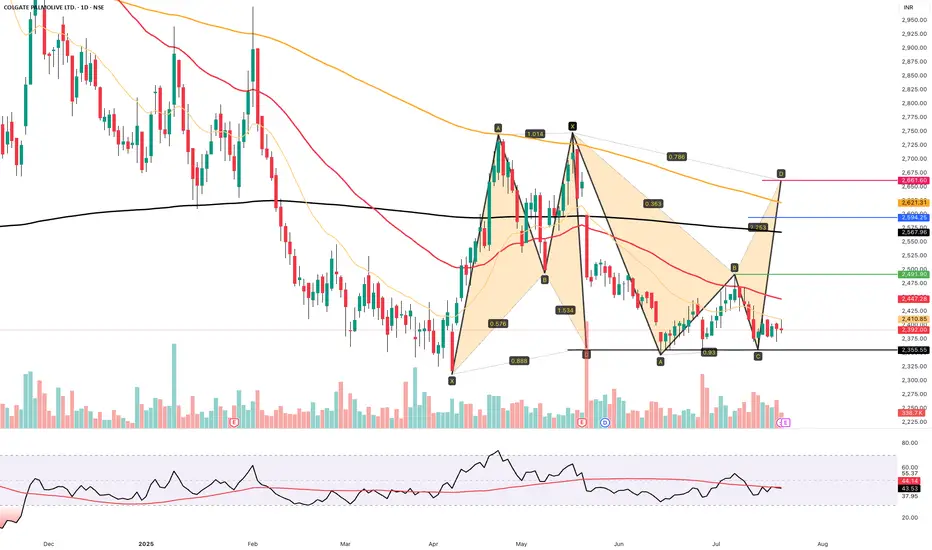
COLPAL 2660++ TARGET SOONCOLPAL AFTER CONSOLIDATION READY FOR 15-20% upside in 1-2 months
tgt 2660+++ soon
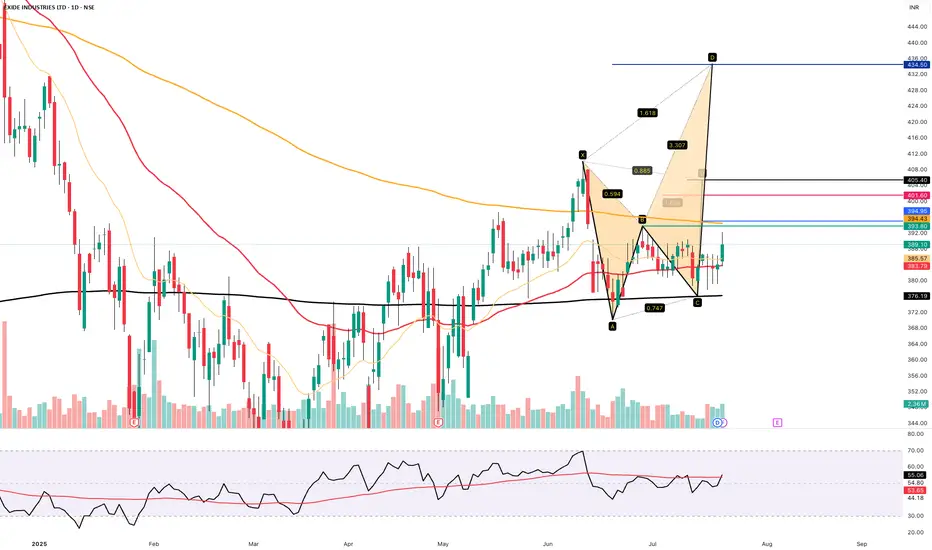
EXIDE INDUSTRIES - ABV 395 ..tgt 405/434++Exide industries ready for big breakout .... abv 394 immediate target 405
Above 405.. 434 and beyond positional
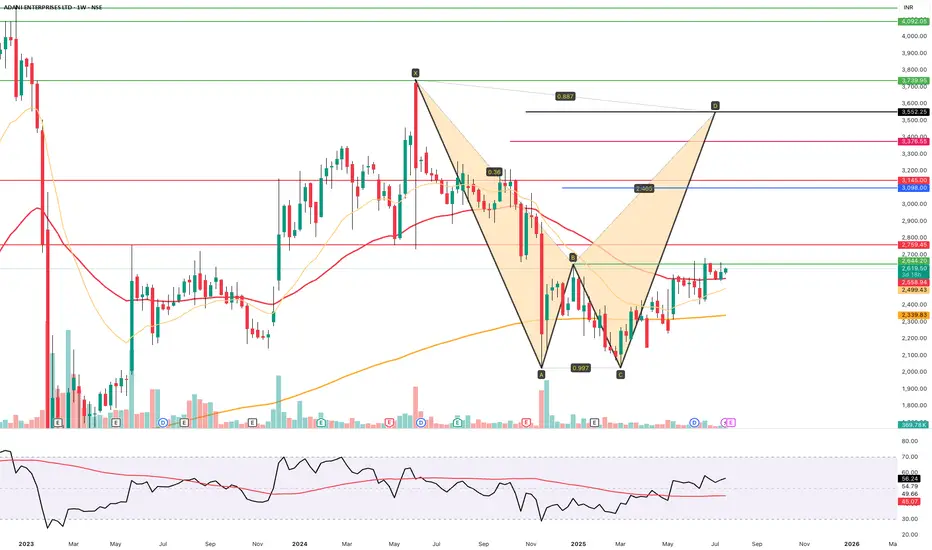
ADANIENT - ABV 2650 CLOSING BIG UPMOVE COMINGAdanienterprises after good consolidation ready for BIG BREAKOUT ABOVE 2650
IN COMING MONTHS EXPECT BIG TARGETS