COAL INDIA LTD - DON'T MISS.Everything is pretty much explained in the picture itself.
I am Abhishek Srivastava | SEBI-Certified Research and Equity Derivative Analyst from Delhi with 4+ years of experience.
I focus on simplifying equity markets through technical analysis. On Trading View, I share easy-to-understand insights to help traders and investors make better decisions.
Kindly check my older shared stock results on my profile to make a firm decision to invest in this.
Kindly dm for further assistance it is for free just for this stock.
Thank you and invest wisely.

BSE-Swing trade-Very bullish-Is profit booking over?
Buy-2820
Target-2943
SL-2688
Buy-2820
Target-2943
SL-2688
Positives
Trend, Pullback
Fairvalue gaps
0.5 Fibonacci
21 EMA
Resistance turned to support pullback

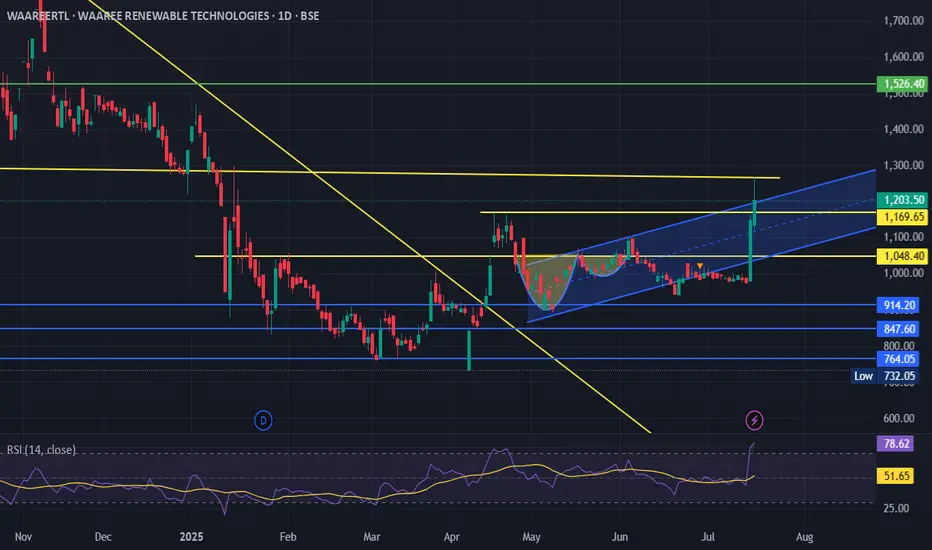
OSWAL PUMPS Long CallIf you have seen my strategy that I used to capture a 1:1.7 RR trade in Mamata Machinery,
Used the same strategy here, but drew fib retracement from low to high,
Currently the price is ranging in the golden zone, and i have entered the trade
SL below the Golden Zone.
Again, this is just my analysis, not a recommendation

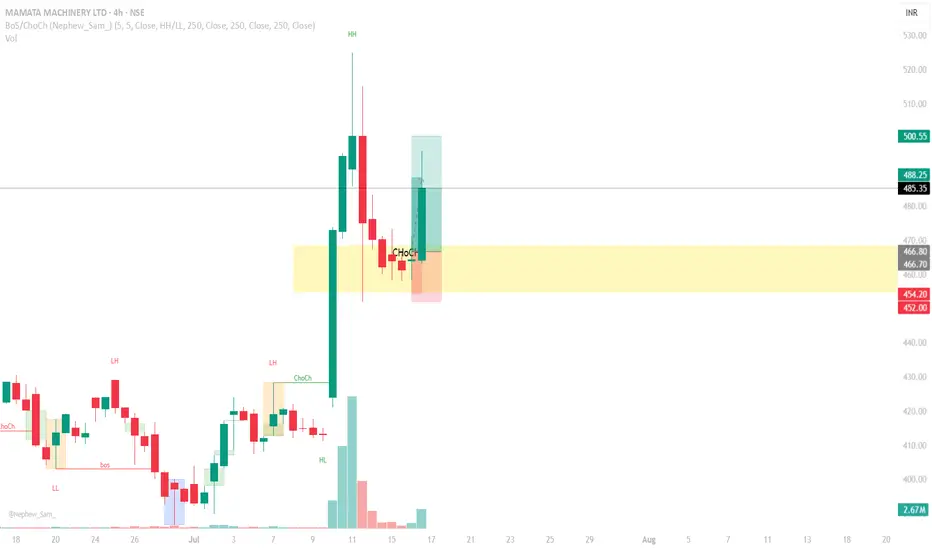
MAMATA MACHINERY LONG CALLDrew a Fibonacci Retracement from swing low to swing high, marked the golden zone.
Waited for the price to tap into the golden zone and show some sign of upward movement
Captured a 1:1.7 RR trade, could have held till 500, but they say greed kills a man.
And hence, booked my profit.
Also, captured this trade in just 2 Days!!
GNFC On the wayThis is only for educational purpose , This is not for buy/sell recommendation .
I am not SEBI Registered.
looking good above 600
SWING IDEA - NEULAND LABNeuland Lab , a niche API manufacturer with strong export presence and leadership in complex molecules, is offering a technically strong swing trade opportunity from key support levels.
Reasons are listed below :
11,500 zone acting as a crucial support area
Formation of a hammer candle on the weekly timeframe, signaling potential reversal
Reversing from the 0.618 Fibonacci retracement zone – the golden pocket
Taking support at the 50-week EMA , holding long-term trend structure
Target - 14900 // 17600
Stoploss - weekly close below 10215
DISCLAIMER -
Decisions to buy, sell, hold or trade in securities, commodities and other investments involve risk and are best made based on the advice of qualified financial professionals. Any trading in securities or other investments involves a risk of substantial losses. The practice of "Day Trading" involves particularly high risks and can cause you to lose substantial sums of money. Before undertaking any trading program, you should consult a qualified financial professional. Please consider carefully whether such trading is suitable for you in light of your financial condition and ability to bear financial risks. Under no circumstances shall we be liable for any loss or damage you or anyone else incurs as a result of any trading or investment activity that you or anyone else engages in based on any information or material you receive through TradingView or our services.
@visionary.growth.insights

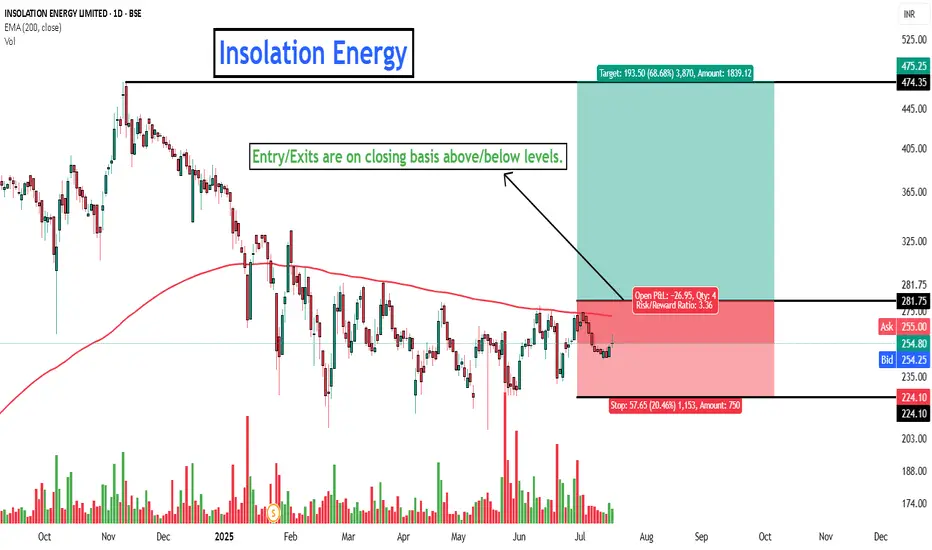
DON'T MISS - INSOLATION ENERGY FOR YOU!Everything is pretty much explained in the picture itself.
I am Abhishek Srivastava | SEBI-Certified Research and Equity Derivative Analyst from Delhi with 4+ years of experience.
I focus on simplifying equity markets through technical analysis. On Trading View, I share easy-to-understand insights to help traders and investors make better decisions.
Kindly check my older shared stock results on my profile to make a firm decision to invest in this.
Kindly dm for further assistance it is for free just for this stock.
Thank you and invest wisely.
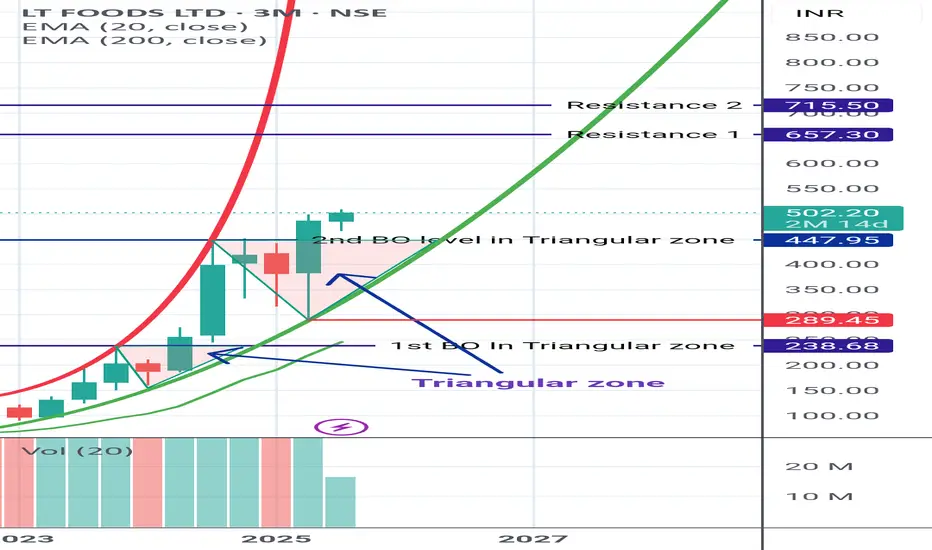
LT FOODS LT FOODS
Moving in Parabolic uptrend pattern & given Triangular zone BO Second time. Making the rally strong.
Shared it for Reference purpose based on chart pattern and My STUDY 🙏
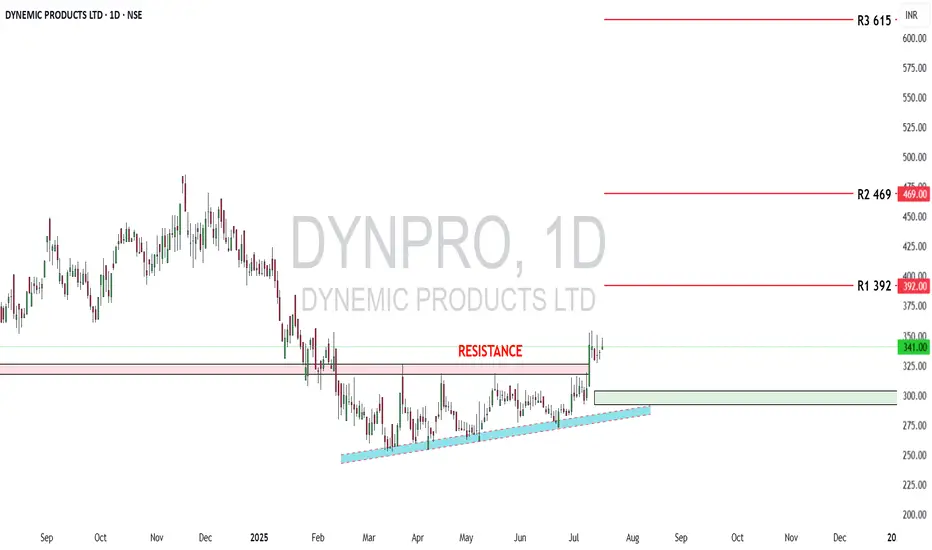
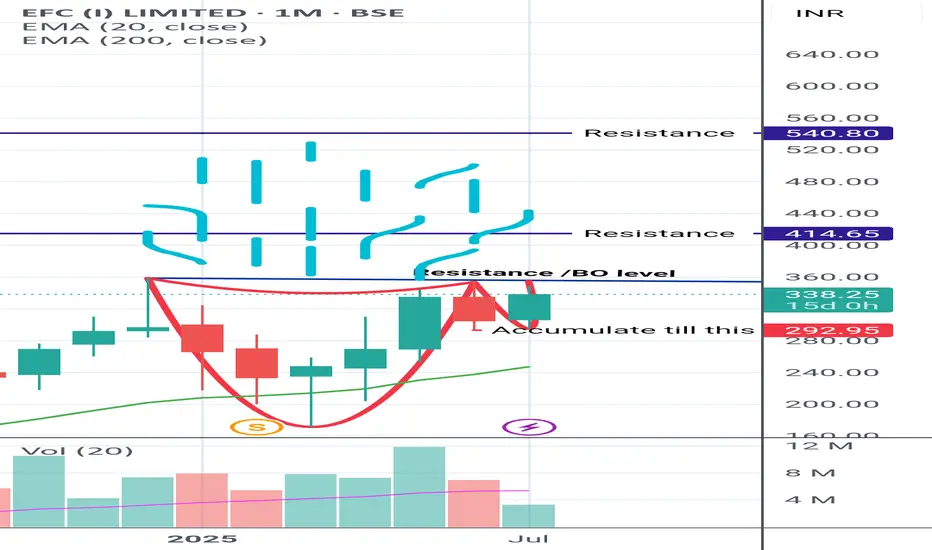
Dynemic Ltd: Bullish Setup UnfoldingDynemic Products Ltd (NSE: DYNPRO) is a well-established exporter and manufacturer of synthetic food-grade dyes, lake colors, and D&C colors, catering to global markets. As of July 16, 2025, the stock trades at ₹341 and has recently broken out of a prolonged consolidation zone, indicating renewed investor interest.
From a fundamental perspective, the company’s financials show notable improvements:
🔸 Revenue (FY25): ₹214 crore, up 29% YoY
🔸 Net Profit (FY25): ₹15 crore, up 269% YoY
🔸 EPS (TTM): ₹3.65
🔸 P/E Ratio: ~23× – moderately valued
🔸 P/B Ratio: ~1.56× – near fair book value
🔸 ROE: ~7%, showing improving return to shareholders
🔸 ROCE: ~12.7%, indicating decent operational efficiency
🔸 Debt-to-Equity: ~0.43× – financially stable
🔸 Current Ratio: ~0.95× – slightly below ideal liquidity levels
🔸 Operating Cash Flow: ₹28 crore – healthy cash generation
While the company has a stable balance sheet and growing profitability, investors should note that liquidity remains slightly tight, requiring careful monitoring of working capital and short-term obligations. Nonetheless, the financial turnaround and earnings consistency signal strength.
On the technical front, the stock has shown strong bullish action after breaking above a multi-month resistance:
🔹 Breakout Zone Cleared: ₹325–₹330 (previous resistance)
🔹 Current Price: ₹341
🔹 Reversal Zone (Strong Support): ₹292 to ₹304
🔹 R1: ₹392 – short-term resistance
🔹 R2: ₹469 – medium-term target
🔹 R3: ₹615 – long-term upside if momentum sustains
The breakout is confirmed with increased volume and a clear higher-high, higher-low structure, validating bullish sentiment. The price now rides above a rising trendline, suggesting trend continuation unless a breakdown occurs below ₹292.
In summary, Dynemic Products Ltd currently offers a compelling techno-fundamental setup. The financials have improved significantly, valuations remain reasonable, and the technical breakout suggests potential for further upside. Investors can consider accumulating on dips above ₹304, while swing traders may target ₹392 and ₹469 in the short-to-medium term. A close watch on liquidity and cash flows is advised, but the stock presents a strong growth case in the specialty chemicals space.
Disclaimer: lnkd.in
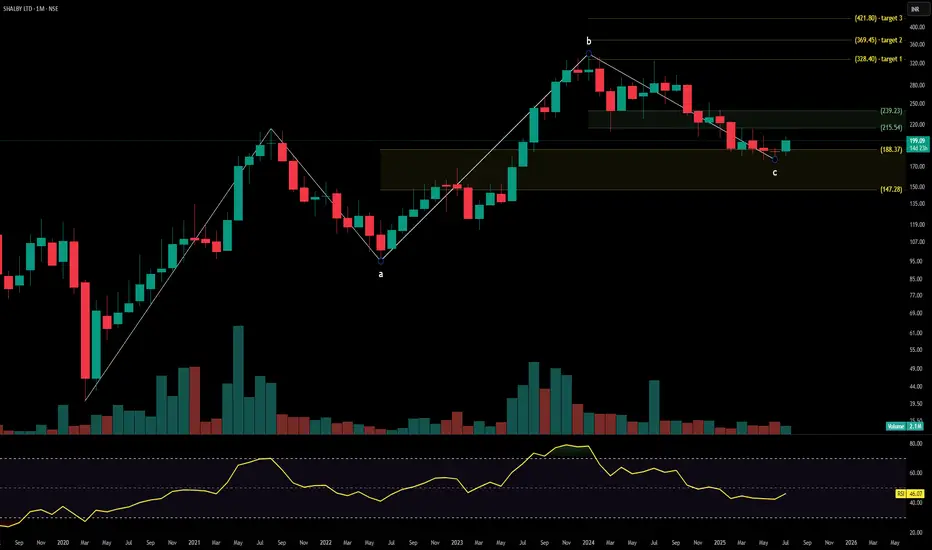
SHALBY HOSPITALSShalby Ltd. is a multi-specialty hospital chain with a strong presence across orthopedics, joint replacement, cardiology, oncology, and critical care services. With operations spanning India and growing international outreach through medical tourism, the company continues to expand its healthcare network via asset-light and franchise models. The stock is currently trading at ₹247.90 and is forming a base on the monthly timeframe after a broad correction. Fibonacci breakout targets are mapped toward ₹328.40, ₹369.45, and ₹421.80.
Shalby Ltd. – FY22–FY25 Snapshot
Sales – ₹607 Cr → ₹682 Cr → ₹748 Cr → ₹816 Cr – Expansion driven by new centers and service diversification
Net Profit – ₹46.3 Cr → ₹52.5 Cr → ₹61.8 Cr → ₹70.2 Cr – Improving earnings with cost optimization
Company Order Book – Moderate → Moderate → Strong → Strong – Increased traction in Tier-2 urban centers and surgical specialties
Dividend Yield (%) – 0.48% → 0.51% → 0.55% → 0.58% – Steady payouts with retained earnings
Operating Performance – Moderate → Moderate → Strong → Strong – Margin uplift from blended specialty mix
Equity Capital – ₹10.87 Cr (constant) – Efficient capital structure
Total Debt – ₹158 Cr → ₹148 Cr → ₹137 Cr → ₹125 Cr – Gradual deleveraging
Total Liabilities – ₹450 Cr → ₹464 Cr → ₹478 Cr → ₹494 Cr – Scaling with clinical expansion
Fixed Assets – ₹185 Cr → ₹192 Cr → ₹201 Cr → ₹210 Cr – Conservative capex, focused on infra and surgical equipment
Latest Highlights FY25 net profit rose 13.5% YoY to ₹70.2 Cr; revenue increased 9.1% to ₹816 Cr EPS: ₹6.46 | EBITDA Margin: 21.8% | Net Margin: 8.60% Return on Equity: 15.94% | Return on Assets: 9.37% Promoter holding: 71.63% | Dividend Yield: 0.58% Expansion into Udaipur, Surat, and Indore driving specialty-led patient volume Medical tourism and robotic surgery verticals gaining revenue traction
Institutional Interest & Ownership Trends Promoter holding remains strong at 71.63% with no dilution or pledging. Mutual fund positions have remained steady, while HNI accumulation is visible via delivery volumes in Q1 FY26. FII participation remains minimal, with domestic interest driving stability in ownership structure.
Business Growth Verdict Yes, Shalby is growing steadily with diversified service lines Margins and return metrics are trending upward Debt reduction is consistent and manageable Asset-light model enhances scalability without aggressive capex
Company Guidance Management expects FY26 revenue to cross ₹900 Cr+ with mid-teen margin targets. Growth will be led by expansion in cardiac care, ortho surgeries, and increased occupancy across existing units.
Final Investment Verdict Shalby Ltd. offers a disciplined healthcare growth story with consistent profitability, high promoter confidence, and expanding patient base. The asset-light hospital expansion and focus on surgical verticals provide margin support. Technical structure indicates breakout potential above ₹239–₹247 zone with medium-term targets mapped at ₹328.40, ₹369.45, and ₹421.80, making the stock attractive for staggered accumulation by investors seeking healthcare exposure in the mid-cap space.
Exide Industries Ready for the Next Bull Run !! Powering Up !!there are two chart of Exide Industries.
In a first chart: EXIDEIND is moving in a well defined parallel channel and currently trading near at support 365-375 range
In the second chart,EXIDEIND is respecting support at both the monthly pivot and the supertrend indicator, with the support zone positioned between ₹365-₹370.
EXIDEIND is currently sustaining below both the monthly and weekly pivot levels at ₹290. As long as the stock does not break above this pivot zone, the momentum is expected to remain weak.
If this level is suatin then ,we may see higher prices in EXIDEIND.
Thank you !!

EFCIL is getting hot. Currently on Breakout stage in CUP and HANDLE PATTERN.
On Breakout confirmation,
The marked resistance will be the tgt
Hindustan Petroleum Corporation LtdHindustan Petroleum Corporation Ltd is mainly engaged in the business of refining of crude oil and marketing of petroleum products, production of hydrocarbons as well as providing services for management of E&P Blocks
Current Price
₹ 446
High / Low
₹ 457 / 288
Stock P/E
14.1
Book Value
₹ 240
Dividend Yield
2.34 %
ROCE
10.5 %
ROE
13.7 %
Face Value
₹ 10.0
Price to book value
1.80
Intrinsic Value
₹ 289
PEG Ratio
0.97
Price to Sales
0.22
Debt
₹ 70,558 Cr.
Debt to equity
1.38
Int Coverage
3.67

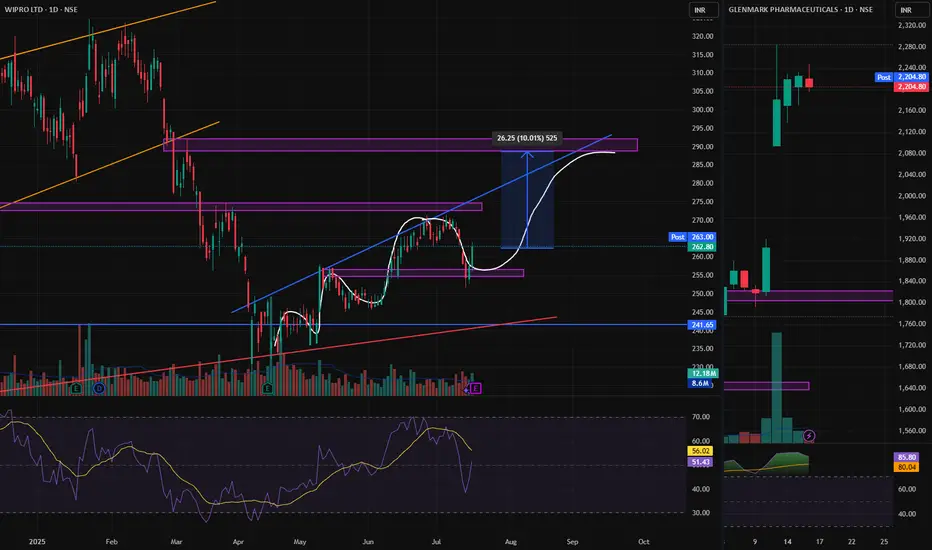
WIPRO, CREATING NEW HIGHER HIGHWIPRO, Creating new higher high pattern, this can reward us with 10% return in few weeks. mark the levels and plan your trade.

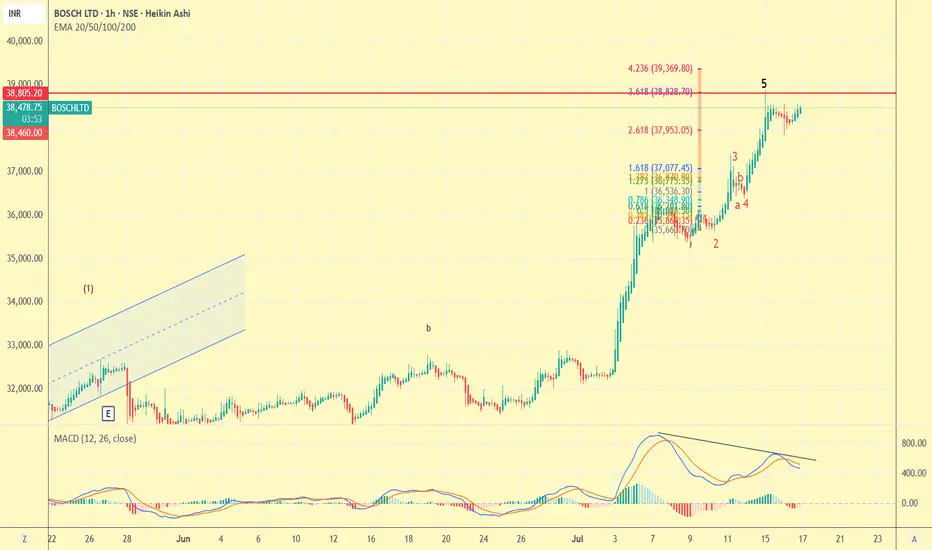
bosch-sell on riseas visible completion of 5th wave and negative div . It would be good if one books profit and enter at lower level or may use trailing stoploss .
STATE BANK OF INDIA IN A BULLISH MOMENTUMThe technical setup suggests bullish momentum with Elliott Wave supporting continuation higher. Key upside levels are ₹850 and ₹880, as long as the price holds above trend support near ₹820-₹830. A failure below this zone would weaken the bullish outlook.

SHRIRAM FINANCE LIMITED in a channelThe stock experienced a strong bullish move (5-wave uptrend), currently consolidating inside an upward channel.
Price is facing resistance near ₹700–₹735.
The momentum indicator (RSI) suggests no extreme buying or selling; trend is neutral to cautiously bullish unless a clear breakout or breakdown occurs.
Support: Lower channel boundary (~₹660).
Resistance: ₹700–₹735.
Strong move above resistance could signal further upside; a break below the channel may indicate a corrective decline.

Swing trade monthly ...swan energy swan energy seem to be taking support at a major support level ....
this stock seem to be a swing long

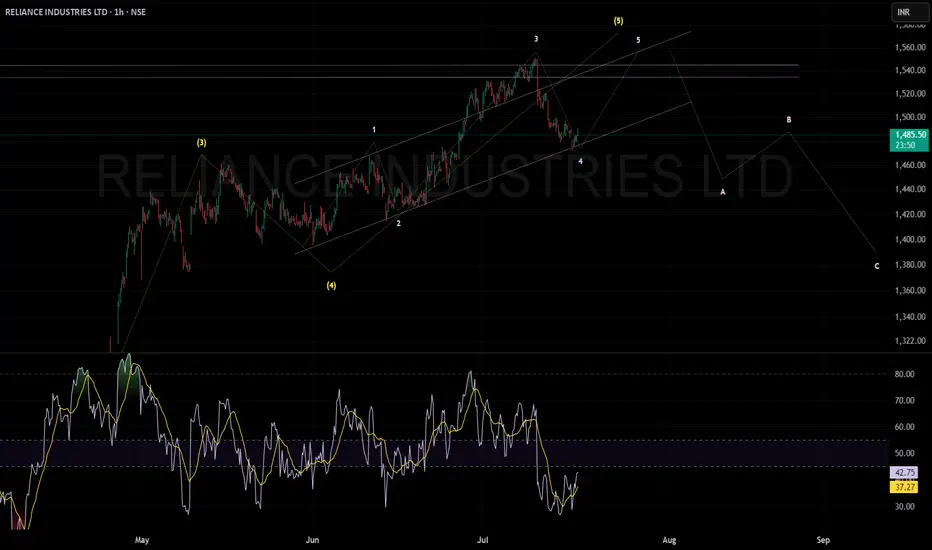
RELIANCE INDUSTRIES CAN MOVE UP IN 5TH WAVEReliance Industries appears poised to complete its final bullish wave with an upward move toward 1550, following which a corrective retracement is likely.
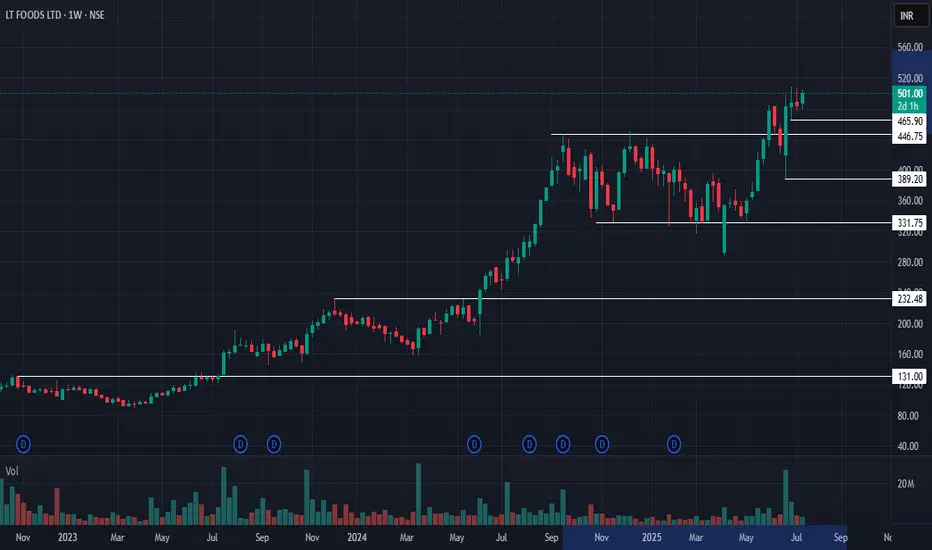
LT Foods: Ready for the Next Rally?🚀 LT Foods: Ready for the Next Rally? 🚀
📉 CMP: ₹502
🔒 Stop Loss: ₹460
🎯 Targets: ₹550 | ₹590
🔍 Why LT Foods Looks Promising?
✅ Big Base Breakout: Strong structural breakout with successful retest
✅ All-Time High Zone: Stock is hovering at its all-time high, indicating strength
✅ Double Doji Weekly Breakout: Preempting a breakout after a double doji weekly formation—a powerful continuation signal
💡 Strategy & Risk Management:
📈 Staggered Entry: Accumulate in phases to navigate volatility effectively
🔒 Strict SL: Maintain stop loss at ₹460 to protect capital in case of reversal
📍 Outlook: LT Foods is exhibiting strong bullish momentum with technical confirmations aligning for the next leg up.
📉 Disclaimer: Not SEBI-registered. Please do your own research or consult a financial advisor before investing.
#LTFoods #BreakoutStocks #TechnicalAnalysis #SwingTrading #StockMarketIndia #InvestSmart
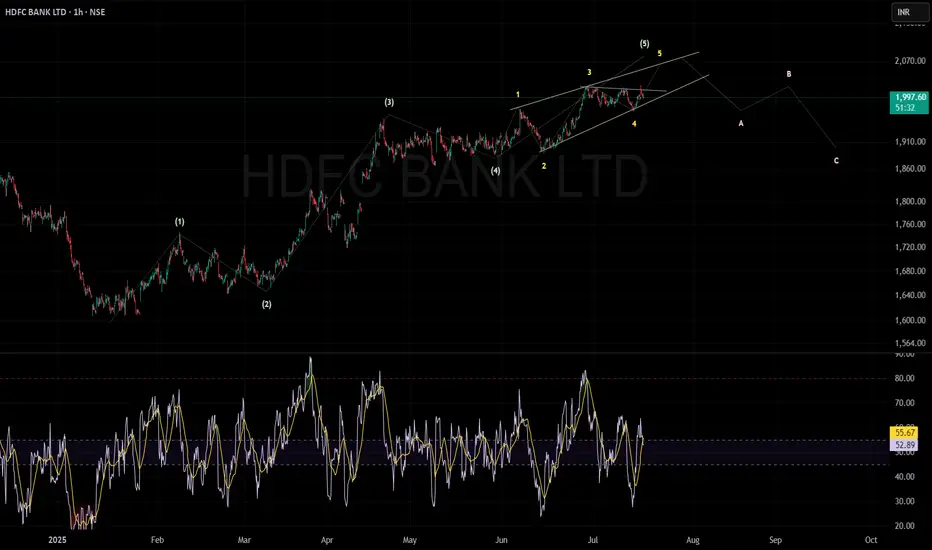
HDFC BANK can move 5th wave upHDFC Bank is currently in the last (5th) wave of an uptrend. This wave is moving inside a narrow, rising wedge pattern called an ending diagonal.
The price can move higher towards ₹2,050–₹2,100 before the trend finishes.
If the price breaks below the bottom of the wedge pattern (ending diagonal), it could confirm a trend reversal, likely leading to a correction.
After the peak, the chart suggests a three-step drop (A, B, and C waves), with possible support around ₹1,910 and then ₹1,850.
The RSI (Relative Strength Index) is around 53, meaning the trend isn't overbought or oversold yet.
In short: The uptrend is close to ending. Watch for a break below the wedge—this could start a move down toward ₹1,910 first, then maybe ₹1,850.