Reliance Entry done @ 1425Reliance Industries Ltd (RIL) shares are experiencing a decline, currently trading around ₹1424-1425. This recent dip comes despite the company reporting robust Q1 FY26 results with a significant 78% year-on-year rise in consolidated net profit to ₹26,994 crore, largely driven by a one-time gain from the stake sale in Asian Paints.
Current Scenario and Key Observations:
* Falling Price: The stock has seen a considerable fall in the past few days, with reports indicating a crash of around 2.7% on BSE today, and a drop of over 6% in July so far.
* Q1 FY26 Performance:
* Net Profit: RIL reported its highest-ever consolidated net profit of ₹26,994 crore for Q1 FY26, significantly beating market estimates.
* Revenue: Revenue from operations increased by 5.3% to ₹2,48,660 crore.
* EBITDA: Consolidated EBITDA jumped 36% to ₹58,024 crore, with EBITDA margin improving to 21.2%.
* Segmental Performance:
* Jio Platforms: Reported a strong 23.9% YoY increase in EBITDA, driven by ARPU growth and operational efficiency. Jio has also surpassed 200 million 5G subscribers.
* Reliance Retail: Posted an 11.3% YoY increase in revenue, though some reports indicate a slowdown in consumer electronics sales and space addition lagging expectations.
* Oil-to-Chemicals (O2C): Saw a slight revenue decline due to weaker crude prices and planned maintenance, but EBITDA climbed due to improved transportation fuel margins.
* Analyst Outlook: Despite the recent fall, many major brokerages have maintained "Buy" or "Overweight" ratings on RIL, with target prices generally ranging from ₹1500 to ₹1767. They remain sanguine about RIL's long-term growth prospects, especially in the New Energy segment, Jio, and Retail.
* Growth Drivers:
* New Energy: RIL is heavily investing in the new energy sector, with plans to commission giga-factories for solar PV, fuel cells, and batteries over the next 4-6 quarters, aiming for a self-funded platform and perpetual growth.
* Digital Services: Continued expansion and growth in Jio Platforms, including 5G deployment and broadband connections.
* Retail Expansion: Ongoing growth and diversification within the retail segment.
* Debt: While the net profit was record-breaking, net debt has slightly increased, reflecting capex intensity in digital infrastructure, new energy, and retail expansion.
Investment Consideration with Stop Loss:
Given the current falling price at ₹1424 and your stated stop loss limit of not more than 5% of your total portfolio, this indicates a cautious approach. While the stock has corrected, many analysts see this as a potential buying opportunity due to strong fundamentals and future growth drivers, especially in the New Energy and Digital segments.
However, it is crucial to consider:
* Volatility: RIL stock is currently exhibiting some volatility.
* Market Sentiment: The broader market conditions and immediate investor reaction to the Q1 results seem to be weighing on the stock despite the strong underlying performance.
* Risk Management: Adhering to your 5% portfolio stop loss is a prudent strategy to mitigate potential downside risk in a volatile market.
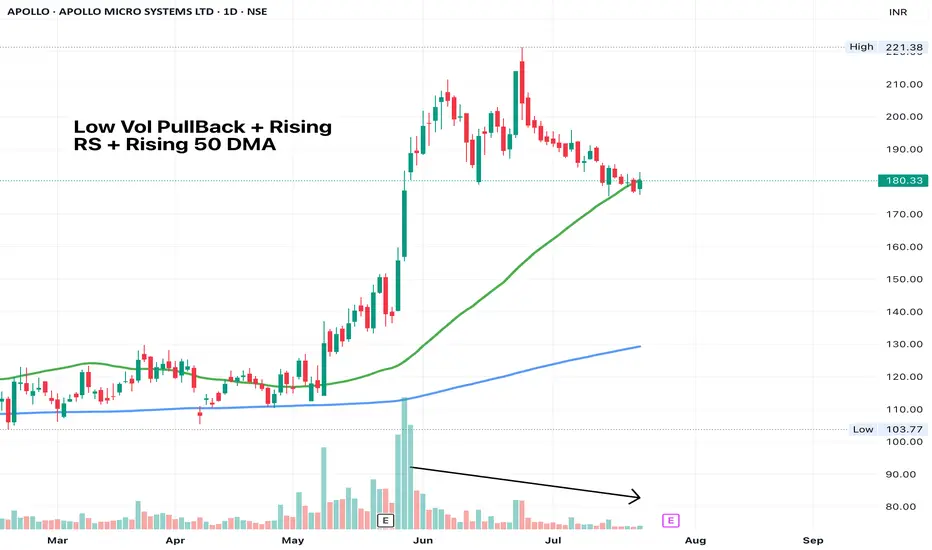
APOLLO - Low vol PullbackWait for one good wide-range candle to take entry. Price often cuts below 50 DMA, forms a small base and gives a breakout candle. This might do that.
SL - Low of the pullback
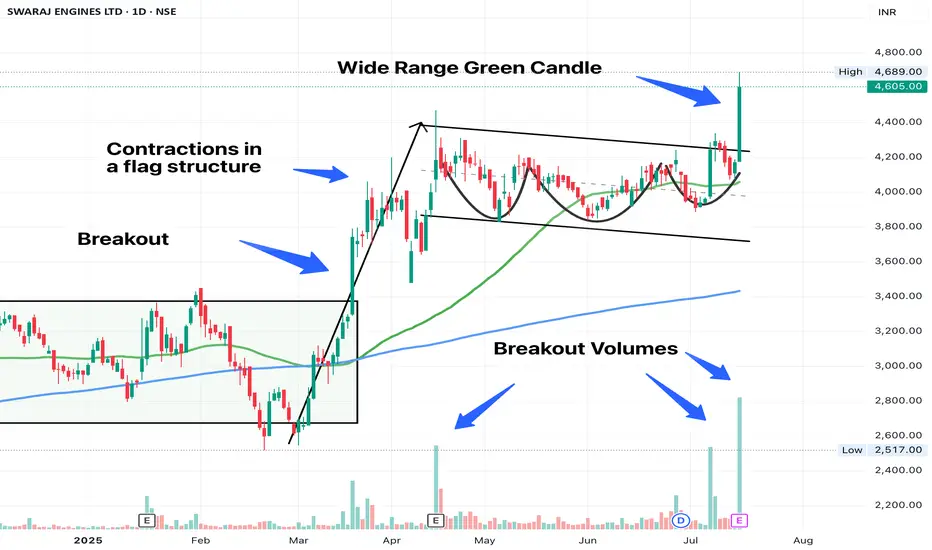
SWARAJ ENGINE - Textbook StructureContractions within a flag is such a beautiful thing to see.
SL - Low of todays candle. End of day candle should have minimal wick ideally.
Choose a progressive exposure method of entry
SKYGOLD Near 200 EMA | Accumulation Phase with Strength📈 Chart Timeframe: Daily
SKYGOLD is currently trading above the 200 EMA after multiple attempts to hold this zone. This suggests strong support at that level. Recent candles are forming higher lows, indicating a possible accumulation phase.
RSI is also recovering from the 40–50 zone, showing early strength. Volume spike seen in recent sessions could be an early sign of interest by participants.
🔍 I’m observing this structure closely for a possible breakout, only if supported by volume.
This is not a buy/sell recommendation. Just sharing a chart study for learning and discussion.
Disclaimer: This post is only for educational purposes. I am not SEBI registered. Please do your own analysis before making any trading decision.

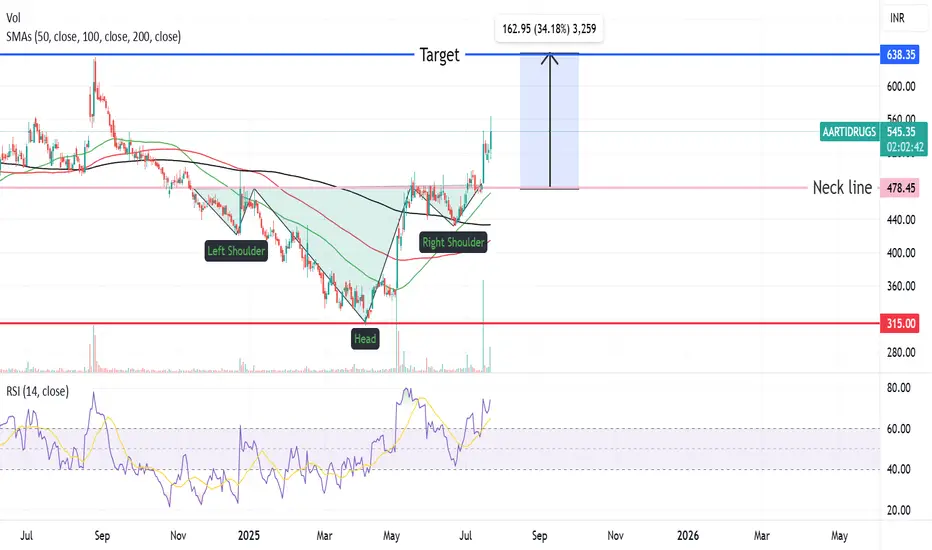
Aarti Drugs Reverse Head & Shoulder Pattern BreakoutAarti Drugs Reverse Head & Shoulder Pattern Breakout happened above neckline(478 Rs) .Target of this breakout will be arround 630 level with a stoploss of 470 level.
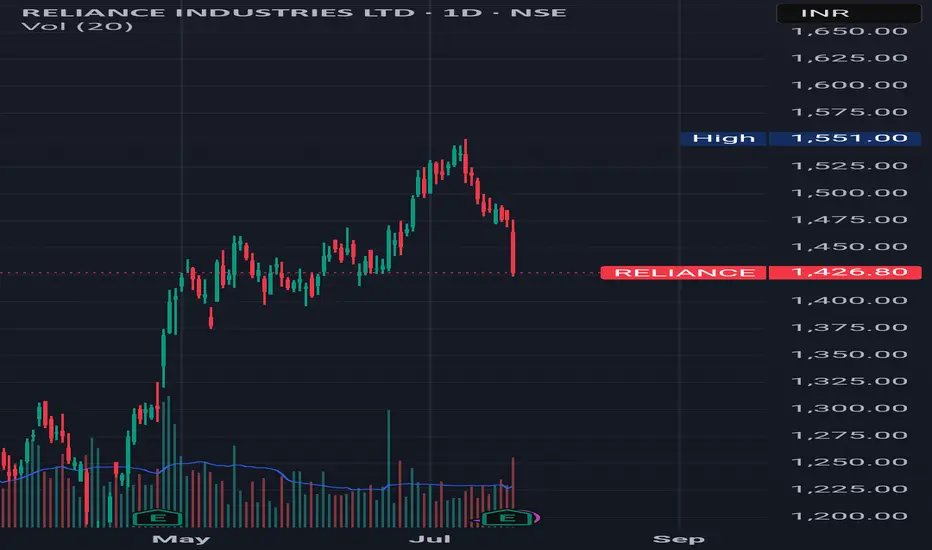
What to do with Reliance share after its drubbing today? Reliance looks weak post result however there is no spike in volume of sale that is a good point. The levels from which Reliance can recover seem to be 1427, 1370 or 1323. If we get a closing below 1323 the stock can fall to 1217 or even 1160 levels this is the reading as of now.
The result was looking good but on deeper scrutiny it was understood that major chunk was profit was due to sale of Reliance stake in Asian Paints business. This I think is not liked by the market specially the retail investors.
The stock has tanked close to 3% as of now but there is no huge selling seen from HNIs or MFs (As of now). (This is an assumption looking at the volume of sale) Volumes are similar to normal day of trade.
May be as retail investors panic MFs, HNIs and others might gulp the stock. Cant say clearly. We might reanalyze by end of the day but caution: Do not sell Reliance in Panic. Result was average it was not bad even if we ignore the Asian paint factor so. Currently I am not selling Reliance I am holding on to it. Might add at lower levels.
Disclaimer: The above information is provided for educational purpose, analysis and paper trading only. Please don't treat this as a buy or sell recommendation for the stock or index. The Techno-Funda analysis is based on data that is more than 3 months old. Supports and Resistances are determined by historic past peaks and Valley in the chart. Many other indicators and patterns like EMA, RSI, MACD, Volumes, Fibonacci, parallel channel etc. use historic data which is 3 months or older cyclical points. There is no guarantee they will work in future as markets are highly volatile and swings in prices are also due to macro and micro factors based on actions taken by the company as well as region and global events. Equity investment is subject to risks. I or my clients or family members might have positions in the stocks that we mention in our educational posts. We will not be responsible for any Profit or loss that may occur due to any financial decision taken based on any data provided in this message. Do consult your investment advisor before taking any financial decisions. Stop losses should be an important part of any investment in equity.

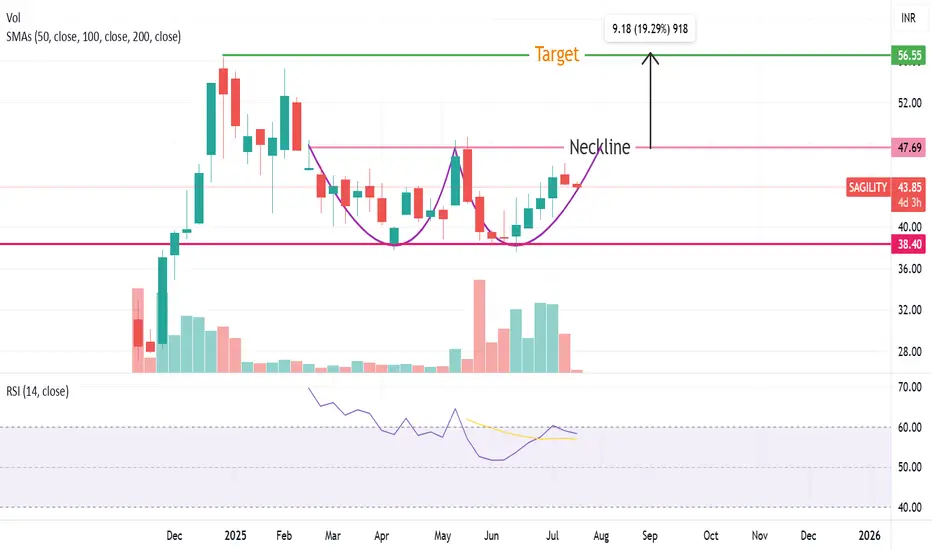
Sagility India ,Double Bottom Pattern formation going onSagility India, Forming Double Bottom pattern. Breakout of this pattern will be above 47 level .
Target price will be arround 56 with a stoploss of 40 rs .One can accumulate the stock at current price.
GLOSTERLTDGLOSTERLTD
watch above levels. green line is our entry, redline is our SL.
DISCLAIMER : I am NOT a SEBI registered advisor or a financial adviser. All the views are for educational purpose only.

Yatharth, Resistance, 1D, LongYatharth has created a good support at 605, however it has not filled the FVG created between 645 and 650. Once it filled this FVG and crosses 650 with Bullish candlestick patterns like Bullish Engulfing, Hammer & Inverted Hammer, Piercing Line, Morning Star, Three White Soldiers, Tweezer Bottoms or Bullish Harami, then chances of it moving upward is higher. Enter the stock above 650 for the targets of 680 and 695.
Enter 650
Target 690-695.

ashokkleyNSE:ASHOKLEY
One Can Enter Now !
Or Wait for Retest of the Trendline (BO) !
Or wait For better R:R ratio !
Note :
1.One Can Go long with a Strict SL below the Trendline or Swing Low.
2. R:R ratio should be 1 :2 minimum
3. Plan as per your RISK appetite and Money Management.
Disclaimer : You are responsible for your Profits and loss, Shared for Educational purpose

HBL Engineering at support, Long, 1DHBL Engineering is at its support, if it breaks and sustains 600 level then we may see it upward move in it for 620 and 645. Enter in the trade if it show any Bullish candlestick patterns like Bullish Engulfing, Hammer & Inverted Hammer, Piercing Line, Morning Star, Three White Soldiers, Tweezer Bottoms or Bullish Harami above 600.
Entry: 600 (only at Bullish candlestick patterns)
Target1: 620
Target2: 645

Mastek, Resistance, 1D LongMastek has crossed 2800 and made high of 2818, however it was unable to sustain it. If it crosses the level of 2800 with Bullish candlestick patterns like Bullish Engulfing, Hammer & Inverted Hammer, Piercing Line, Morning Star, Three White Soldiers, Tweezer Bottoms or Bullish Harami then we can see it going to fill FVG (Fair Value Gap) created previously upto 2950.
Entry above 2800
Target 1: 2850-2870
Target2: 2870-2920

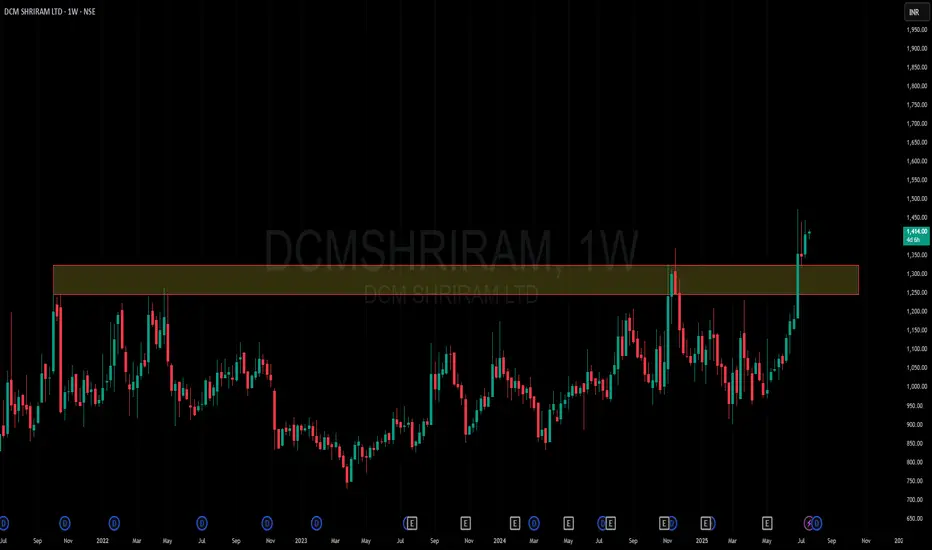
Amazing breakout on WEEKLY Timeframe - DCMSHRIRAMCheckout an amazing breakout happened in the stock in Weekly timeframe, macroscopically seen in Daily timeframe. Having a great favor that the stock might be bullish expecting a staggering returns of minimum 25% TGT. IMPORTANT BREAKOUT LEVELS ARE ALWAYS RESPECTED!
NOTE for learners: Place the breakout levels as per the chart shared and track it yourself to get amazed!!
#No complicated chart patterns
#No big big indicators
#No Excel sheet or number magics
TRADE IDEA: WAIT FOR THE STOCK TO BREAKOUT IN WEEKLY TIMEFRAME ABOVE THIS LEVEL.
Checkout an amazing breakout happened in the stock in Weekly timeframe.
Breakouts happening in longer timeframe is way more powerful than the breakouts seen in Daily timeframe. You can blindly invest once the weekly candle closes above the breakout line and stay invested forever. Also these stocks breakouts are lifelong predictions, it means technically these breakouts happen giving more returns in the longer runs. Hence, even when the scrip makes a loss of 10% / 20% / 30% / 50%, the stock will regain and turn around. Once they again enter the same breakout level, they will flyyyyyyyyyyyy like a ROCKET if held in the portfolio in the longer run.
Time makes money, GREEDY & EGO will not make money.
Also, magically these breakouts tend to prove that the companies turn around and fundamentally becoming strong. Also the magic happens when more diversification is done in various sectors under various scripts with equal money invested in each N500 scripts.
The real deal is when to purchase and where to purchase the stock. That is where Breakout study comes into play.
Check this stock which has made an all time low and high chances that it makes a "V" shaped recovery.
> Taking support at last years support or breakout level
> High chances that it reverses from this point.
> Volume dried up badly in last few months / days.
> Very high suspicion based analysis and not based on chart patterns / candle patterns deeply.
> VALUABLE STOCK AVAILABLE AT A DISCOUNTED PRICE
> OPPURTUNITY TO ACCUMULATE ADEQUATE QUANTITY
> MARKET AFTER A CORRECTION / PANIC FALL TO MAKE GOOD INVESTMENT
DISCLAIMER : This is just for educational purpose. This type of analysis is equivalent to catching a falling knife. If you are a warrior, you throw all the knives back else you will be sorrow if it hits SL. Make sure to do your analysis well. This type of analysis only suits high risks investor and whose is willing to throw all the knives above irrespective of any sectoral rotation. BE VERY CAUTIOUS AS IT IS EXTREME BOTTOM FISHING.
HOWEVER, THIS IS HOW MULTIBAGGERS ARE CAUGHT !
STOCK IS AT RIGHT PE / RIGHT EVALUATION / MORE ROAD TO GROW / CORRECTED IV / EXCELLENT BOOKS / USING MARKET CRASH AS AN OPPURTUNITY / EPS AT SKY.
LET'S PUMP IN SOME MONEY AND REVOLUTIONIZE THE NATION'S ECONOMY!

Raymond, 4Hr, Long, ResistanceRaymond is showing a resistance in 4 hour Time Frame. If it closes above 765 then it may go up from here, if it closes above it with Bullish candlestick patterns like Bullish Engulfing, Hammer & Inverted Hammer, Piercing Line, Morning Star, Three White Soldiers, Tweezer Bottoms or Bullish Harami.
Entry: 765
Target: 800

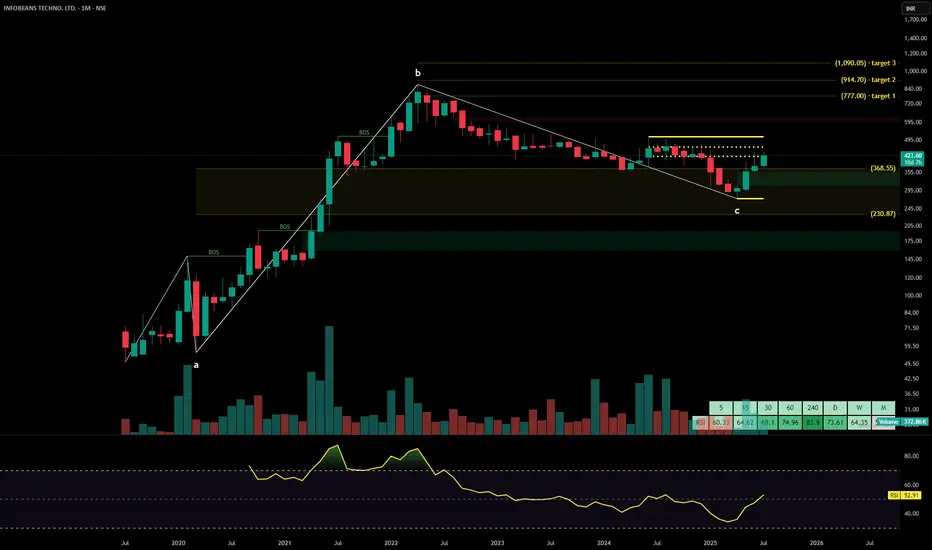
INFOBEANS TECHNOLOGYInfoBeans Technologies Ltd. is a digital transformation and product engineering company offering enterprise solutions, UX-led development, cloud services, and automation frameworks across global markets. With a client base spanning Fortune 500 companies and sectors such as healthcare, finance, and real estate, the company maintains a strong offshore delivery model and innovation culture. The stock is currently trading at ₹423.60.
InfoBeans Technologies Ltd. – FY22–FY25 Snapshot
Sales – ₹164 Cr → ₹198 Cr → ₹223 Cr → ₹249 Cr – Consistent growth through contract wins and diversification
Net Profit – ₹30.7 Cr → ₹35.8 Cr → ₹41.2 Cr → ₹47.6 Cr – Expanding margins backed by digital and automation
Company Order Book – Moderate → Strong → Strong → Strong – Robust pipeline in cloud modernization and UI/UX platforms
Dividend Yield (%) – 0.00% → 0.00% → 0.00% → 0.00% – Reinvestment-focused strategy with no distributions
Operating Performance – Moderate → Strong → Strong → Strong – SaaS-led leverage improving delivery efficiency
Equity Capital – ₹9.02 Cr (constant) – Lean capital structure without dilution
Total Debt – ₹0 Cr (debt-free) – Zero leverage, fully equity-financed operations
Total Liabilities – ₹72 Cr → ₹78 Cr → ₹84 Cr → ₹91 Cr – Gradual scale-up with delivery expansion
Fixed Assets – ₹28 Cr → ₹30 Cr → ₹33 Cr → ₹36 Cr – Light capex aligned to facility upgrades and automation tools
Latest Highlights FY25 net profit rose 15.5% YoY to ₹47.6 Cr; revenue increased 11.7% to ₹249 Cr EPS: ₹10.53 | EBITDA Margin: 28.3% | Net Margin: 19.11% Return on Equity: 24.86% | Return on Assets: 18.65% Promoter holding: 72.44% | Dividend Yield: 0.00% New service lines launched in DevOps automation and AI-powered enterprise apps Delivery centers expanded with focus on tier-2 cost-efficient tech hubs
Institutional Interest & Ownership Trends Promoter holding remains strong at 72.44% with zero pledging or dilution. Institutional activity is limited, typical of niche mid-caps, with HNI and PMS desk accumulation seen in volume spikes. Delivery trends signal quiet confidence from domestic tech-focused allocators.
Business Growth Verdict Yes, InfoBeans continues to compound steadily across enterprise digital domains Margins remain robust with operational discipline and client retention Debt-free balance sheet and consistent earnings boost investor visibility Capex is lean and well-aligned to growth without financial stress
Company Guidance Management projects double-digit revenue growth in FY26, driven by rising U.S. client demand, cloud migration services, and proprietary product offerings in AI-led automation.
Final Investment Verdict InfoBeans Technologies Ltd. represents a scalable, high-ROE digital services player with zero leverage and strong promoter backing. Its consistent profitability, efficient cost structure, and client retention across geographies position it well for long-term accumulation. The company’s focus on enterprise modernization and automation gives it durable relevance in mid-cap IT, appealing to investors seeking margin-stable, debt-free tech exposure.
COLPAL (Swing):COLPAL (Swing):
COLPAL is getting ready for an reversal up move by breaking the past supply levels.
Script has consolidated and formed a strong base near the demand zone.
Trade offers a RR of more than 1:4.
Check out my earlier views for a better understanding.
Note: Do your own due diligence before taking any action.

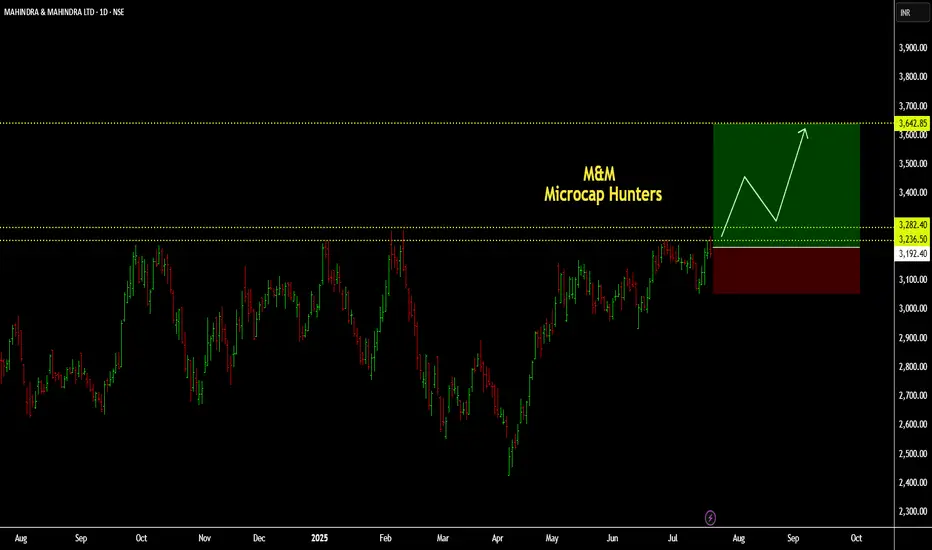
M&M (Breakout/Swing):M&M (Breakout/Swing):
M&M is getting ready to pass through the last 1 year's supply zone.
Signs of significant base formation is evident.
Trade offers a RR of more than 1:3.
Check out my earlier views for a better understanding.
Note: Do your own due diligence before taking any action.
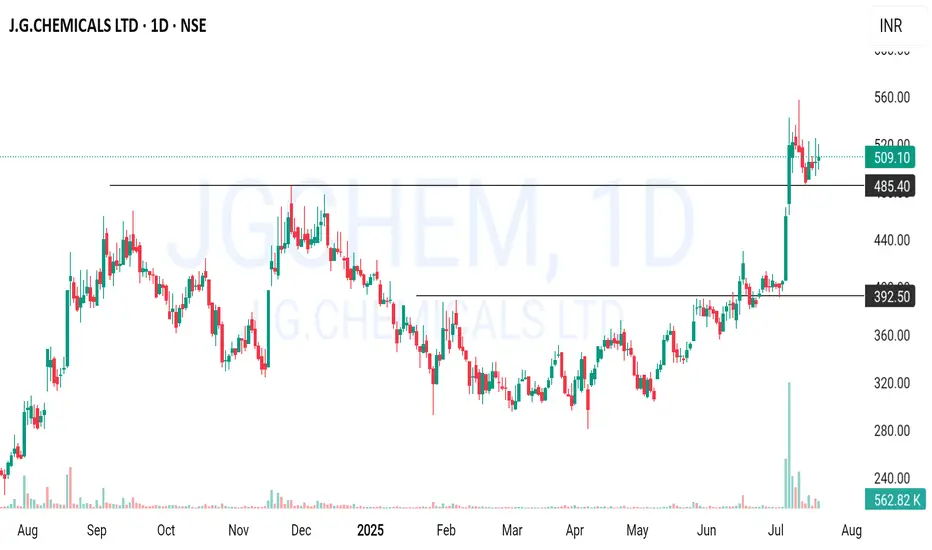
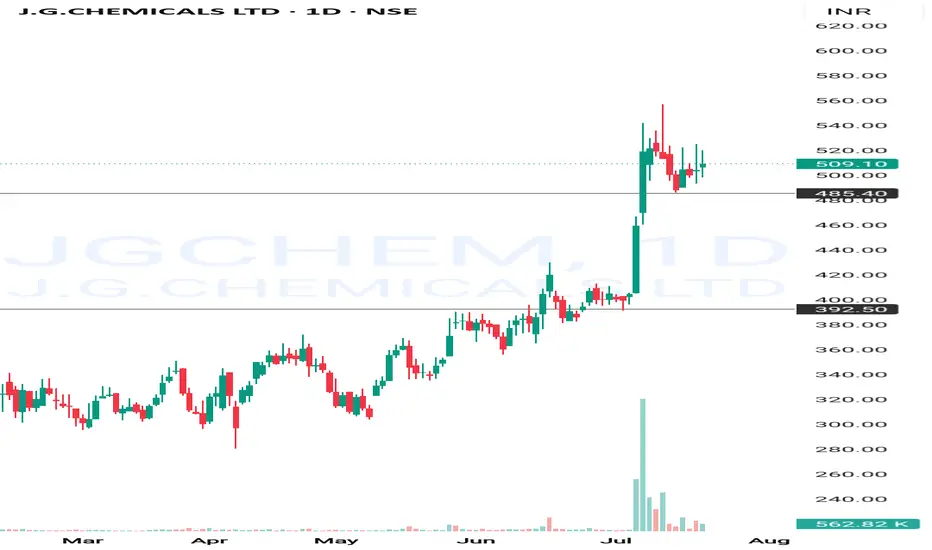
Breakout All Time High and Consolidation Chart is a perfect Breakout setup and consolidating on top of the Breakout .......
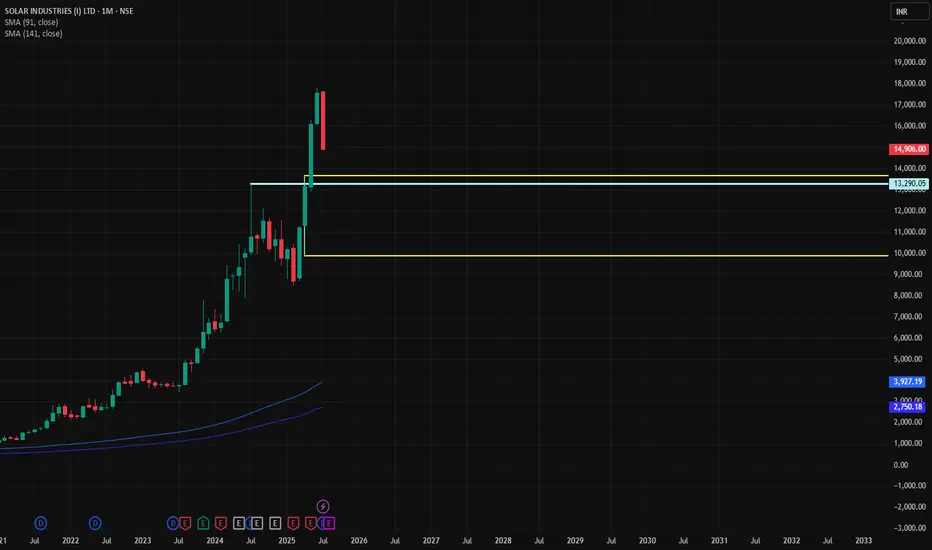
SOLAR IND🛒 Trade Plan: Buy Setup
Parameter Value
Entry 13,290
Stop Loss 11,278
Target 18,992
Risk 2,012 pts
Reward 5,702 pts
Risk-Reward 2.8 : 1
Last High 16,141
Last Low 13,290
Point Variance 2,851
🧠 Logic:
Entry is placed right at strong demand cluster on HTF & Weekly.
SL is just below the major Weekly/ITF zone.
Target is well above last swing high, offering strong RR.
DMIP (Demand Momentum Imbalance Points) on Daily & Intraday (60/180/240 mins) further supports bullish continuation.
✅ Verdict
High-conviction long trade supported by all major timeframes.
Strong demand confluence around 13,290 and below.
Maintain discipline at SL (11,278), and consider trail SL after price crosses 16,141 (previous high) for profit protection.
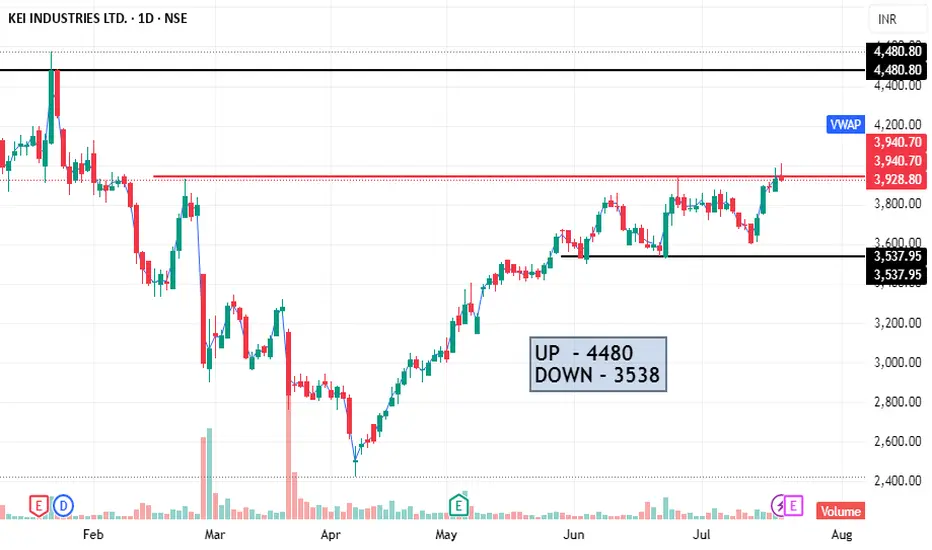
KEI is upside trend Bullish.Sharing the chart of KEI in deatil research as my opinion Trend is Bullish, if market close above 3950. TG open - 4480- 4500 with in 1 month etc.
I AM NOT A SEBI REGISTER,
Before invest or trade please consult with financial advisor.
SO This is not TIPS, SUGGESTIONS. Just Sharing my Experience.
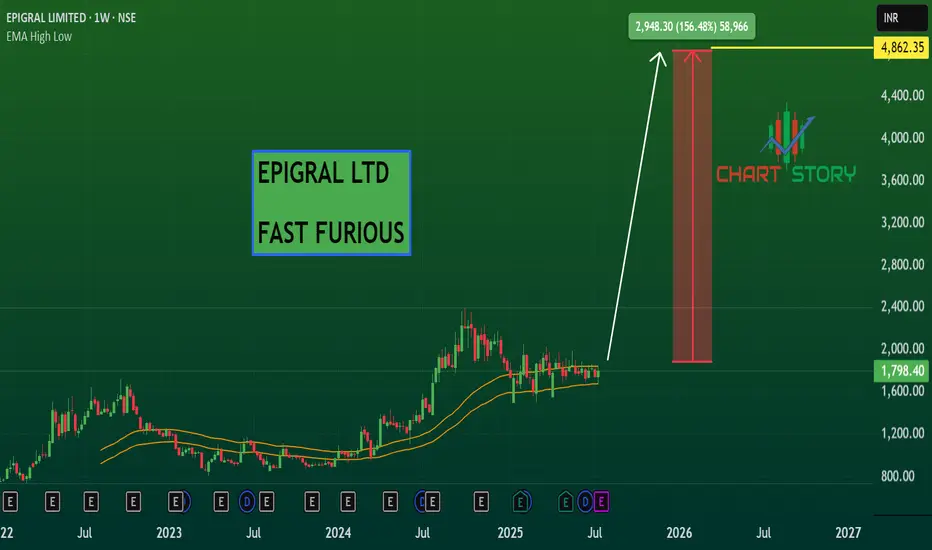
EPIGRAL - PARABOLIC BUYNSE:EPIGRAL Weekly parabolic location with accumulation for more confirmation one more buyers candle needed.