Poonawalla Fincorp BuyPoonawalla Fincorp seems to take support at trend line. Buy @CMP (455) with SL of 445 and Target of 475 & 500.

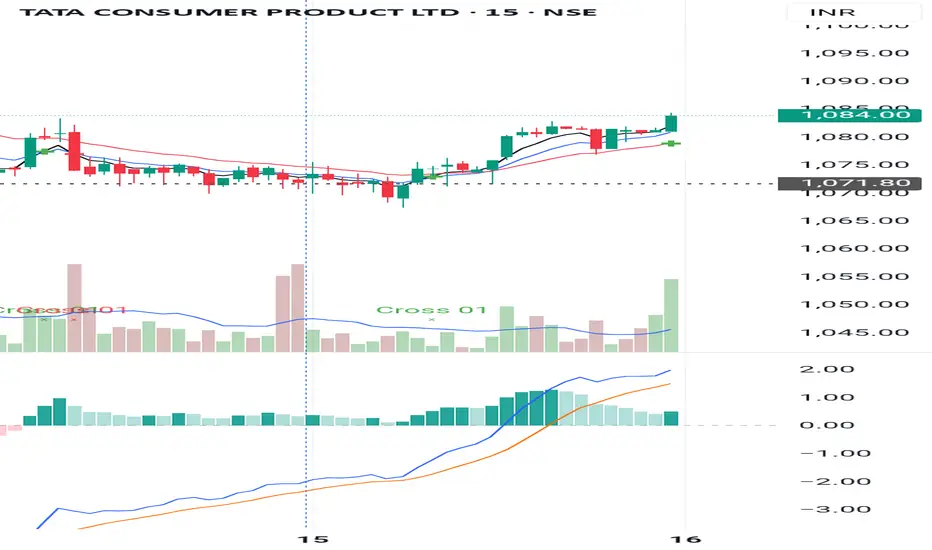
What a beautiful Wave!AARTIIND is showing a potential short-term bullish reversal after a prolonged decline, supported by RSI momentum, moving average crossover, and rising volume. A breakout above ₹486 could give a further rally toward ₹490+ Bullish Bias (If price sustains above ₹454):
Target: ₹486 → ₹492
The push will take place once the price moves above the 50 SMA - ₹474. Two cross overs have been executed. The third should bring smiles. Unless external forces act otherwise this should be an interesting trade. The rising volume speaks volumes.

Prestige Estate SellPrestige Estate breaks below trend line and trading in a range. Sell @CMP (1725) with SL of 1770 and Target of 1600.

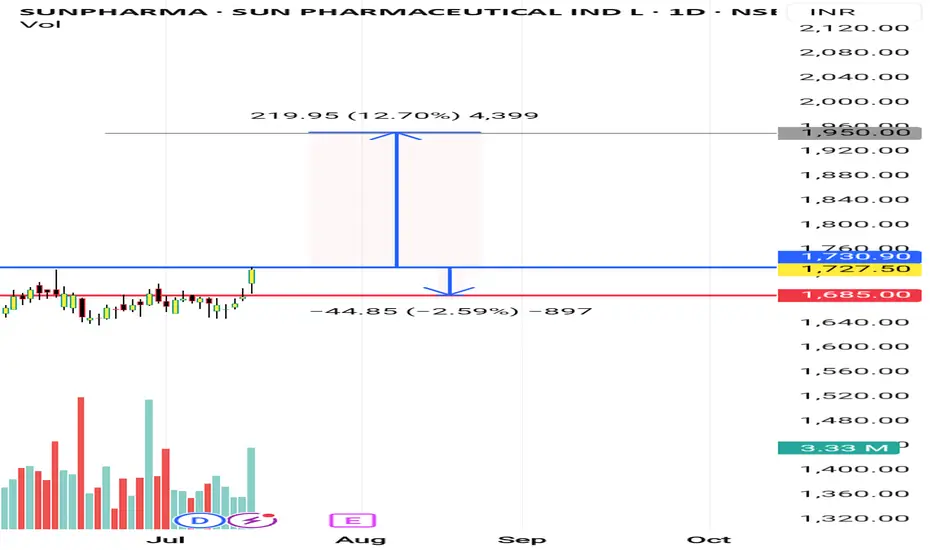
Sunpharma I'm not a SEBI REGISTERED ANYLISIS
just for learning purpose
above the blue line close in D chart candle i will buy and put strictly SL to below red line...once candle close below Red line in D chart...i will close the Trade...
Note: 1
Breakout candle should close time 6 or below 6 points I will buy same day or I will wait for the blue line price to re-trace)
Note:2
If previous volume is buyers(for ex- 10k) Breakout candle volume should be low in present day with buyers volume(below 10k for ex- 9k like this)
target check the chart
WAIT FOR ENTRY......then after
WAIT FOR TARGET...... or
WAIT FOR STOPLOSS
educational purpose only
oits simple ORB WITH VOLUME BREAKOUT STRATEGY...with small condition apply for selecting the stocks
owt not response for your profit and loss
Netweb technology I'm not a SEBI REGISTERED ANYLISIS
just for learning purpose
above the blue line close in D chart candle i will buy and put strictly SL to below red line...once candle close below Red line in D chart...i will close the Trade...
Note: 1
Breakout candle should close time 6 or below 6 points I will buy same day or I will wait for the blue line price to re-trace)
Note:2
If previous volume is buyers(for ex- 10k) Breakout candle volume should be low in present day with buyers volume(below 10k for ex- 9k like this)
target check the chart
WAIT FOR ENTRY......then after
WAIT FOR TARGET...... or
WAIT FOR STOPLOSS
educational purpose only
oits simple ORB WITH VOLUME BREAKOUT STRATEGY...with small condition apply for selecting the stocks
owt not response for your profit and loss

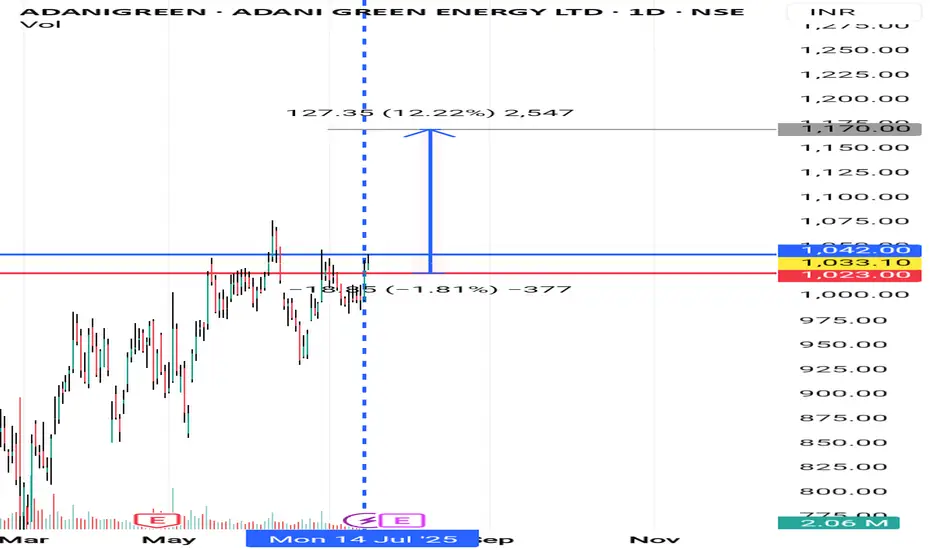
Adanigreen I'm not a SEBI REGISTERED ANYLISIS
just for learning purpose
above the blue line close in D chart candle i will buy and put strictly SL to below red line...once candle close below Red line in D chart...i will close the Trade...
Note: 1
Breakout candle should close time 6 or below 6 points I will buy same day or I will wait for the blue line price to re-trace)
Note:2
If previous volume is buyers(for ex- 10k) Breakout candle volume should be low in present day with buyers volume(below 10k for ex- 9k like this)
target check the chart
WAIT FOR ENTRY......then after
WAIT FOR TARGET...... or
WAIT FOR STOPLOSS
educational purpose only
oits simple ORB WITH VOLUME BREAKOUT STRATEGY...with small condition apply for selecting the stocks
owt not response for your profit and loss
buying opportunity at sg mart stockbuying opportunity at sg mart stock
ENTRY:364
STOPLOSS:349
TARGET:426
RISKREWARD:1:4
DATE:15.07.2025

KITEX Ready to Move out of its ResistanceKITEX is moving in tight range after making new high and now volume has declined, Today`s tiny candle indicates it may break out the resistance soon.

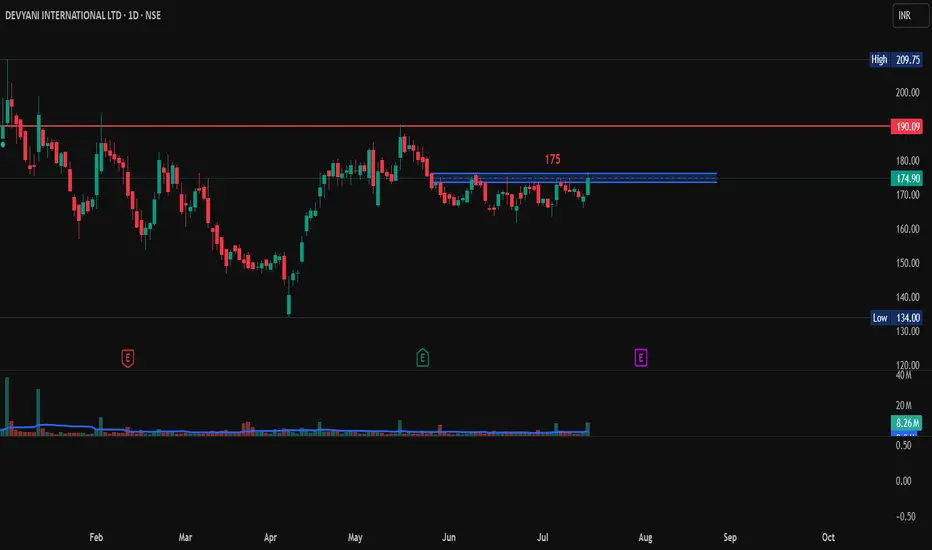
Devyani International Ltd., Long Trade, 1D Time FrameDevyani International limited so showing a good volume and is 3% up from its last day price. It has a resistance above 175. So if it breaks 175 with a good bullish candle then it may go long from here.
Entry: 175 If shows a good bullish candle stick pattern.
Target: 190 and above.
SL: 169.
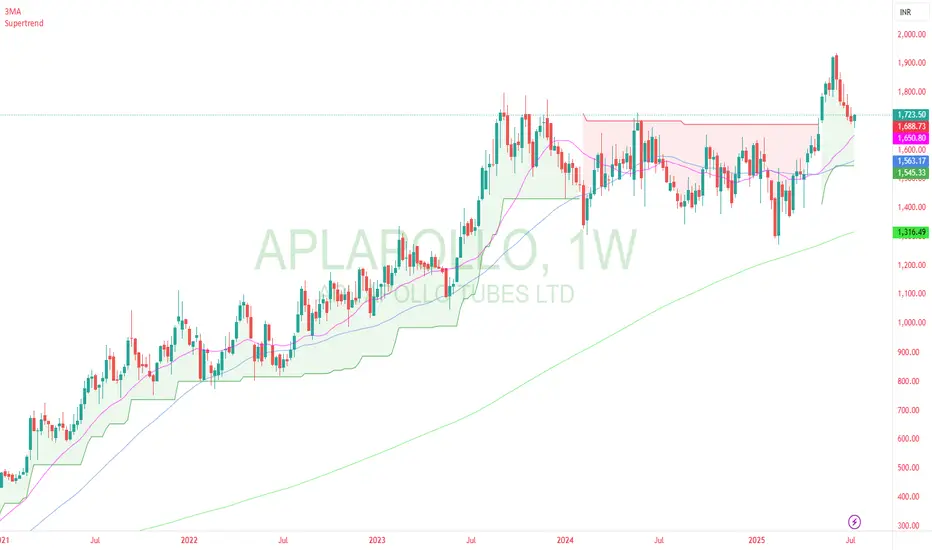
apl apollo - pullback trade apl apollo has given multimonth break out and stock gone upto 2000. Now stock has done puckback to previous resistance and stock is near ema 21 on weekly chart. This is best low risk high reward entry in good quality company/
vprpl - with double bottom vprpl is downward going stock but recently stock has made double bottom and today stock become supertrend positive on daily chart.
Next resistance would be 191 and 220.
around 220 there is old gap and previous support also. so stock may go consolidation around that level of 220.

HINDUSTAN UNILEVER BUYING ABOVE 2532..Hindustan Unilever has changed character from bearish to bullish and now in a good range.
any move above 2532 will lead to a good upside move.
let's c how it works.

HEROMOTOCO BUYING ABOVE 4465..Hero moto Corp ltd,very bullish above 4465
stock has already changed its character from bearish to bullish
and now consolidating in a good range.
looking to buy above 4465, can give very quick move whenever it happens.

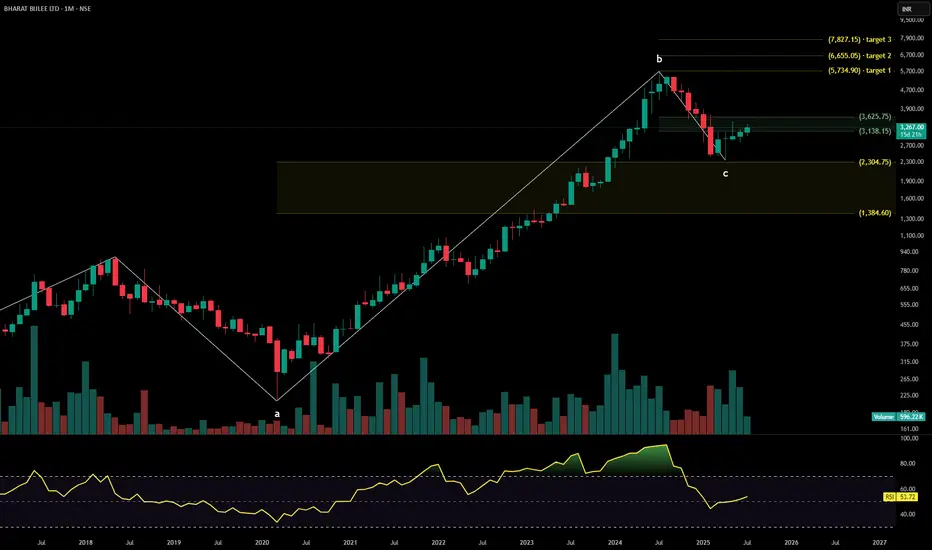
BHARAT BIJLEEBharat Bijlee Ltd. is a leading industrial electrical equipment manufacturer specializing in power transformers, electric motors, drives & automation, and project solutions. It caters to segments such as infrastructure, real estate, utilities, and OEMs. The stock is currently trading at ₹3,267 and is attempting a trend continuation post a broad consolidation, with fresh volume and Fibonacci alignment supporting breakout momentum.
Bharat Bijlee Ltd. – FY22–FY25 Snapshot
Sales – ₹750 Cr → ₹842 Cr → ₹923 Cr → ₹1,015 Cr – Steady growth driven by infra push and OEM demand
Net Profit – ₹58.3 Cr → ₹72.1 Cr → ₹84.6 Cr → ₹96.5 Cr – Margin expansion with operating scale
Company Order Book – Moderate → Strong → Strong → Strong – Solid pipeline in drives & automation
Dividend Yield (%) – 0.84% → 1.07% → 1.28% → 1.38% – Consistent payout with moderate yield
Operating Performance – Moderate → Strong → Strong → Strong – Increasing efficiency and utilization
Equity Capital – ₹5.69 Cr (constant) – Tight capital structure
Total Debt – ₹24 Cr → ₹19 Cr → ₹13 Cr → ₹10 Cr – Deleveraging over time
Total Liabilities – ₹302 Cr → ₹312 Cr → ₹319 Cr → ₹325 Cr – Stable with managed debt component
Fixed Assets – ₹123 Cr → ₹129 Cr → ₹136 Cr → ₹141 Cr – Conservative capex, efficiency-focused
Latest Highlights FY25 net profit grew 14.1% YoY to ₹96.5 Cr; revenue increased 10% to ₹1,015 Cr EPS: ₹169.54 | EBITDA Margin: 24.2% | Net Margin: 9.51% Return on Equity: 23.8% | Return on Assets: 12.7% Promoter holding: 68.73% | Dividend Yield: 1.38% New orders secured in industrial automation and high-efficiency motor vertical Capacity utilization improving across transformer and drives segments
Institutional Interest & Ownership Trends Promoter holding remains strong at 68.73%, with no dilution or pledging Recent quarters show consistent DII interest, particularly from infrastructure-focused mutual funds Delivery volume breakout confirms accumulation by mid-cap value portfolios HNI buying noted on trend continuation days aligned with breakout zones
Business Growth Verdict Yes, Bharat Bijlee is scaling gradually with deep infrastructure penetration and technical pedigree Margins improving through high-value products and services Balance sheet remains lean and de-risked with low debt levels Capex aligned with energy efficiency and industrial modernization trends
Company Guidance Management expects mid-teen revenue growth in FY26, driven by expansion in transformer orders, industrial automation, and OEM tie-ups Operating margins projected to sustain above 23% Strategic investments planned in digital controls and smart motor solutions
Final Investment Verdict Bharat Bijlee Ltd. represents a focused electrical capital goods play with consistent profitability, de-risked balance sheet, and high promoter alignment. Supported by trend continuation on monthly charts and volume strength near breakout zones, the stock is a candidate for staggered entry for investors seeking infrastructure-led manufacturing exposure with margin stability and institutional tailwinds.
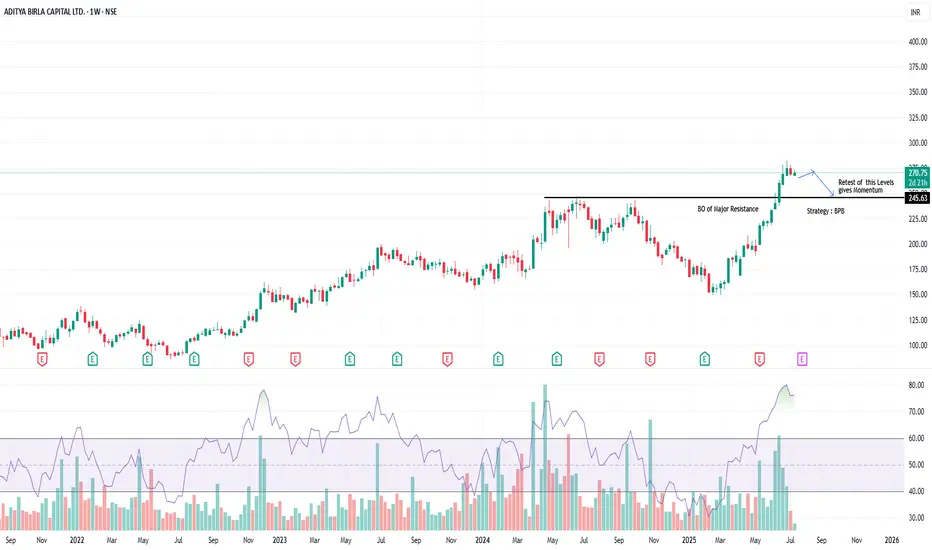
AB Capital – Clean Breakout of Multi-Year Resistance | BPB SetupTimeframe: Weekly | Strategy: Breakout–Pullback (BPB)
Technical Highlights:
========================
✅ BO (Breakout) of a major resistance zone around ₹250–₹255, which was acting as a multi-year supply zone.
📈 Strong bullish momentum seen with expanding volumes and wide-range candles.
🔄 BPB Strategy in Play: Price has broken out and now likely to retest the breakout zone.
🧠 Retest near ₹249–₹255 zone expected to provide fresh momentum.
📊 RSI confirms strength, currently above 70 – confirming a trending phase.
🔍 Key Zones:
===================
Breakout Level: ₹250 (Previous Resistance, now Support)
Immediate Resistance: ₹295–₹300
Target (Post BPB Confirmation): ₹330+
Support for Invalidating BPB: Weekly close below ₹245
📈 Trade Plan (for study purpose only):
=============================================
Wait for price to pull back into ₹250–₹255 zone.
Look for bullish candle confirmation on retest for entry.
SL: Below ₹245 | T1: ₹295 | T2: ₹330
⚠️ Disclaimer:
This idea is purely for educational purposes and does not constitute investment advice. Please consult your financial advisor before making any trading or investment decisions. Always do your own research and risk management.
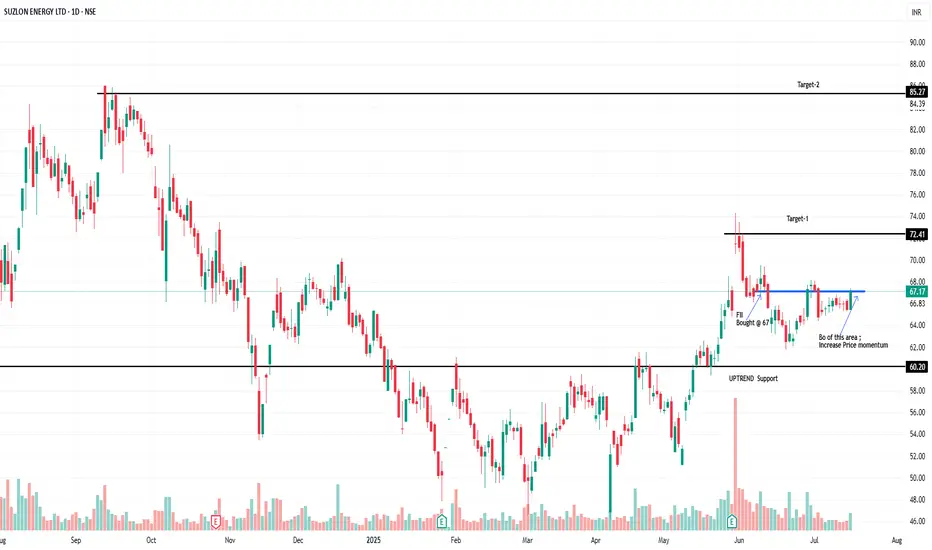
Suzlon Technical AnalysisPrice is currently at area where there was FII bought it earlier in June
-- Break out of current short-Term resistance can give lot of Momentum in price
-- BPB of current Resistance are can give Target-1 and thenTarget-2
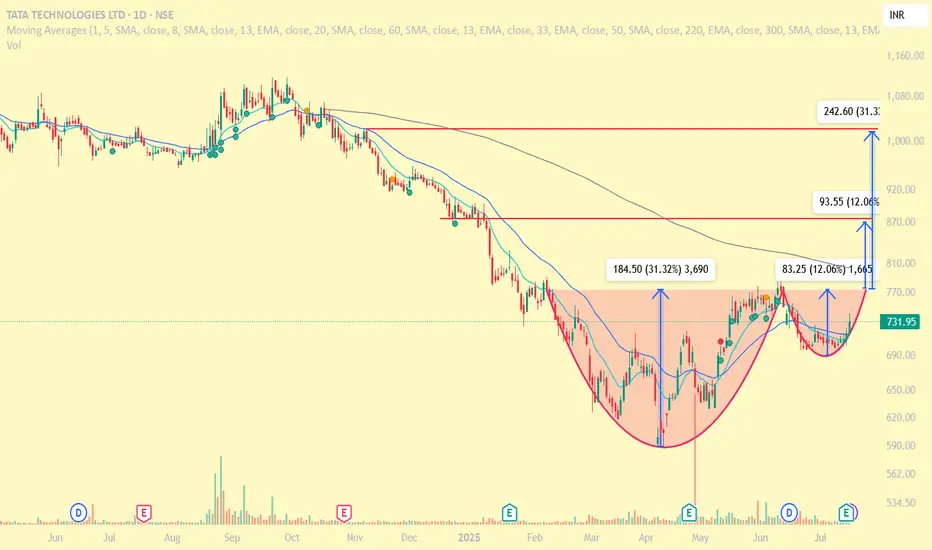
Tatatech: Formation of cup and handlethe chart shows the formation of cup and handle in progress. It may shoot the targets depending upon the market perception.
Moving average has only one principle, solve the problem, earn mMoving average has only one principle, solve the problem, earn money,
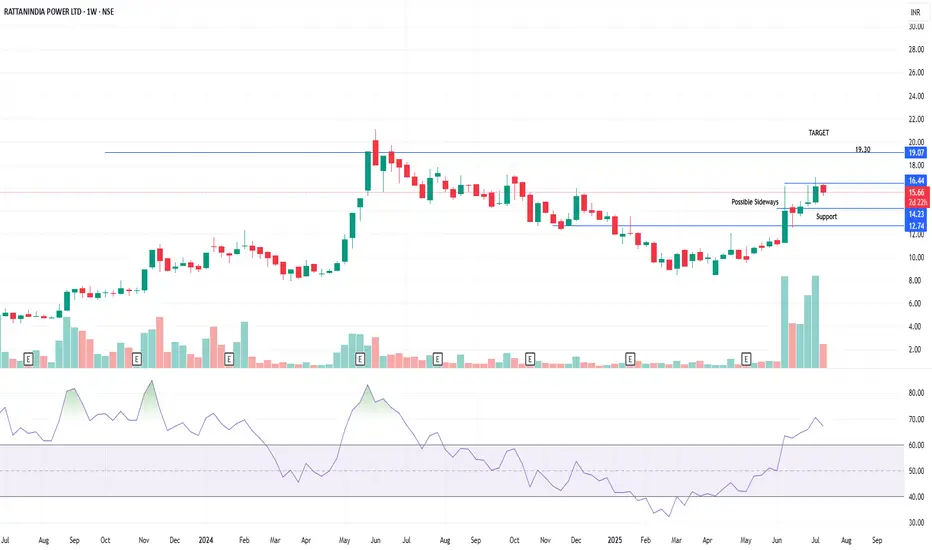
RattanIndia Power Ltd. – Breakout or Pause? A Technical & ShareTimeframe: Weekly | Idea Type: Technical + Smart Money Flow
🧠 Technical Analysis:
=============================================
📈 Stock is currently testing a key resistance zone around ₹16.44, after a strong uptrend.
📉 Possible sideways consolidation around ₹14.23–₹16.44 zone as shown on chart.
🧱 Support Levels:
₹14.23 (near-term support)
₹12.74 (base support zone)
🎯 Upside Target: ₹19.30 — if breakout sustains above ₹16.44 with strong volume.
📊 Volume Surge observed during recent rallies, suggesting accumulation.
💪 RSI above 70, signaling strength but also possible overbought conditions short-term.
💼 Shareholding Trend (as of June 2025):
=============================================
🏢 Promoter Holding stable at 44.06% (unchanged in 9 quarters).
🌍 FII/FPI holding increased from 0.31% (2023) to 4.95% (2025) — strong positive signal.
🏛️ DII holding steady around 6.63%.
📈 Non-Institutional holding has declined, suggesting smart money entry.
Conclusion:
================
“Smart money accumulation (FII/FPI rise), RSI breakout, and volume spike suggest a brewing breakout, but wait for confirmation above ₹16.44.”
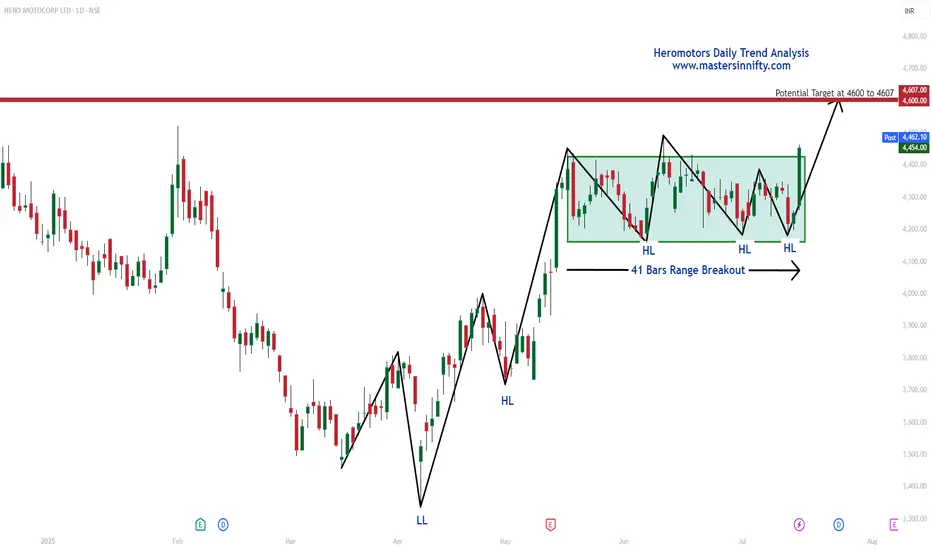
Heromotors Daily Trend Analysis"As per my Daily Trend Analysis, Heromotors Ltd has broken out of a 41-bar range and closed above it today. This breakout indicates a potential upward move toward the resistance zone of 4600 to 4607 in the coming sessions.
Traders are advised to perform their own technical analysis and ensure proper risk management before entering the trade."
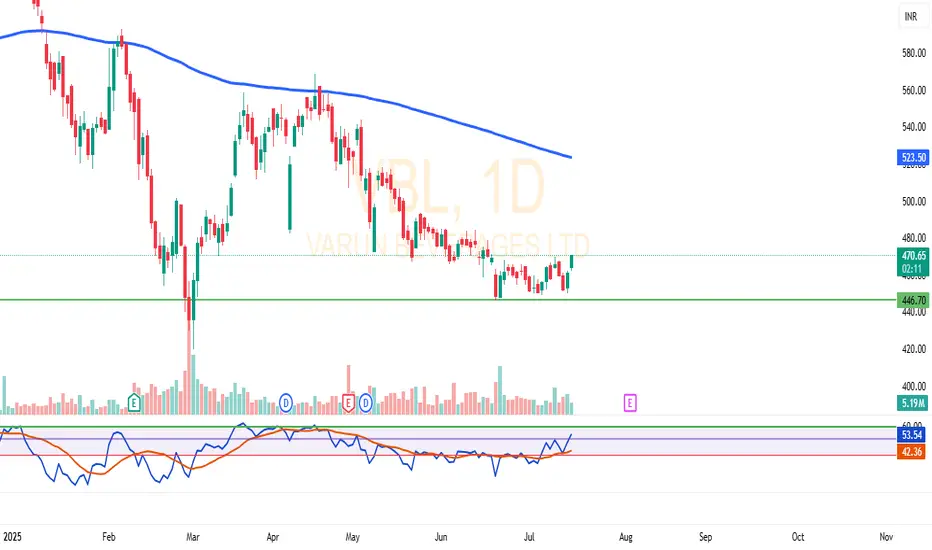
VBL Bounces from ₹446 Support – RSI Breakout with Volume SpikeVBL has shown multiple rebounds from the strong support zone around ₹446.
After several weeks of sideways consolidation, the stock is attempting a breakout with increased volume in the current session.
The RSI indicator has moved above the 50 level with a bullish crossover, indicating potential strength building up.
On the upside, the 200 EMA near ₹523 may act as a resistance level.
📊 This is a technical observation based on price structure, volume, and momentum — not a buy/sell recommendation.
The setup appears interesting for technical traders watching for a breakout from this range.
🔍 What’s your take on this pattern? Feel free to share your view in the comments.
Biocon: Heading for All-Time High?🚀 Biocon: Heading for All-Time High? 🚀
📉 CMP: ₹390
🔒 Stop Loss: ₹330
🎯 Targets: ₹428 | ₹478 | ₹560
🔍 Why Biocon Looks Promising?
✅ Weekly Rounding Bottom Breakout: Breakout triggered above ₹390
✅ Weekly Box Breakout: Confirmation above ₹398 strengthens the setup
✅ Final Confirmation: A weekly close above ₹402 will validate the breakout for a potential strong upside
💡 Strategy & Risk Management:
📈 Phased Entry: Build positions gradually post confirmation to manage risk effectively
🔒 Strict SL: Maintain stop loss at ₹330 to protect capital in case of reversal
📍 Outlook: Biocon is showing strong technical signals with an all-time high on the radar, making it a compelling positional trade setup.
📉 Disclaimer: Not SEBI-registered. Please do your own research or consult a financial advisor before investing.
#Biocon #PharmaStocks #TechnicalBreakout #AllTimeHigh #SwingTrading #StockMarket #InvestmentOpportunities

PAYTM - 3 WHITE SOLDIERSNo. of Candles: 3
Trend Context: Appears after a downtrend or consolidation (best)
Body Size: Long real bodies (bullish)
Wicks: Small or nonexistent lower wick
Volumes: > avg of 10 days
My criteria for spotting 3 white soldiers -
Each candle needs to opens within or slightly below the previous candle’s body and closes higher than the previous candle.
The candles also have a small or no lower shadow, indicating consistent buying pressure.
High on volumes
