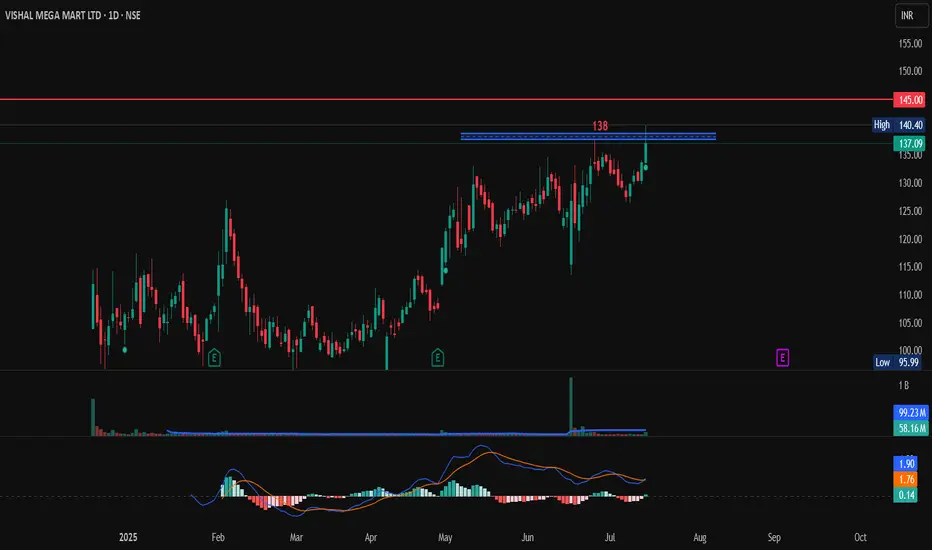
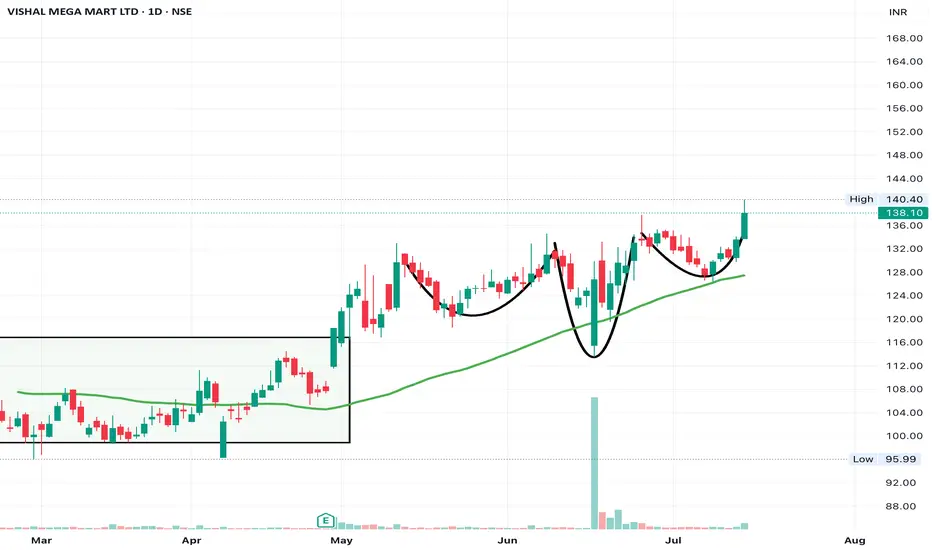
Vishal Mega Mart Long TradeVishal Mega Mart has broken it all time high of 137, but it was unable to sustain it close just below it. If is breaks the 138 mark it can easily to till 145 in next 10 sessions (2 weeks).
Enter above 138 on bullish candle pattern.
Target 145
SL 135
GAIL at Best Support zone !! There are two chart of Gail on Daily timeframe.
On the first chart Gail is moving in well defined parallel channel with support near at 178-180 zone.
Daily RSI is also taking support and bouncing back, indicating a revival in short-term momentum and strengthening the overall bullish setup.
On the second chart , the stock is bouncing from the supertrend support around ₹180, reinforcing bullish sentiment. However, on the shorter timeframe, the supertrend indicator is acting as resistance near ₹192, which needs to be breached for further upside continuation.
Thank You !!

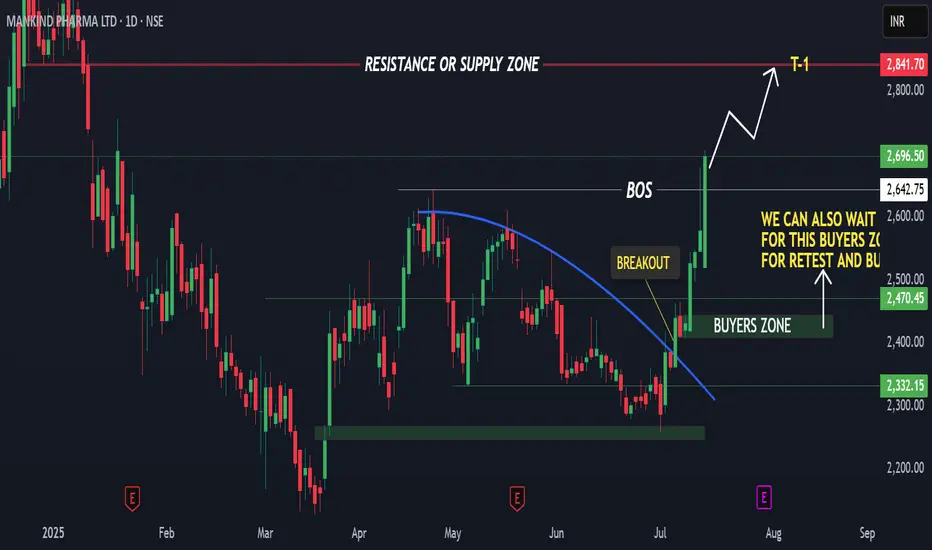
MANKIND PHARMA - For swing Trade1. In monthly time frame price is looking very bullish.
2. In weekly time frame price has given a breakout of double bottom pattern which is also showing bullish sign. And also from last 4 weeks price is making a good bullish move upside.
3. In daily time frame price has given a curve line breakout and make a good bullish move upside today.
4. Current price is 2696
2642 was the breakout level and also a break of structure(BOS)
5. Next Target can be 2840 to 2940
NOTE -
2445 to 2410 is the Bullish reversal zone.
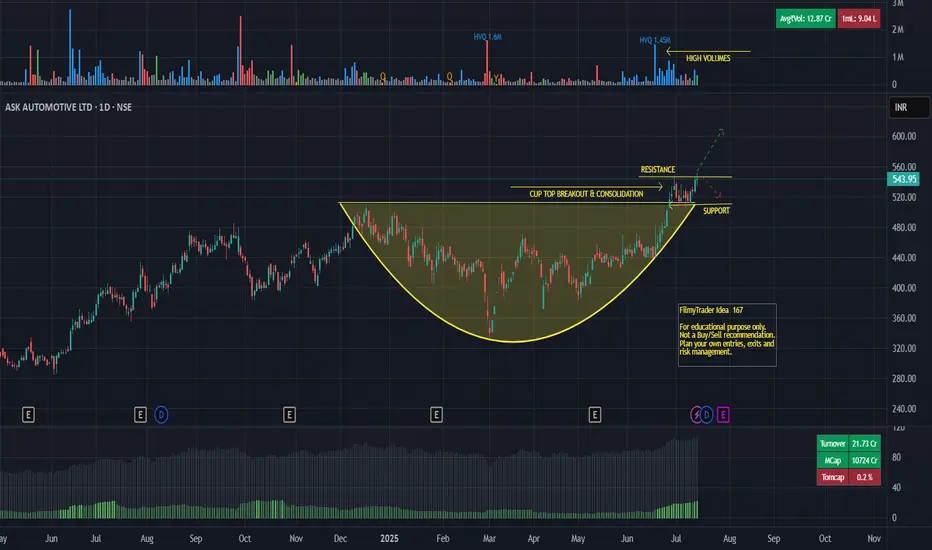
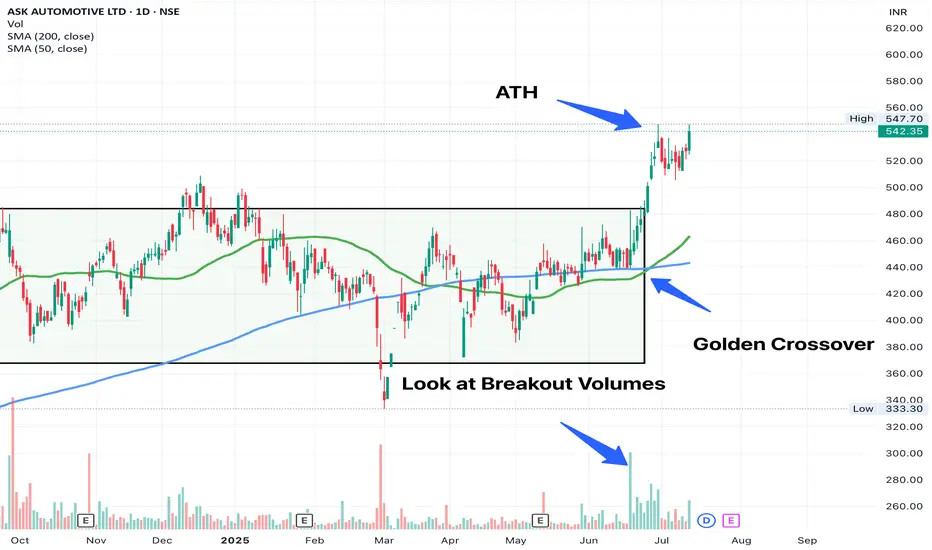
Ask Automative - Cup Pattern BreakoutAsk Automative Ltd.
CUP pattern breakout on daily timeframe.
PSAR indicating bullish trend.
High Volume & Delivery.
Stock's RSI entered above 70.
Disclaimer:
For educational purpose only.
Please do your own research before taking any trades.
Happy Trading!
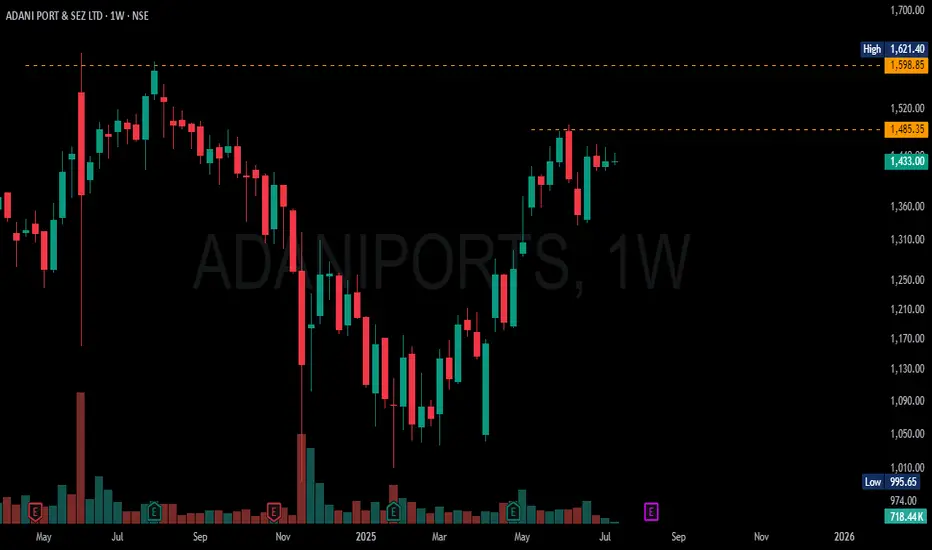
ADANIPORTS READY TO GOADANIPORTS is almost ready to break its nearest high and there after in the making of new high, as the volume feature shows investors are holding tight no sellers left, so there is short supply.
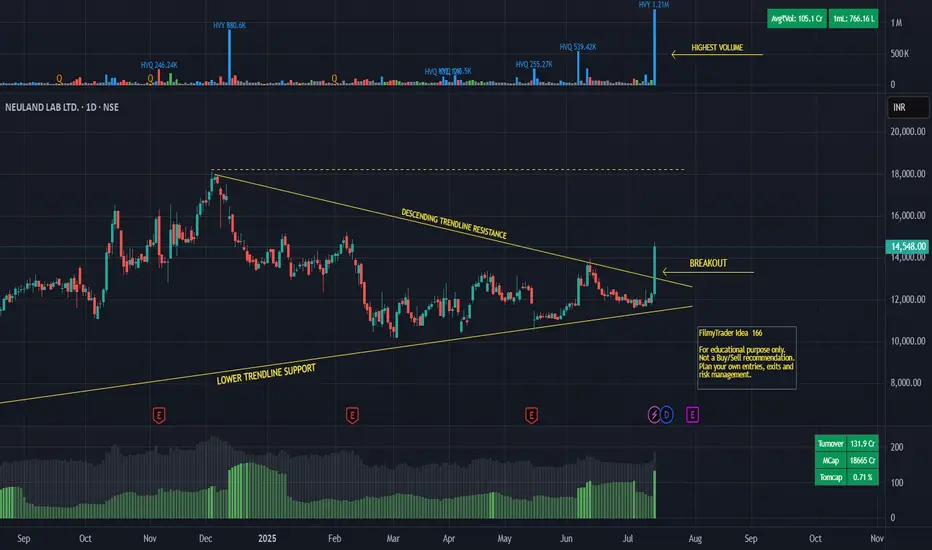
Neuland Lab - Trendline BreakoutNEULAND LABORATORIES LTD.
Breakout from trendline resistance on daily timeframe.
Breakout with heavy volume.
Close crossing last week high.
Increasing relative strength.
Disclaimer:
For educational purpose only.
Please do your own research before taking any trades.
Happy Trading!
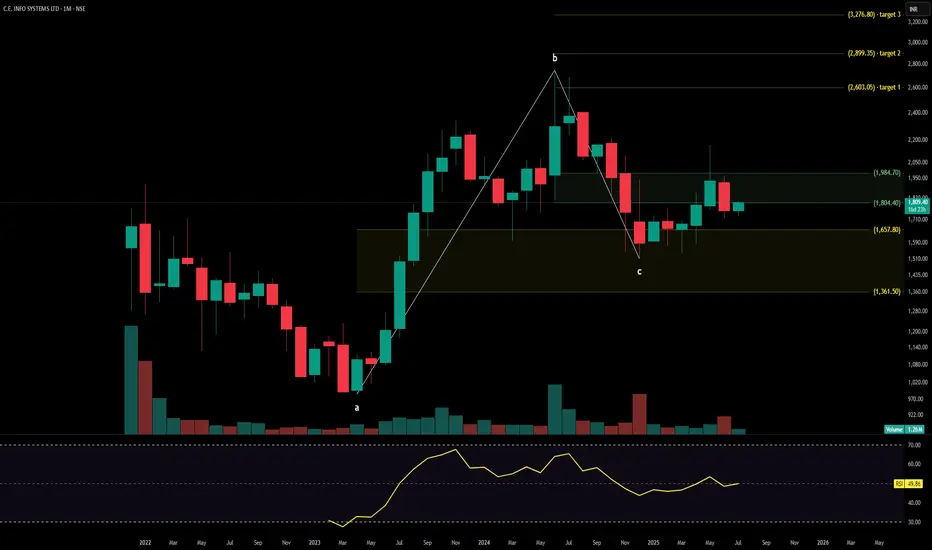
MAP MY INDIAC.E. Info Systems Ltd., operating under the brand MapmyIndia, is a leading geospatial SaaS and digital mapping company offering AI-powered mobility platforms, navigation tools, and automotive-grade telematics solutions. It serves marquee clients in automotive, logistics, government, and e-commerce verticals. The stock is currently trading at ₹1,804.40 and is forming a base post-correction, with early signs of trend reemergence supported by volume and Fibonacci alignment.
C.E. Info Systems Ltd. – FY22–FY25 Snapshot Sales – ₹215 Cr → ₹264 Cr → ₹314 Cr → ₹360 Cr – Consistent growth driven by SaaS subscriptions and automotive partnerships Net Profit – ₹89.3 Cr → ₹103.5 Cr → ₹116.2 Cr → ₹129.4 Cr – Steady margin profile with scalable revenue mix Company Order Book – Moderate → Strong → Strong → Strong – Expanding pipeline in mobility platforms and GIS services Dividend Yield (%) – 0.00% → 0.00% → 0.00% → 0.00% – No payouts, focused on reinvestment Operating Performance – Moderate → Strong → Strong → Strong – SaaS leverage driving operating margins Equity Capital – ₹10.71 Cr (constant) – Lean and efficient capital structure Total Debt – ₹0 Cr (debt-free) – Conservative balance sheet Total Liabilities – ₹185 Cr → ₹192 Cr → ₹204 Cr → ₹217 Cr – Stable, aligned with business scale Fixed Assets – ₹62 Cr → ₹68 Cr → ₹72 Cr → ₹78 Cr – Light capex structure supporting software stack
Latest Highlights FY25 net profit rose 11.4% YoY to ₹129.4 Cr; revenue increased 14.6% to ₹360 Cr EPS: ₹12.08 | EBITDA Margin: 31.2% | Net Margin: 35.94% Return on Equity: 25.28% | Return on Assets: 19.67% Promoter holding: 53.78% | Dividend Yield: 0.00% New deployments in EV navigation, autonomous mapping, and smart city platforms OEM integrations with leading automotive brands extending platform reach
Institutional Interest & Ownership Trends Promoter holding remains healthy at 53.78%, with no dilution or pledging. Recent quarterly filings show marginal uptick in FII interest, while mutual fund holdings remained steady. Delivery volume trends suggest accumulation by small-cap institutional trackers and thematic tech-focused portfolios.
Business Growth Verdict Yes, C.E. Info Systems is scaling sustainably with differentiated geospatial offerings Margins remain robust across product lines Zero debt and high ROE underscore financial discipline Asset-light model supports scalable growth with minimal capex needs
Company Guidance Management expects continued double-digit revenue growth in FY26, driven by expansion in automotive-grade maps, IoT platforms, and SaaS contracts. Profit margins are projected to stay above 30%.
Final Investment Verdict C.E. Info Systems Ltd. offers a unique play in India’s emerging deep-tech and mobility infrastructure ecosystem. With strong profitability metrics, zero debt, and expanding adoption across automotive and government platforms, the company is positioned for long-term value creation. Despite modest topline scale, its consistent margin profile and differentiated IP stack make it suitable for staggered accumulation by investors seeking niche tech exposure with high capital efficiency.
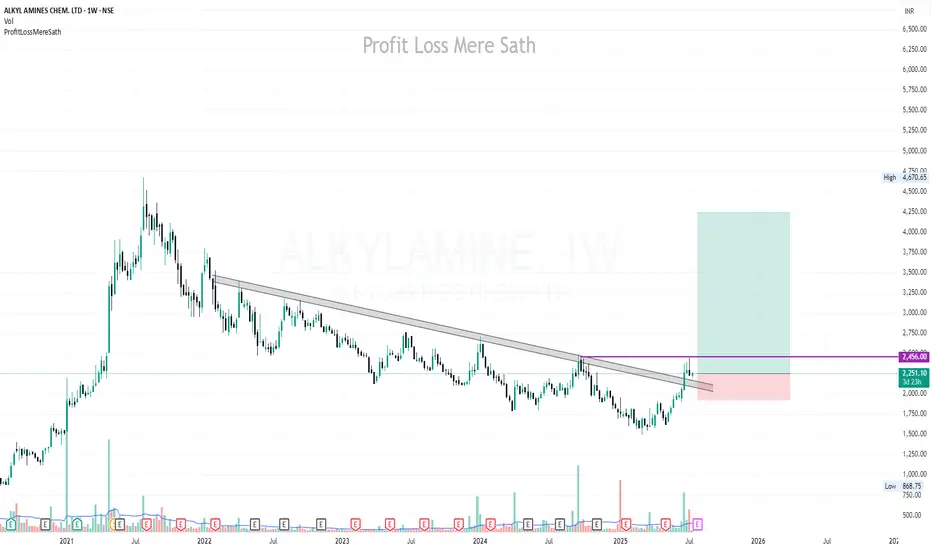
ALKYLAMINE | Buy @LTP | SL below 1900 | Targets 2700, 3440, 4250Disclaimer:
This is not financial advice. Please do your own research or consult with a financial advisor before making any investment decisions. Investments in stocks can be risky and may result in loss of capital.
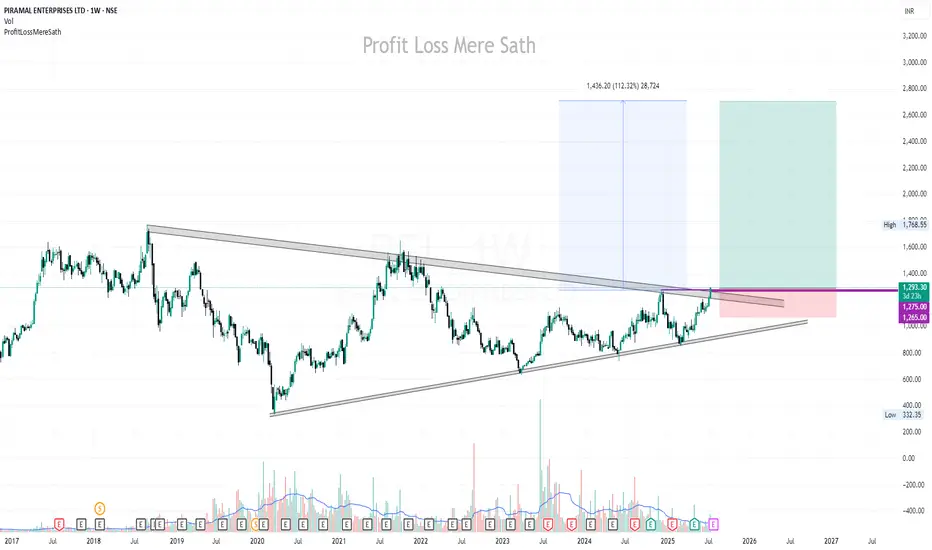
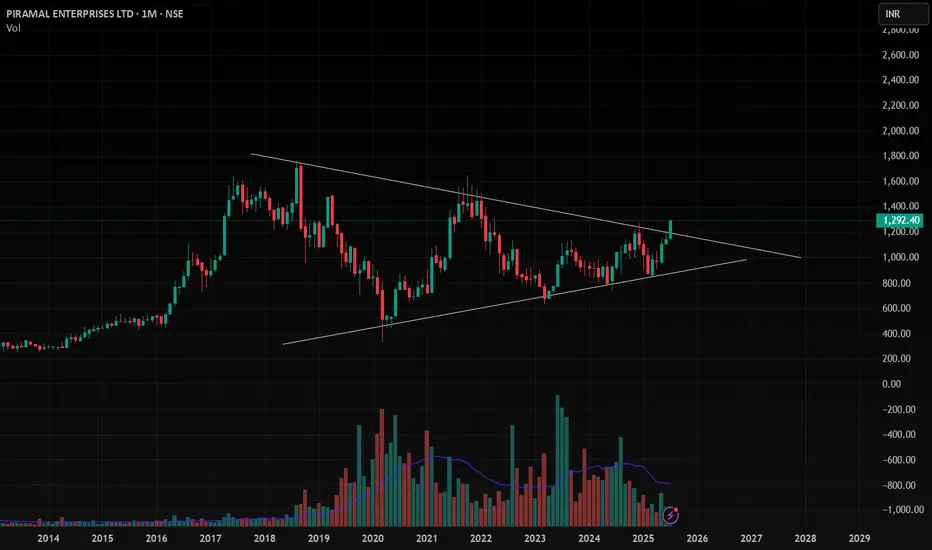
PEL | Buy @LTP | SL below 1070 | Targets 1560, 1765, 2700Disclaimer:
This is not financial advice. Please do your own research or consult with a financial advisor before making any investment decisions. Investments in stocks can be risky and may result in loss of capital.
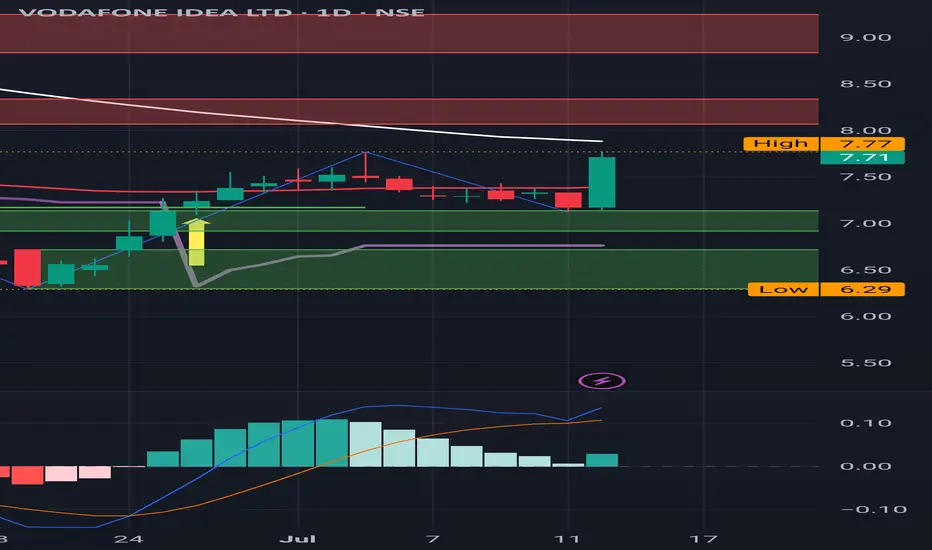
IDEA : Watch out for the Red Band resistances IDEA : Watch out for the Red Band resistances
( Not a Buy / Sell Recommendation
Do your own due diligence ,Market is subject to risks, This is my own view and for learning only .)
SAILIFE - IPO base breakoutTighter the consolidations, better the breakout.
A solid base has formed. Moving with the index, sector tailwinds in play

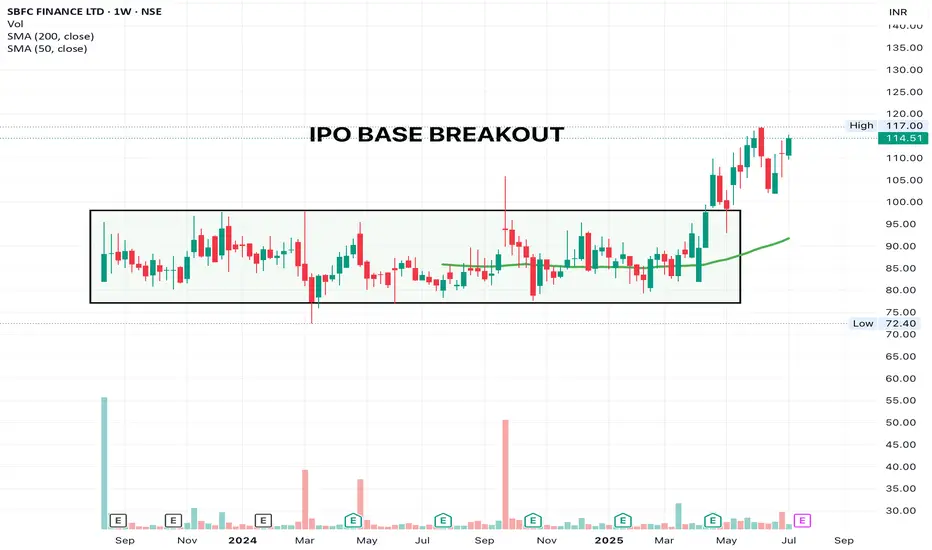
SBFC - RESISTING TO FALLStructures like this deserve a place in every portfolio. Buyers are ready to pounce on any shares available. This is why having sector tailwinds is so important.
SL - 101
NYKAA - Cup and HandleGood candle today, valid entry for a swing trade. The volume candle on earnings day is hiding the high volume candles printed in the last week. Keep today's low as SL

LTFOODS - Golden Crossover Golden Crossover and a new ATH. Simple things can make you money. You don't need fancy indicators for it. Most will ignore a simple template, but those who see the beauty will mint.
SL: 441 (Low of Breakout Candle)

ASKAUTOLTD - Strong Technicals + Strong Fundamentals Should be a long term play, looks strong from the medium term. Beautiful Chart. MCap less than 10K Cr, poised for growth, strong fundamentals, strong technicals.
How to build Positions - Gradual scale in is your answer. Do not put in money blindly at open, good thinks take time to build and so should your portfolio.
SL - 480 (roughly 11% away, slow accumulation should help get your average price less than 7% away from this SL)
VMM - Inverse Head and Shoulder Not all charts are perfect, but in my experience, shorter the contraction duration, higher the momentum. Lets see this in action on this trade!
Breakout has happened, would love to get a close near the day high.
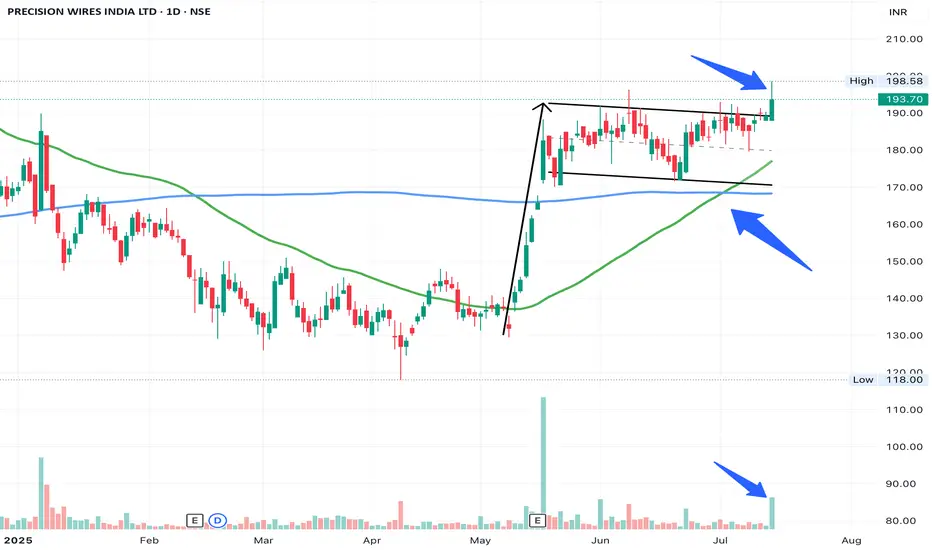
PRECWIRE - Flag and Pole BreakoutFlag and Pole Breakout (needs to sustain till EOD to confirm)
Great Relative Strength and Good volumes.
SL - 170 (partial exit can be done at 180)
Long above 13960Nonstop move after the breakout of 10,350, stock is moving in a upward channel respecting upper and lower bend as resistance and support, out of 3 past sessions, stock formed 2 weak candles, today's low at 13,620 can act as immediate support (Not marked), below that stock may find next support at 13,285, 12,720 and zone at 12,010 - 12,210 can be the good support to hold the price from further fall, above 13,960 stock may chase for 14,775, 15,385 and 15,920. (On a weekly TF stock looks quite week so far.) CMP: 13,705

Shriram financeShowing bullish signal.
But there is resistance after 8 to 9%
So define your SL before leap into it.
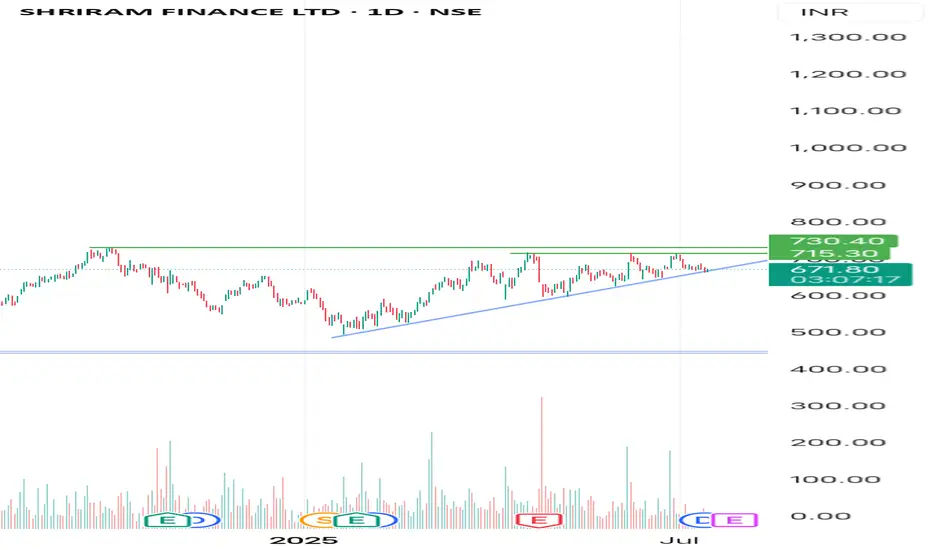

LongThis stock has broken its resistance level and trending with good volumes. We can take a swing trade in this stock with an SL of 6% and with target of 30%. Our profit and loss ratio is 1:5.
Points to remember:
* Take trade at current CMP.
* SL at point 1065.
* Target at point 1480.
PEL , 1M , BullishThe Triangle Pattern is Breaking Out in Monthly Time Wait for Strong and Perfect close in Weekly Time and Enter after Confirmation .
Take Risk According to your capital
Follow for more ideas like this
#DIXON - 4000 Pts move coming? 18246 or 9842.00?Date: 24-05-2025
#Dixon
Current Price: 14473
Pivot Point: 14044.00 Support: 13213.60 Resistance: 14882.04
Upside Targets:
Target 1: 15991.02
Target 2: 17100.00
Target 3: 18246.00
Target 4: 19392.00
Downside Targets:
Target 1: 12100.80
Target 2: 10988.00
Target 3: 9842.00
Target 4: 8696.00
