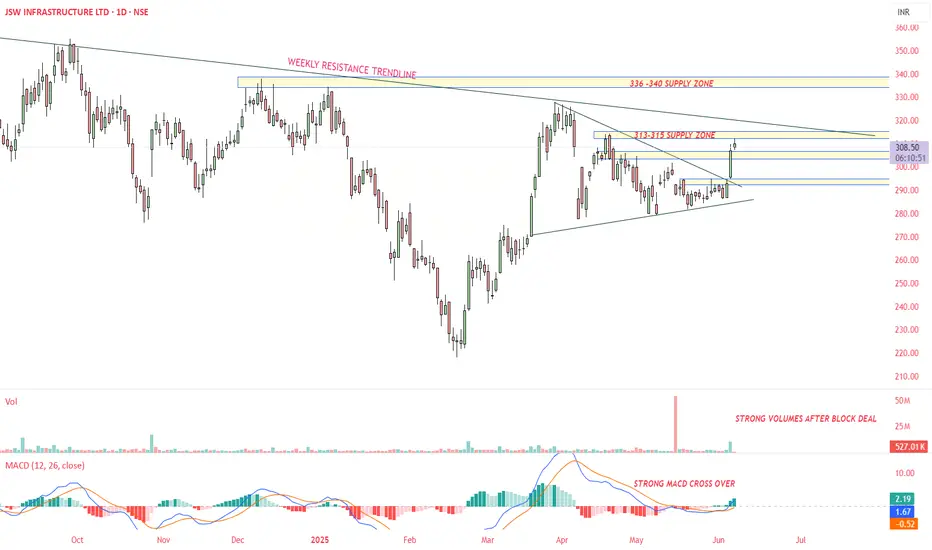
JSWINFRA - Daily time frame StudyFollowing are my Inputs for above chart reading -
1. MACD cross over
2. High volume Breakout of Symmetrical Triangle Pattern - Daily Time frame
3. It may go till weekly resistance line 330-340
This chart is only for educational purpose, Please contact your financial advisor for any trading or investment decisions.
NAVINFLOUR BROKEN ATHNavin flour has broken ATH and looks like a rounding bottom
with very minimum risk with stop of close below 4800 one can go long with target of 6800


SAMBHAV STEEL TUBESSAMBHAV STEEL TUBES, WEEKEND TRADE looks good it can give you decent profit in couple of week.

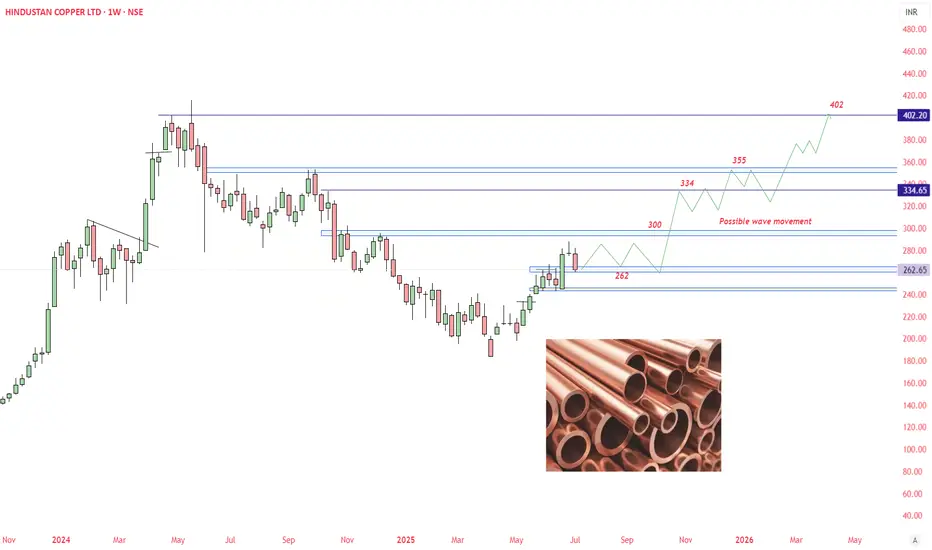
HINDUSTAN COPPER - A bullish viewLooking at copper demand in upcoming years, Bullish view are created for Hindustan copper. I have marked a wave movement that may happen during coming years.
This chart is only educational purpose. Do your own study before taking any trade or financial decisions.
Capri Global📈 Trade Plan
Action: ✅ BUY
Entry Point: ₹136
Stop Loss (SL): ₹119
Target (TGT): ₹437
Risk: ₹17
Reward: ₹301
Risk-Reward Ratio (RRR): 🔥 17.7 — Excellent
📊 Key Levels
Parameter Value
Last High ₹289
Last Low ₹141
Point Variation ₹148
🔍 Interpretation & Strategy
All trends align UP, showing strong bullishness across timeframes.
Demand zones are tightly packed (119–136) → Indicates strong institutional buying base.
Entry at demand base gives excellent RRR.
Target of ₹437 may seem far, but is structurally feasible if broader market supports and breakout holds post ₹289 (previous high).
SL at ₹119 protects capital well below the demand zone.
✅ Recommendation
A textbook HTF Demand Zone Buy Setup.
Can consider partial booking near previous high (₹289) and trail the rest toward final target.
Ensure to review volume confirmation at demand zone before entering.
🧾 Multi-Timeframe (MTF) Analysis Summary
Overall Trend: 🔼 Strong UPTREND across all timeframes
Demand Zone: Consistent at 136 (Proximal) to 119 (Distal) across HTF, MTF, and ITF
Logic Used:
HTF: Rally-Rally / Rally-Base-Rally
MTF & ITF: BUFL / DMIP (signs of strong continuation demand)

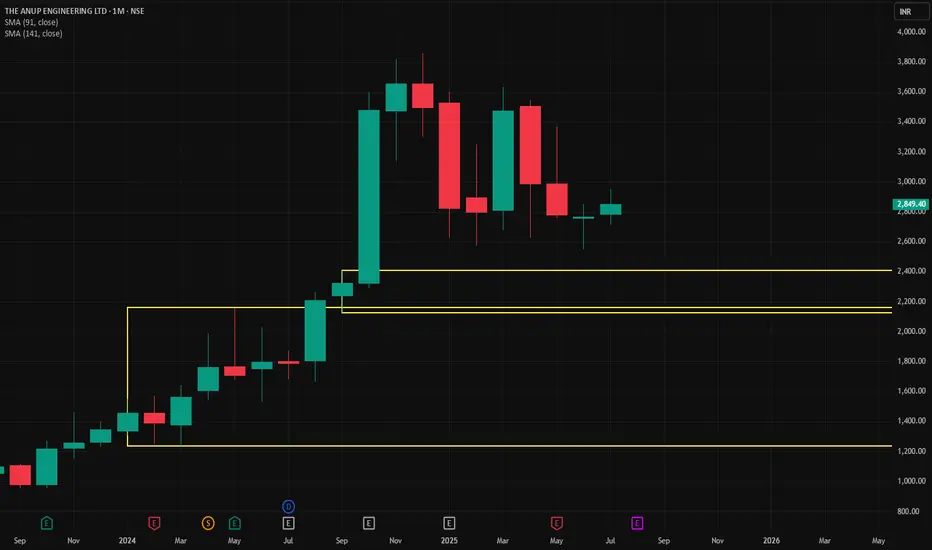
Anup Engg📈 Trade Plan:
Entry-1: ₹2408
Stop Loss: ₹2308
Risk: ₹100
Reward: ₹3017
Target: ₹5425
Risk:Reward (RR): 30.2 — extremely favorable if it plays out
Last High: ₹3859
Last Low: ₹2293
Point Variance: 1566
✅ Interpretation & Insights:
Trend Confirmation Across All Timeframes:
Every timeframe from yearly down to intraday (60M) shows an uptrend, indicating strong bullish momentum and confirmation across multiple investor classes.
Demand Zone Clustering:
The demand cluster around 2288–2408 is repeated across MTF & ITF zones. This tight range is a strong accumulation zone.
You are entering right at the upper edge of the demand, which is okay, but better RR existed slightly lower.
Trade Setup:
Entry: ₹2408 is aligned with the weekly/monthly proximal zone.
SL: ₹2308 is just below the demand zone, which is valid technically.
Target: ₹5425 seems based on projection logic (perhaps supply zone or fib extensions). It’s aggressive, but technically aligned with the broader HTF trend.
Risk-Reward:
RR of 30.2 is theoretically excellent, but practically it suggests your SL is very tight compared to the move expected. Monitor volatility closely.
🧠 Strategic Suggestions:
If price consolidates above ₹2408 and shows strength, consider pyramiding.
Watch for daily close above ₹2408 to confirm institutional interest.
Trail SL aggressively once above ₹3000 to protect profit.
🔍 Multi-Timeframe (MTF) Trend Summary:
Timeframe Trend Demand Zone (Proximal–Distal) Avg
Yearly UP 1459 – 1236 1348
Half-Yearly UP 2160 – 1665 1913
Quarterly UP 2160 – 1665 1913
HTF Avg UP 1926 – 1522 1724
| Monthly | UP | 2408 – 2125 | 2267 |
| Weekly | UP | 2408 – 2125 | 2267 |
| Daily | UP | 2395 – 2288 | 2342 |
| MTF Avg | UP | 2404 – 2179 | 2292 |
| 240M | UP | 2395 – 2288 | 2342 |
| 180M | UP | 2395 – 2288 | 2342 |
| 60M | UP | 2337 – 2308 | 2323 |
| ITF Avg | UP | 2376 – 2295 | 2335 |
Cartrade Tech LtdCarTrade Tech Ltd is a multi-channel auto platform provider company with coverage and presence across vehicle types and Value Added Services. The company operates various brands such as CarWale, CarTrade, Shriram Automall, BikeWale, CarTradeExchange, Adroit Auto, and AutoBiz. The platform connects new and used automobile customers, vehicle dealers, vehicle OEMs, and other businesses to buy and sell different types of vehicles. The company offers a variety of solutions across automotive transactions for buying, selling, marketing, financing, and other activities.
Market Cap
₹ 9,022 Cr.
Current Price
₹ 1,900
Stock P/E
67.2
Book Value
₹ 468
Dividend Yield
0.00 %
ROCE
7.60 %
ROE
6.26 %
Face Value
₹ 10.0
Price to book value
4.06
Intrinsic Value
₹ 709
PEG Ratio
1.20
Price to Sales
14.1
Debt
₹ 131 Cr.

Glenmark Pharma – Historic 16-Year Cup & Handle Breakout!Glenmark has completed a massive Cup and Handle pattern after nearly 16 years, breaking past its 2008 all-time high with a powerful volume spike. This is a textbook long-term breakout, potentially signaling the start of a major multi-year bullish trend in the pharma sector.

PARAS DEFENSE📈 Trade Setup
Parameter Value
Buy Entry ₹738
Stop Loss (SL) ₹670
Target ₹1,194
Risk ₹68
Reward ₹456
Risk:Reward 6.7 : 1
Last High: ₹797 — Once broken, can trigger fresh momentum.
Last Low: ₹400 — Previous strong base.
⚠️ Key Observations
Strong Weekly & Daily Demand just below current price (678–738) supports the buy zone.
Entry near BUFL zone → suggests breakout continuation.
High reward-to-risk ratio (6.7x) → Attractive setup.
If ₹797 (previous high) breaks with volume, the rally may accelerate toward ₹1,000+.
📌 Strategy
Entry: On price stability above ₹738 or on intraday retest with confirmation.
SL Discipline: Maintain tight SL at ₹670 (just below multiple demand zones).
Partial Booking: Consider at ₹900–950 before full target if volatility spikes.
🔍 Trend Overview
Timeframe Trend Demand Zone Avg Price
HTF (Yearly–Quarterly) UP 302–587 407
MTF (Daily–Monthly) UP 404–738 620
ITF (60M–240M) UP 670–698 686

L&T Finance – Cup & Handle Breakout After 8 Years!L&T Finance has finally broken out of a classic Cup and Handle pattern, reclaiming its 2017 all-time high after nearly 8 years of consolidation. Strong volume confirmation adds weight to this long-term bullish breakout. A must-watch for positional traders and investors looking for momentum in the NBFC space!

Pondy Oxide, Kindly do your own studyThis stock is in momentum in weekly time frame.
Monthly time frame- stock has completed 4 wave structure and looks like its in 5th wave.
Weekly-stock has challenged upper bollinger band
Weekly MACD -PCO stat
Weekly RSI is in momentum
Weekly ADX is strong
Daily price is in momentum and volume has increased

Piramal Intraday Play/ Long:Piramal Intraday Play/ Long:
- Bullish Engulfing Candle with very strong volume
- Price close to the 20 DEMA
- After many indecisive candles, price moves stronger
- Earnings in 15 days.
- Enter long when the price is favorable in lower time frame
- SL: close below 20 DEMA

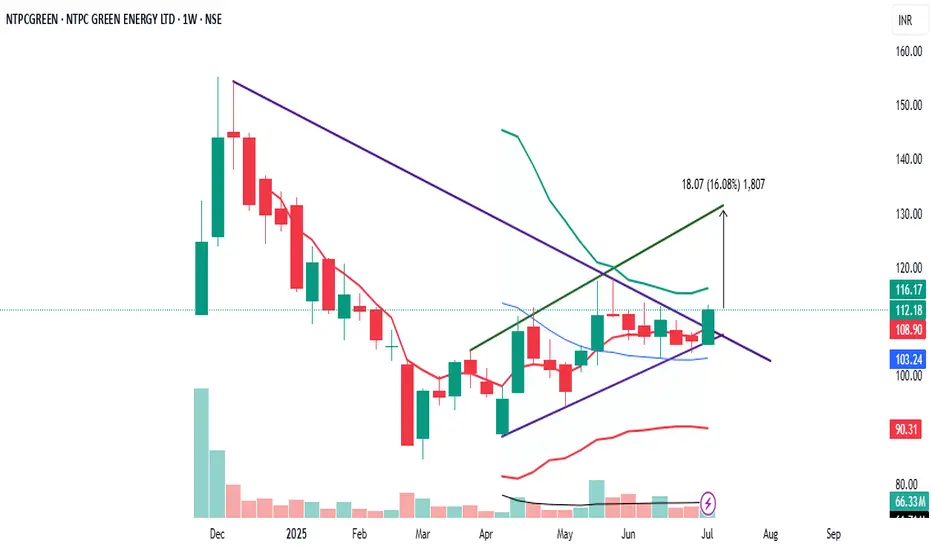
NTPC GREEN, Kindly do your own studyThis stock is resdy for next move.
Stock is moving in channel.
Daily time frame-stock has given breakout with high volume with upper bollinger band challenged.
Daily macd turned PCO
Daily RSI is in momentum.
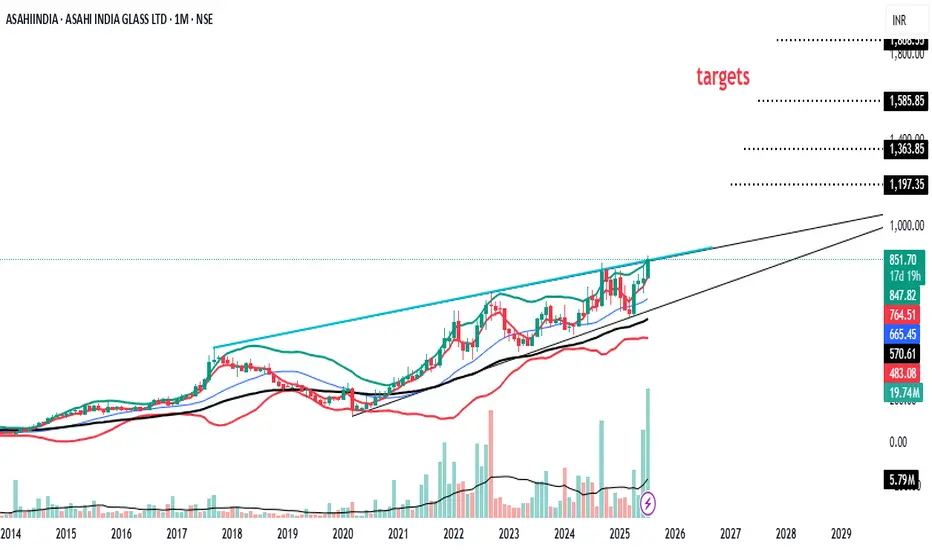
Asahiindia, Kindly do your own studyThis stock has given all time high breakout.
Monthly MACD turn positive
Monthly, weekly and Daily time frame are in momentum
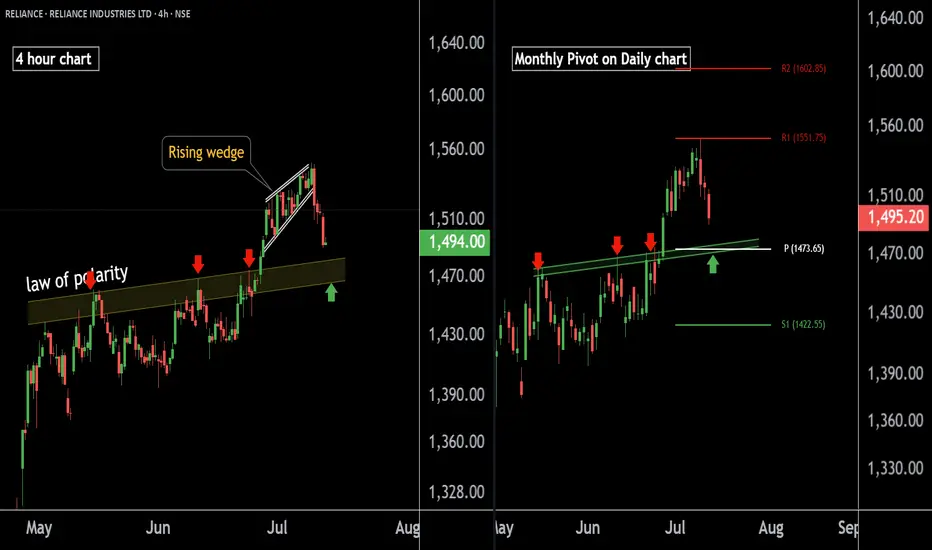
RELIANCE INDUSTRIES at Best Support !! Keep It On Your Radar !!There are two chart of RELIANCE INDUSTRIES on Daily and 4 hour Timeframe.
On the 4-hour timeframe, Reliance is likely to respect its LOP (Line of Polarity) as support, with the support range near 1460-1475.
On the Daily timeframe, the monthly pivot is also positioned around 1473, reinforcing this level as a potential halt or reversal zone.
If this level is sustain we may see higher prices in RELIANCE INDUSTRIES.
Thank You !!!
SUNDARAM FINANCE Near at Support Zone | Keep an eye on it ||There are two charts of Sundaram Finance —on the Weekly timeframe and Daily timeframe.
On the weekly timeframe, the stock is moving within an ascending parallel channel, with the support zone between 4650-4550.
On the daily timeframe, the stock is moving within a descending channel, with the support boundary near 4600-4650.
If this level is sustain then we may see higher prices in SUNDARMFIN
Thank You...

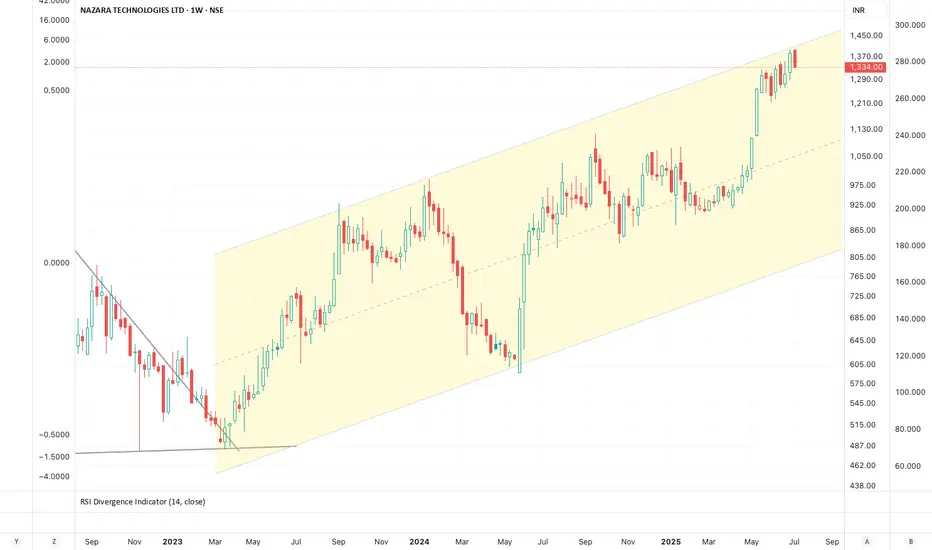
Nazara: na zaraNazara
PER 141
Rising Channel
Insiders selling
Volumes falling
Momentum Indicators overbought
Target
3 figures !!
Review and plan for 14th July 2025 Nifty future and banknifty future analysis and intraday plan.
Results - analysed.
This video is for information/education purpose only. you are 100% responsible for any actions you take by reading/viewing this post.
please consult your financial advisor before taking any action.
----Vinaykumar hiremath, CMT

Titan at Best Support Zone !! This is the 4 hour chart of Titan Company.
Titan having a good support zone near 3400-3460 level.
If this level is sustain , then we may see higher prices in Titan company.
Thank You !!
