HINDUNILVR | Buy @LTP | SL below 2385 | Target 2755Disclaimer:
This is not financial advice. Please do your own research or consult with a financial advisor before making any investment decisions. Investments in stocks can be risky and may result in loss of capital.

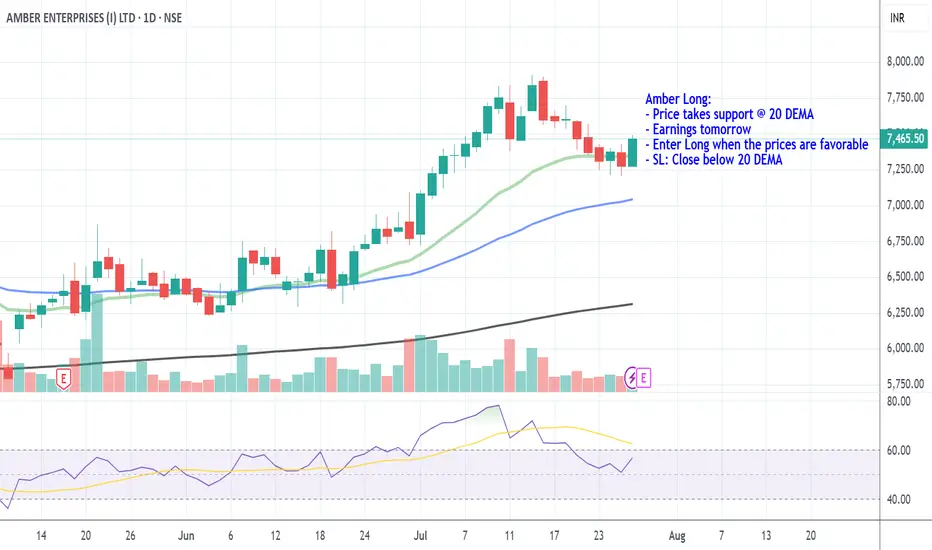
Amber Long_Support @ 20 DEMAAmber Long:
- Price takes support @ 20 DEMA
- Earnings tomorrow
- Enter Long when the prices are favorable
- SL: Close below 20 DEMA
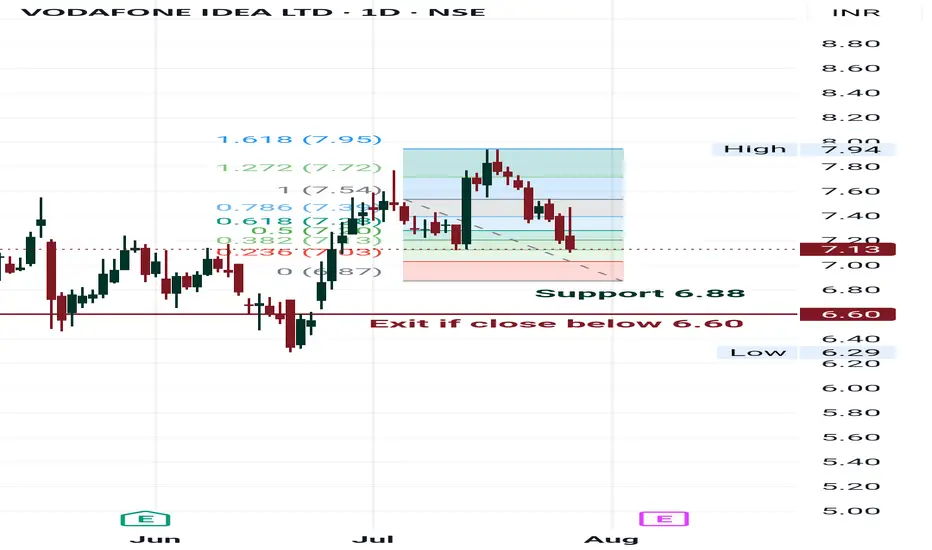
Idea buy at support Idea buy 6.88 , opposition calculation Fibonacci point.
Try to exit below 6.60 on close basis.

HINDUSTAN UNILEVERHindustan Unilever Ltd. is India’s leading fast-moving consumer goods (FMCG) company, with a portfolio spanning personal care, home care, foods, and beverages. Backed by strong brand equity, extensive distribution, and consistent innovation, the company maintains dominant market share across categories like soaps, shampoos, detergents, tea, and ice creams. The stock is currently trading at ₹2441.
Hindustan Unilever Ltd. – FY22–FY25 Snapshot
Sales – ₹52,446 Cr → ₹56,370 Cr → ₹59,625 Cr → ₹63,180 Cr – Steady topline growth driven by volume and premiumization
Net Profit – ₹9,846 Cr → ₹10,340 Cr → ₹10,790 Cr → ₹11,270 Cr – Margins stable across business lines with cost leverage
Order Book – Moderate → Moderate → Strong → Strong – Strong urban retail and rural penetration continuing Dividend Yield (%) – 1.43% → 1.48% → 1.52% → 1.57% – Consistent payouts reflecting robust free cash flows Operating Performance – Strong → Strong → Strong → Strong – Operational discipline and category leadership Equity Capital – ₹234.96 Cr (constant) – No dilution Total Debt – ₹0 Cr (debt-free) – Fully equity-funded operations
Total Liabilities – ₹12,740 Cr → ₹13,180 Cr → ₹13,560 Cr → ₹13,970 Cr – Stable and aligned with scale
Fixed Assets – ₹3,985 Cr → ₹4,100 Cr → ₹4,240 Cr → ₹4,390 Cr – Modest capex focused on automation and digitization
Latest Highlights FY25 net profit rose 4.4% YoY to ₹11,270 Cr; revenue grew 5.9% to ₹63,180 Cr EPS: ₹48.00 | EBITDA Margin: 24.2% | Net Margin: 17.83% Return on Equity: 22.44% | Return on Assets: 17.15% Promoter holding: 61.90% | Dividend Yield: 1.57% Premium personal care and food innovations led category outperformance Expansion in digital-first channels and rural activation remained strong
Institutional Interest & Ownership Trends Promoter holding stands high at 61.90%, with no pledging or dilution. FIIs and DIIs maintain steady positions given HUL’s status as a portfolio staple. Mutual fund holdings are concentrated in consumption and defensives, and delivery data reflects sustained long-term holding.
Business Growth Verdict Yes, Hindustan Unilever continues to demonstrate category leadership and resilience Margins and cash flows are consistently strong with minimal volatility Debt-free operations underscore financial strength Capex remains targeted, driving process and product innovation
Company Guidance Management expects low-to-mid single-digit revenue growth in FY26, led by continued premiumization, cost optimization, and digital outreach initiatives.
Final Investment Verdict Hindustan Unilever Ltd. remains one of India’s most durable compounders in the FMCG sector. With iconic brands, robust financials, and operational excellence, the company continues to deliver steady returns for long-term investors. Its balance sheet strength, innovation-led strategy, and defensive positioning make it ideal for sustained accumulation in consumption-focused portfolios.

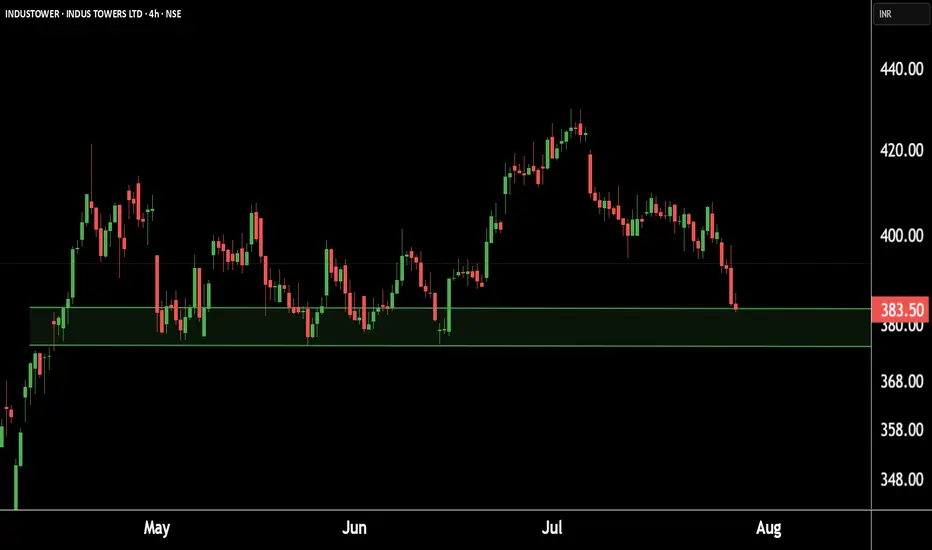
Indus Towers showing strength at key levels!Eyes on a potential.This is the 4 hour chart of INDUSTOWER.
INDUSTOWER having a good Support level near at 370-375.
if this level is sustain , then we may see higher prices in INDUSTOWER.
Thank You !!
SUDARSHAN CHEMICAL INDS LTD S/RSupport and Resistance Levels:
Support Levels: These are price points (green line/shade) where a downward trend may be halted due to a concentration of buying interest. Imagine them as a safety net where buyers step in, preventing further decline.
Resistance Levels: Conversely, resistance levels (red line/shade) are where upward trends might stall due to increased selling interest. They act like a ceiling where sellers come in to push prices down.
Breakouts:
Bullish Breakout: When the price moves above resistance, it often indicates strong buying interest and the potential for a continued uptrend. Traders may view this as a signal to buy or hold.
Bearish Breakout: When the price falls below support, it can signal strong selling interest and the potential for a continued downtrend. Traders might see this as a cue to sell or avoid buying.
MA Ribbon (EMA 20, EMA 50, EMA 100, EMA 200) :
Above EMA: If the stock price is above the EMA, it suggests a potential uptrend or bullish momentum.
Below EMA: If the stock price is below the EMA, it indicates a potential downtrend or bearish momentum.
Trendline: A trendline is a straight line drawn on a chart to represent the general direction of a data point set.
Uptrend Line: Drawn by connecting the lows in an upward trend. Indicates that the price is moving higher over time. Acts as a support level, where prices tend to bounce upward.
Downtrend Line: Drawn by connecting the highs in a downward trend. Indicates that the price is moving lower over time. It acts as a resistance level, where prices tend to drop.
Disclaimer:
I am not SEBI registered. The information provided here is for learning purposes only and should not be interpreted as financial advice. Consider the broader market context and consult with a qualified financial advisor before making investment decisions.

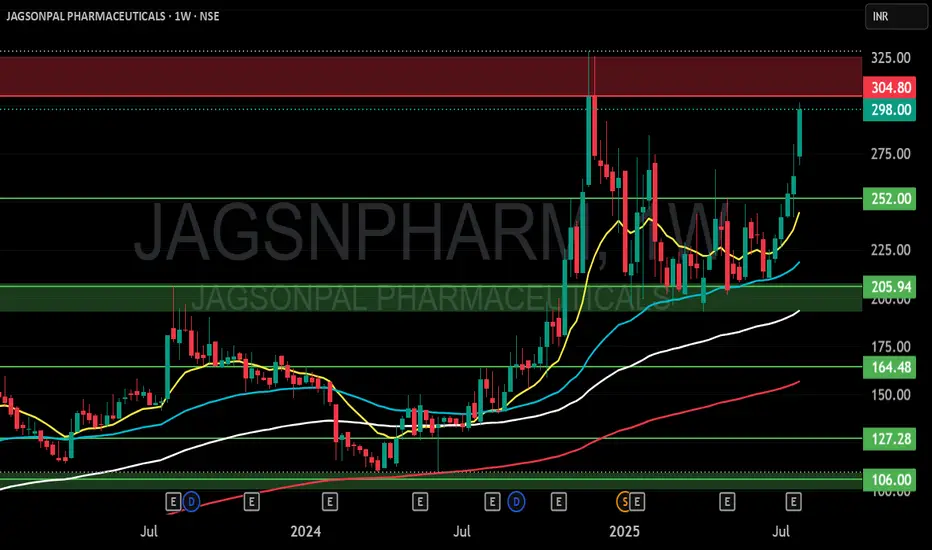
JAGSONPAL PHARMACEUTICALS S/RSupport and Resistance Levels:
Support Levels: These are price points (green line/shade) where a downward trend may be halted due to a concentration of buying interest. Imagine them as a safety net where buyers step in, preventing further decline.
Resistance Levels: Conversely, resistance levels (red line/shade) are where upward trends might stall due to increased selling interest. They act like a ceiling where sellers come in to push prices down.
Breakouts:
Bullish Breakout: When the price moves above resistance, it often indicates strong buying interest and the potential for a continued uptrend. Traders may view this as a signal to buy or hold.
Bearish Breakout: When the price falls below support, it can signal strong selling interest and the potential for a continued downtrend. Traders might see this as a cue to sell or avoid buying.
MA Ribbon (EMA 20, EMA 50, EMA 100, EMA 200) :
Above EMA: If the stock price is above the EMA, it suggests a potential uptrend or bullish momentum.
Below EMA: If the stock price is below the EMA, it indicates a potential downtrend or bearish momentum.
Trendline: A trendline is a straight line drawn on a chart to represent the general direction of a data point set.
Uptrend Line: Drawn by connecting the lows in an upward trend. Indicates that the price is moving higher over time. Acts as a support level, where prices tend to bounce upward.
Downtrend Line: Drawn by connecting the highs in a downward trend. Indicates that the price is moving lower over time. It acts as a resistance level, where prices tend to drop.
Disclaimer:
I am not SEBI registered. The information provided here is for learning purposes only and should not be interpreted as financial advice. Consider the broader market context and consult with a qualified financial advisor before making investment decisions.
AADHAR HOUSING FINANCE LTD Support and Resistance Levels:
Support Levels: These are price points (green line/shade) where a downward trend may be halted due to a concentration of buying interest. Imagine them as a safety net where buyers step in, preventing further decline.
Resistance Levels: Conversely, resistance levels (red line/shade) are where upward trends might stall due to increased selling interest. They act like a ceiling where sellers come in to push prices down.
Breakouts:
Bullish Breakout: When the price moves above resistance, it often indicates strong buying interest and the potential for a continued uptrend. Traders may view this as a signal to buy or hold.
Bearish Breakout: When the price falls below support, it can signal strong selling interest and the potential for a continued downtrend. Traders might see this as a cue to sell or avoid buying.
MA Ribbon (EMA 20, EMA 50, EMA 100, EMA 200) :
Above EMA: If the stock price is above the EMA, it suggests a potential uptrend or bullish momentum.
Below EMA: If the stock price is below the EMA, it indicates a potential downtrend or bearish momentum.
Trendline: A trendline is a straight line drawn on a chart to represent the general direction of a data point set.
Uptrend Line: Drawn by connecting the lows in an upward trend. Indicates that the price is moving higher over time. Acts as a support level, where prices tend to bounce upward.
Downtrend Line: Drawn by connecting the highs in a downward trend. Indicates that the price is moving lower over time. It acts as a resistance level, where prices tend to drop.
Disclaimer:
I am not SEBI registered. The information provided here is for learning purposes only and should not be interpreted as financial advice. Consider the broader market context and consult with a qualified financial advisor before making investment decisions.

ARVIND SMARTSPACES LTD S/RSupport and Resistance Levels:
Support Levels: These are price points (green line/shade) where a downward trend may be halted due to a concentration of buying interest. Imagine them as a safety net where buyers step in, preventing further decline.
Resistance Levels: Conversely, resistance levels (red line/shade) are where upward trends might stall due to increased selling interest. They act like a ceiling where sellers come in to push prices down.
Breakouts:
Bullish Breakout: When the price moves above resistance, it often indicates strong buying interest and the potential for a continued uptrend. Traders may view this as a signal to buy or hold.
Bearish Breakout: When the price falls below support, it can signal strong selling interest and the potential for a continued downtrend. Traders might see this as a cue to sell or avoid buying.
MA Ribbon (EMA 20, EMA 50, EMA 100, EMA 200) :
Above EMA: If the stock price is above the EMA, it suggests a potential uptrend or bullish momentum.
Below EMA: If the stock price is below the EMA, it indicates a potential downtrend or bearish momentum.
Trendline: A trendline is a straight line drawn on a chart to represent the general direction of a data point set.
Uptrend Line: Drawn by connecting the lows in an upward trend. Indicates that the price is moving higher over time. Acts as a support level, where prices tend to bounce upward.
Downtrend Line: Drawn by connecting the highs in a downward trend. Indicates that the price is moving lower over time. It acts as a resistance level, where prices tend to drop.
Disclaimer:
I am not SEBI registered. The information provided here is for learning purposes only and should not be interpreted as financial advice. Consider the broader market context and consult with a qualified financial advisor before making investment decisions.

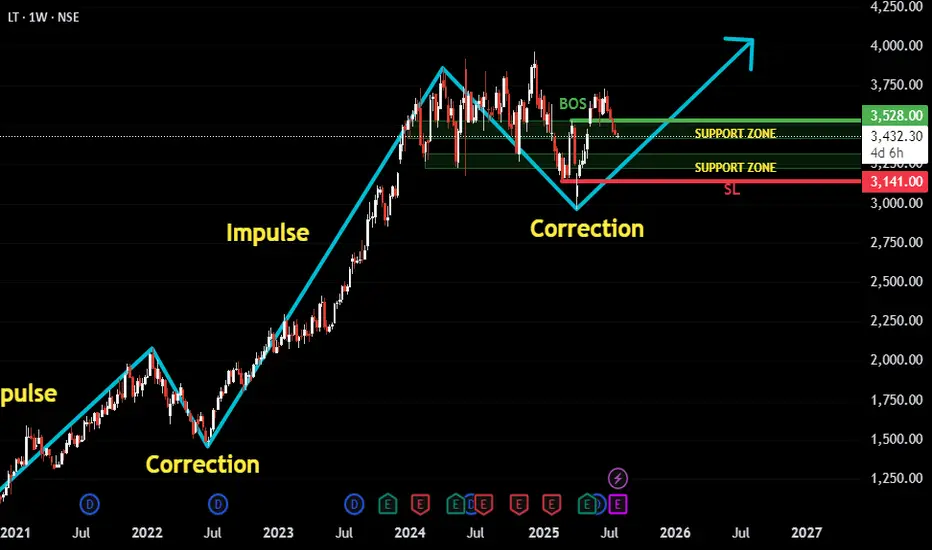
LT Following Classic Impulse-Correction Rhythm.This is a trend-following setup on LT (Larsen & Toubro) where we’ve observed a clear repeating pattern of Impulse → Correction → Impulse. The recent price action suggests that the latest correction has matured, and the structure now hints at a potential next impulse wave beginning.
Here’s the thought process behind the setup:
✅ The stock has been trending upward in a clean impulse-correction rhythm.
🕒 We waited patiently for the correction phase to develop fully and mature.
🔄 A Break of Structure occurred, signaling potential trend continuation.
🔁 Retest on support zones further strengthens the bullish case.
🧭 Support zones are drawn from the Daily chart for precision, though this post is based on the Weekly timeframe for broader trend visibility.
🛡️ Stop-loss can be maintained near ₹3141, just below key support.
🎯 Target is based on a 1:2 Risk-to-Reward setup, aligning with disciplined trading strategy.
Overall, this is a classic example of waiting for confirmation after correction before re-entering in the direction of the dominant trend.
As always, risk management is key. Watch how price behaves around the recent structure and support zones for validation.

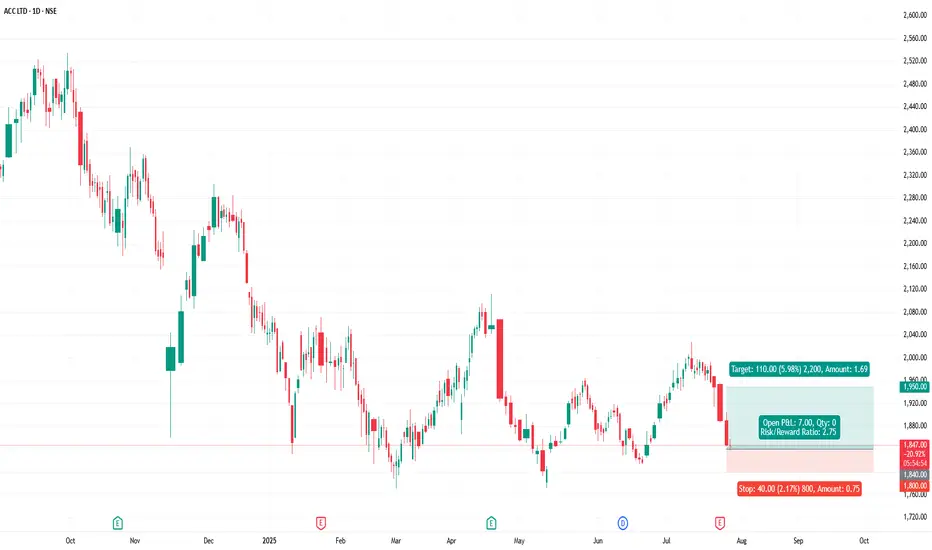
ACC - ACC Ltd (Daily chart, NSE) - Long PositionACC - ACC Ltd (Daily chart, NSE) - Long Position
Risk assessment: Medium {support structure integrity risk}
Risk/Reward ratio ~ 2.75
Current Market Price (CMP) ~ 1848
Entry limit ~ 1845 to 1835 (Avg. - 1840) on July 28, 2025
Target limit ~1950 (+5.98%; +110 points)
Stop order limit ~ 1800 (-2.17%; -40 points)
Disclaimer: Investments in securities markets are subject to market risks. All information presented in this group is strictly for reference and personal study purposes only and is not a recommendation and/or a solicitation to act upon under any interpretation of the letter.
LEGEND:
{curly brackets} = observation notes
= important updates
(parentheses) = information details
~ tilde/approximation = variable value
-hyphen = fixed value
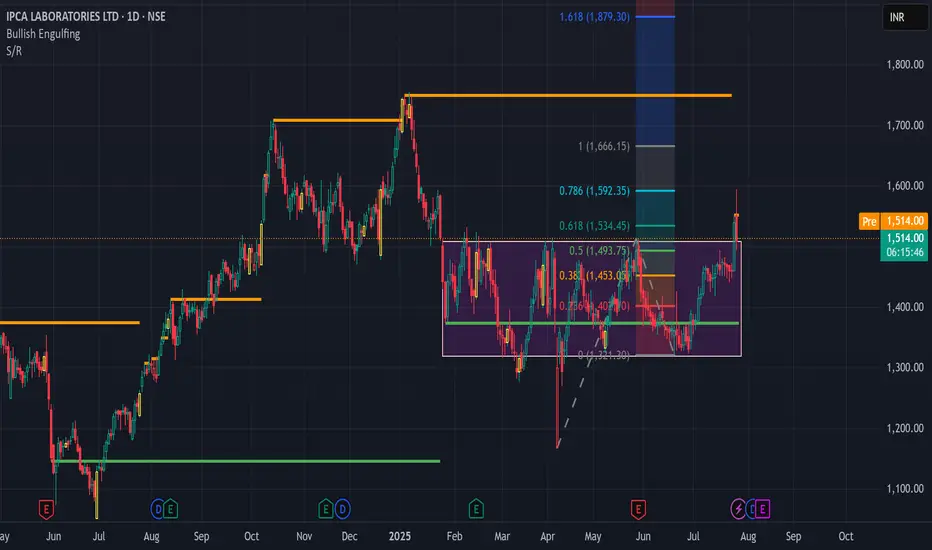
pcalabs BreakoutNSE:IPCALAB is making a Multi-month High. You can buy once it crosses 1552 and 1st Target would 1666. You can keep Second Target as 1800, provided try to achieve the same using Trailing Stoploss.
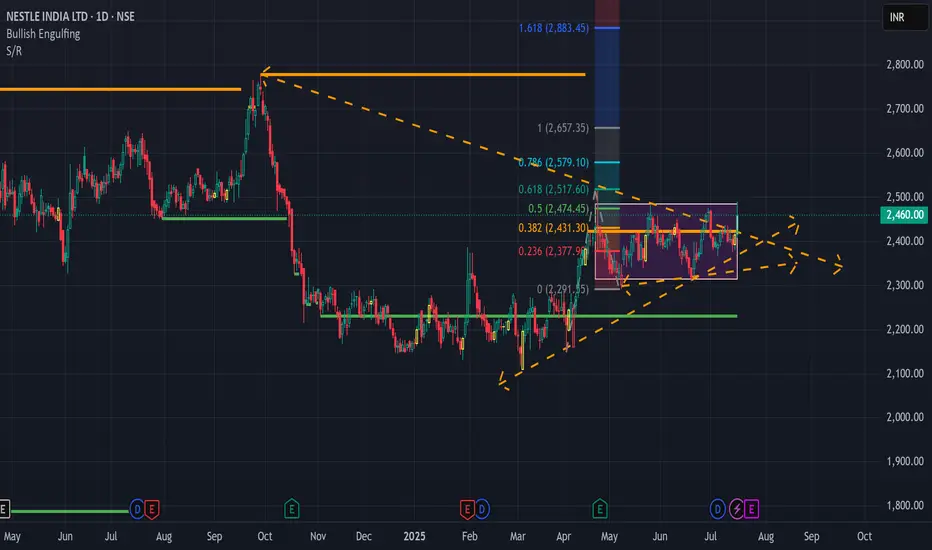
Nestle India in BreakoutNSE:NESTLEIND shows a breakout of a bullish ascending traingle trend. You can enter at 2460 and Target for 2640.
PPAP- LONG NSE:PPAP Weekly long consolidation breakout with retest may continue steady and long rally for short to medium term.

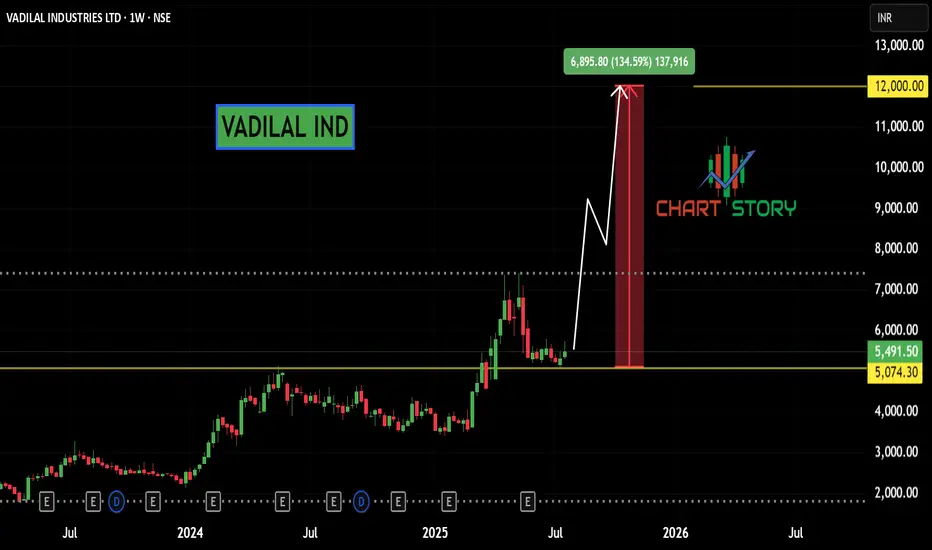
VADILAL IND - BUYNSE:VADILALIND Weekly parabolic formation may continue fast and short term momentum .
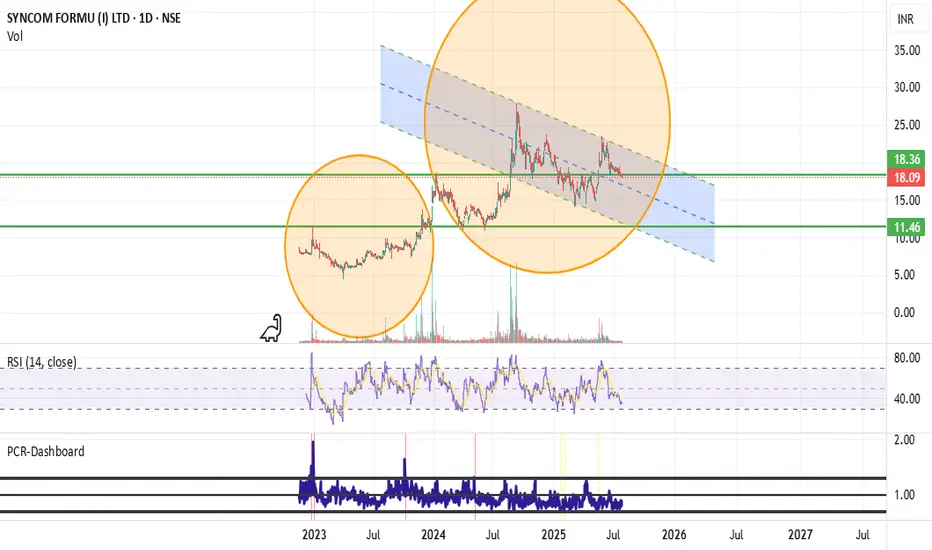
Long on Syncom FormulationThe chart normally gives a cup with handle and then a breakout and then a retest and then moves up high.
This is the second time it is giving a similar pattern of breakout and then retest on weekly candles. Had a look at the fundamentals and it looks good too. Will track this stock. I think this will go up rapidly when pharma comes back into favor.
Long on Arrow GreentechBreakout given. Taken a small tracking position.
AGL is India’s largest manufacturer of water-soluble films, specializing in the development, production, and marketing of a diverse range of PVA/PVOH-based films.
Revenue Bifurcation - FY25
Green Products - 10%
High Tech Products - 90%

Premier Energies - Long on itMassive bull run is coming is what I anticipate but I am a novice so dont trade based on my analysis.
Chart has been stabilising over a period of time in this hourly chart. Target can be big as per me. I am NOT holding the stock. DYOR.

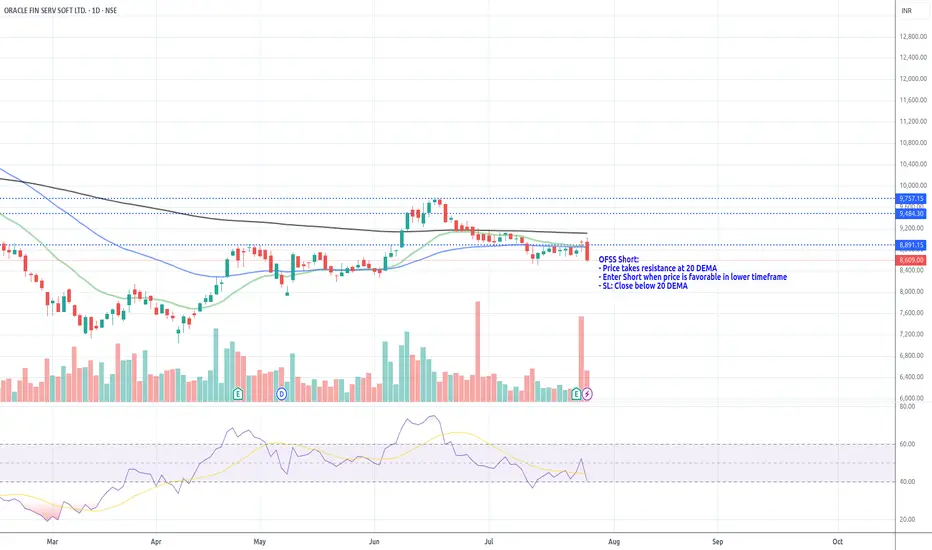
OFSS Short_Resistance @ 20 DEMAOFSS Short:
- Price takes resistance at 20 DEMA
- Enter Short when price is favorable in lower timeframe
- SL: Close below 20 DEMA
Zydus Lifesciences Long_Support @ 20 DEMAZydus Lifesciences Long:
- Clean Price action
- price takes support near 20 DEMA
- price test 50 DEMA for first time after Golden Crossover (50 > 200 DEMA)
- Hidden Bullish Divergence in action.
- Enter long when the prices are favorable
- SL: close below 20 DEMA

DR LALPATH LABS - LONGNSE:LALPATHLAB Weekly outperforming stock with active buyers. May be continue bullish rally one to three weeks more.
