L&T Finance – Cup & Handle Breakout After 8 Years!L&T Finance has finally broken out of a classic Cup and Handle pattern, reclaiming its 2017 all-time high after nearly 8 years of consolidation. Strong volume confirmation adds weight to this long-term bullish breakout. A must-watch for positional traders and investors looking for momentum in the NBFC space!

Pondy Oxide, Kindly do your own studyThis stock is in momentum in weekly time frame.
Monthly time frame- stock has completed 4 wave structure and looks like its in 5th wave.
Weekly-stock has challenged upper bollinger band
Weekly MACD -PCO stat
Weekly RSI is in momentum
Weekly ADX is strong
Daily price is in momentum and volume has increased

Piramal Intraday Play/ Long:Piramal Intraday Play/ Long:
- Bullish Engulfing Candle with very strong volume
- Price close to the 20 DEMA
- After many indecisive candles, price moves stronger
- Earnings in 15 days.
- Enter long when the price is favorable in lower time frame
- SL: close below 20 DEMA

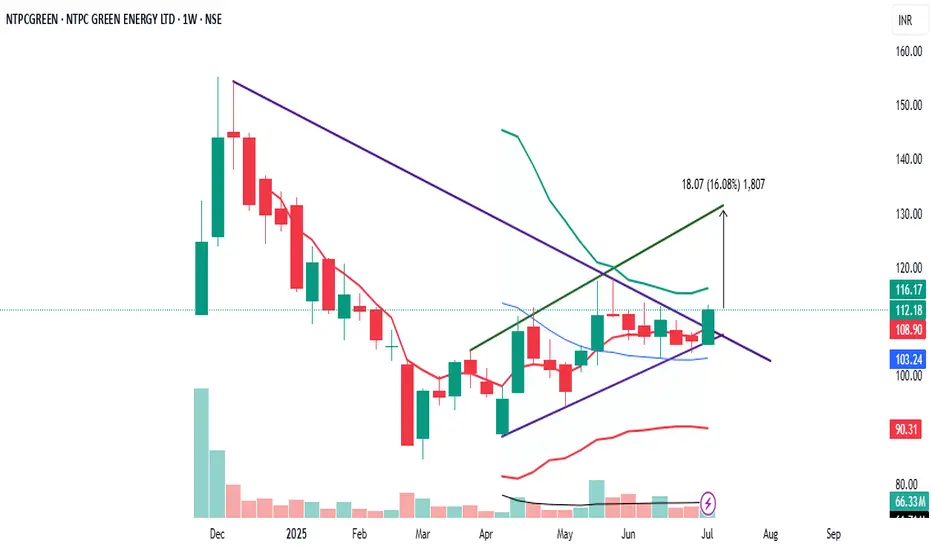
NTPC GREEN, Kindly do your own studyThis stock is resdy for next move.
Stock is moving in channel.
Daily time frame-stock has given breakout with high volume with upper bollinger band challenged.
Daily macd turned PCO
Daily RSI is in momentum.
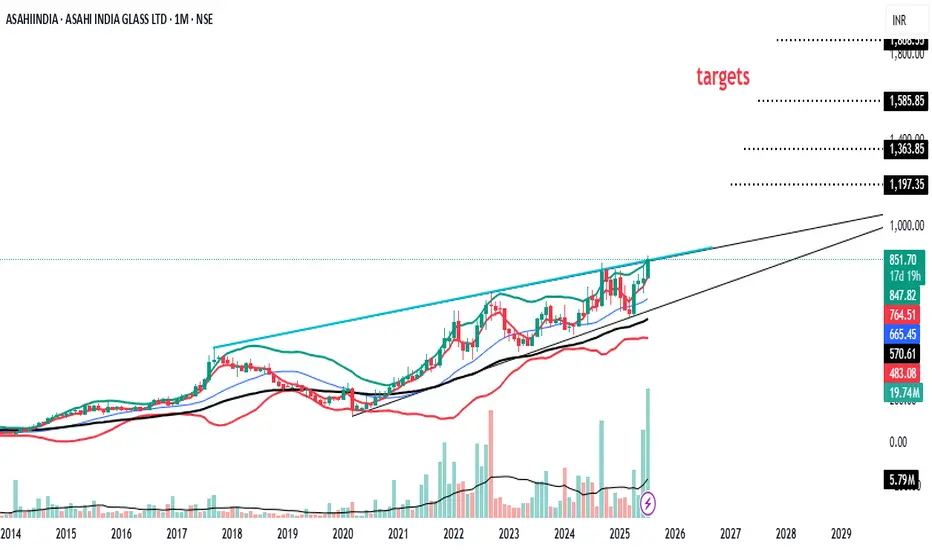
Asahiindia, Kindly do your own studyThis stock has given all time high breakout.
Monthly MACD turn positive
Monthly, weekly and Daily time frame are in momentum
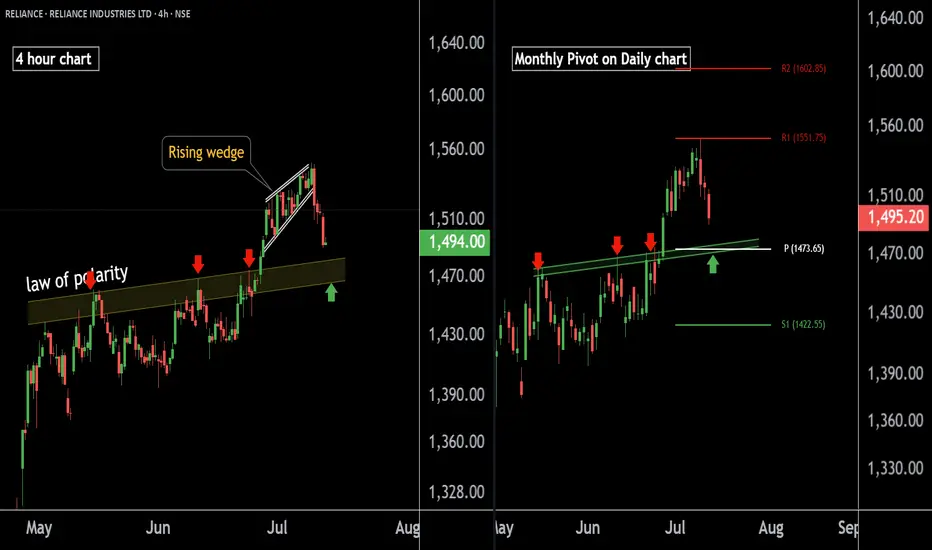
RELIANCE INDUSTRIES at Best Support !! Keep It On Your Radar !!There are two chart of RELIANCE INDUSTRIES on Daily and 4 hour Timeframe.
On the 4-hour timeframe, Reliance is likely to respect its LOP (Line of Polarity) as support, with the support range near 1460-1475.
On the Daily timeframe, the monthly pivot is also positioned around 1473, reinforcing this level as a potential halt or reversal zone.
If this level is sustain we may see higher prices in RELIANCE INDUSTRIES.
Thank You !!!
SUNDARAM FINANCE Near at Support Zone | Keep an eye on it ||There are two charts of Sundaram Finance —on the Weekly timeframe and Daily timeframe.
On the weekly timeframe, the stock is moving within an ascending parallel channel, with the support zone between 4650-4550.
On the daily timeframe, the stock is moving within a descending channel, with the support boundary near 4600-4650.
If this level is sustain then we may see higher prices in SUNDARMFIN
Thank You...

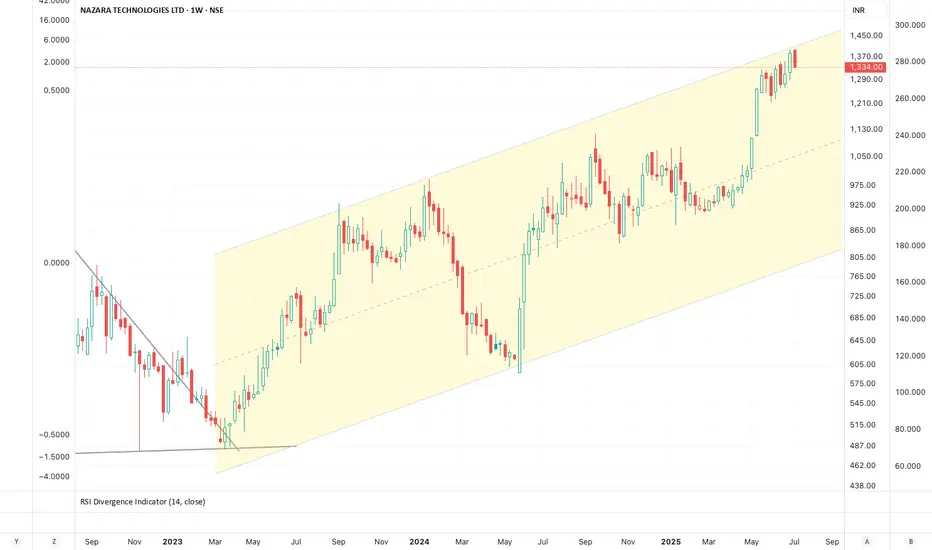
Nazara: na zaraNazara
PER 141
Rising Channel
Insiders selling
Volumes falling
Momentum Indicators overbought
Target
3 figures !!
Review and plan for 14th July 2025 Nifty future and banknifty future analysis and intraday plan.
Results - analysed.
This video is for information/education purpose only. you are 100% responsible for any actions you take by reading/viewing this post.
please consult your financial advisor before taking any action.
----Vinaykumar hiremath, CMT

Titan at Best Support Zone !! This is the 4 hour chart of Titan Company.
Titan having a good support zone near 3400-3460 level.
If this level is sustain , then we may see higher prices in Titan company.
Thank You !!

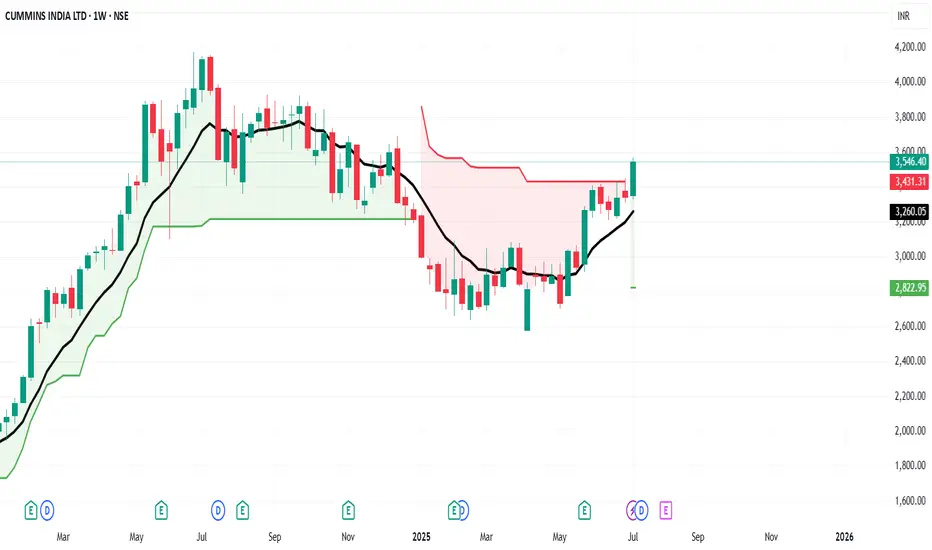
Long CUMMINSINDSuperTrend has turned positive on the weekly chart, with the recent closing price trading above the 10 EMA
BUY CUMMINSIND
Entry - 3570
SL - 3260
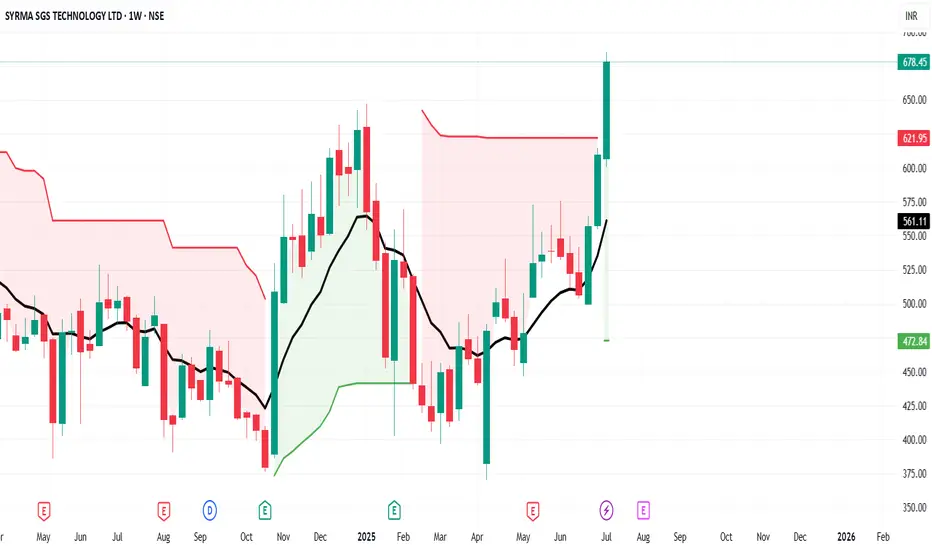
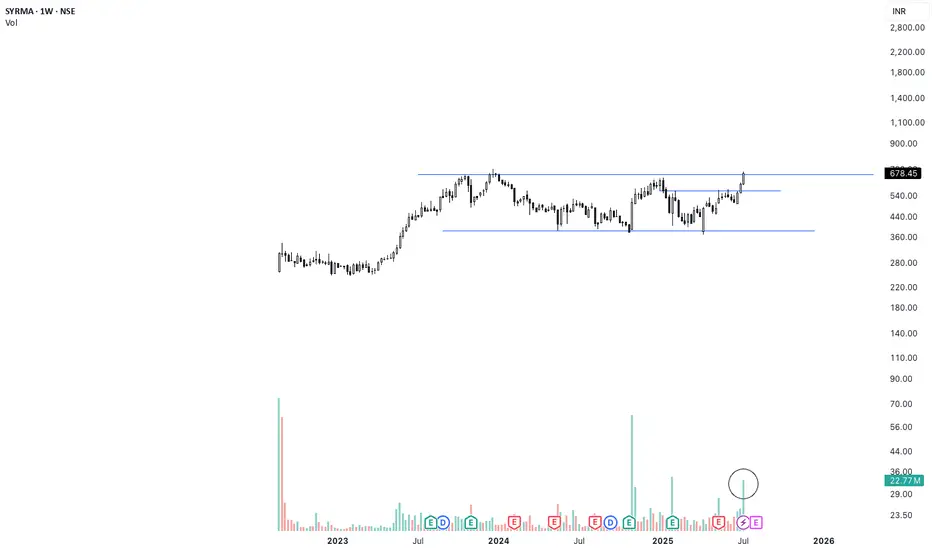
Long SYRMASuperTrend has turned positive on the weekly chart, with the recent closing price trading above the 10 EMA
BUY SYRMA
Entry - 686
SL - 560
Long ACMESOLARSuperTrend has turned positive on the weekly chart, with the recent closing price trading above the 10 EMA
BUY ACMESOLAR
Entry - 304
SL - 250

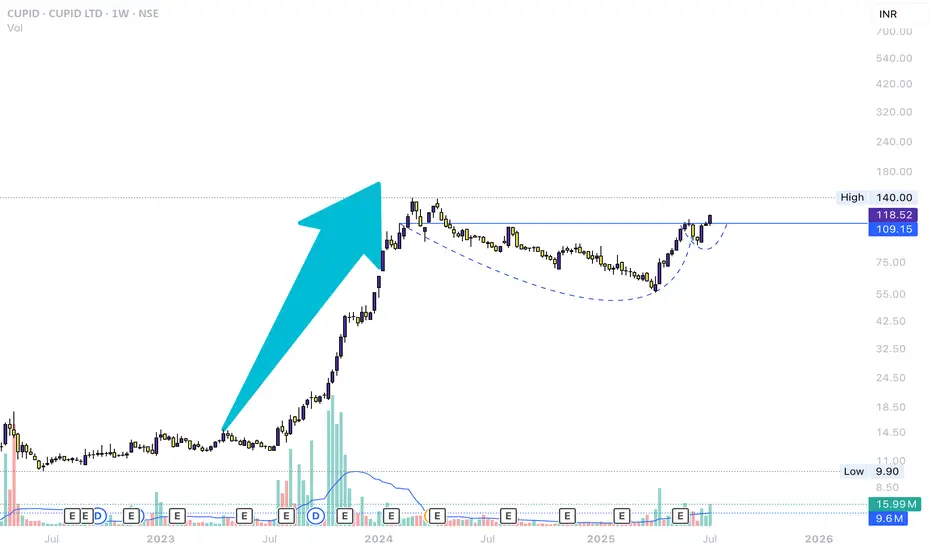
“CUPID LTD – Inverted Head & Shoulders Breakout | Swing TradePattern :- Inverted Head & Shoulders
Scrip :- CUPID LTD
Timeframe :- Daily (1D)
Breakout Confirmation :- Strong breakout above neckline with volume spike
Entry : ₹118.50 (after successful breakout)
SL :- ₹106.60 (below neckline support)
Target 1:- ₹129.50
Target 2 :- ₹160.00
Technical Analysis :-
- Volume spike confirms buying Pressure
- RSI above 65 = bullish momentum
- MACD crossover is the Confirmation
Disclaimer :- This analysis is shared for educational purposes only. Please do your own research or consult a financial advisor before making any trading decisions.
CUPID, breakout, inverted head and shoulders, NSE, swing trade, volume analysis, bullish setup

Long ANANDRATHISuperTrend has turned positive on the weekly chart, with the recent closing price trading above the 10 EMA
BUY ANANDRATHI
Entry - 2250
SL - 2015

NSE.CUPID LONG IDEASuck a beatiful chart patter, Clear Uptrend and Consolidation
Forming Cup & Handle continuation patter and breakout.
Stock can be considered for long term. Keeping SL just below the breakout candle
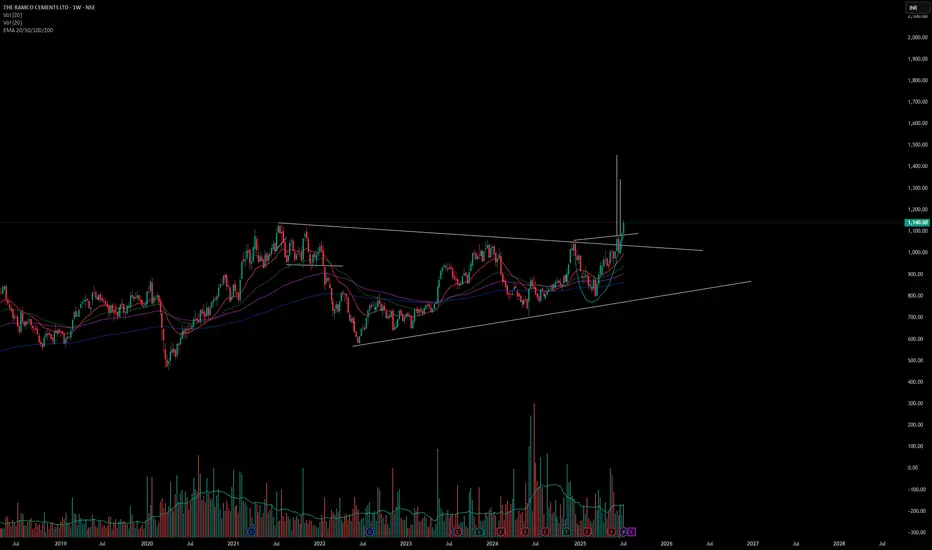
Long The Ramco Cements LTD . On 9/07/2025 I have shared this stock with all of you but very few people have seen this publish idea but today on 13/07/2025 I am sharing this stock with all of guys with weekely analysis of this stock. Its new target is 1450.
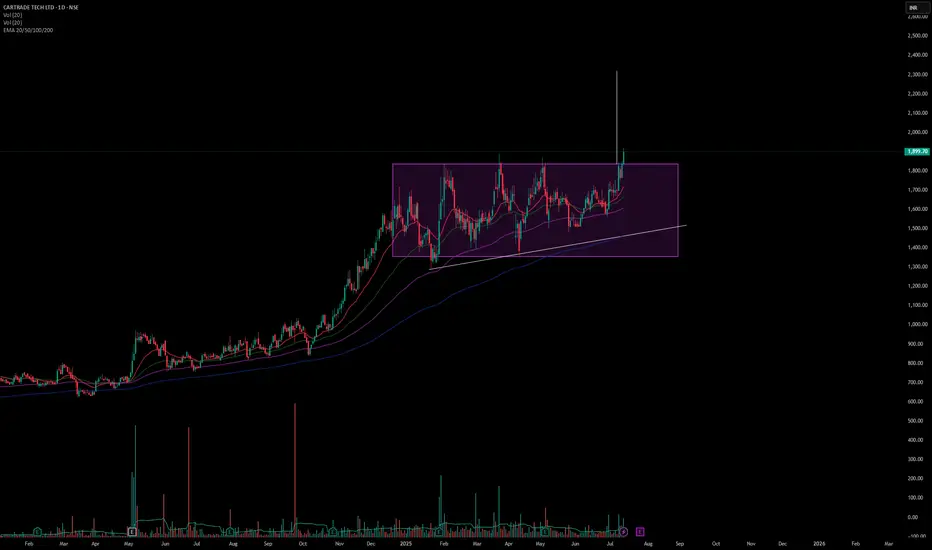
Long Cartrade Tech LTD . This stock has broken out of a rectangle pattern and trending at 1899.70. We can take a swing trade in this stock with an SL of 7.5% which will hit at 1750 and target of 22% which we will achieve at 2320. Our risk & reward ratio is 1:3.
SYRMA Weekly Breakout | High Volume + 1.5-Year Base Structure🚨 Breakout Alert on SYRMA (Weekly)
After 1.5 years of sideways consolidation, SYRMA has finally broken out with strong conviction. The breakout is supported by the highest weekly volume seen in months — signaling smart money accumulation.
📊 Technical Setup:
🔹 1.5-year base formation now broken
🔹 Breakout candle closed above resistance with strength
🔹 Volume spike confirms breakout validity (HVE)
🔹 Structure resembles classic Stage 2 breakout
🟢 Ideal retest zone: ₹670–₹680
🛑 Support zone: ₹635–₹645
Fundamental Snapshot:
✅ Revenue: ₹2,000 Cr → ₹3,800 Cr in 2 years
✅ Net Profit up 50% YoY
✅ EPS (TTM): ₹9.57
✅ Promoter holding: ~46%
✅ Dominant player in EMS & IoT hardware
⚡Macro trend supports domestic electronics manufacturing — still early in the cycle.
Zydus Lifesciences Long_Support at 20 Daily EMAZydus Lifesciences Long:
- Clean Price action
- price takes support near 20 DEMA
- price test 20 DEMA for first time after Golden Crossover (50 > 200 DEMA)
- Hidden Bullish Divergence in action.
- Enter long when the prices are favorable
- SL: close below 20 DEMA

ICICI GI Long_Support at 20 Daily EMAICICI GI Long:
- Price takes support at 20 DEMA
- 2 days before the Earnings call (Caution)
- Enter long when the prices favorable in the lower timeframe
- SL: CLose below 20 DEMA

LTTS Weekly Trade Setup(14th-18th July 2025) – Parallel ChannelThis week, L&T Technology Services (LTTS) is showing a potential breakout opportunity that requires patience and precision. As the stock approaches a key resistance zone near ₹4445, traders should resist the urge to jump in early and instead wait for a breakout and confirmed re-test before entering any long positions.
Let’s break this down.
1. Why the Breakout is Important
- LTTS has been consolidating within a parallel channel between ₹4280 (support) and ₹4445 (resistance). Breakouts from such structures often trigger significant moves — but only when confirmed.
- A false breakout can trap early traders. Hence, waiting for the price to break above ₹4445 and then re-test this level is critical.
2. The Strategy – Wait and React
📌 Step 1: Watch for Breakout
Monitor price action as it approaches and breaches the ₹4445 resistance.
Look for strong bullish candles with volume to validate the breakout.
📌 Step 2: Wait for Re-test
After breakout, price may pull back to test the previous resistance.
This re-test acts as a confirmation that bulls are defending the breakout.
📌 Step 3: Look for Confirmation
Enter only when you see a bullish candlestick pattern (like a bullish engulfing or hammer) near the re-test level on 15-min or 1-hour charts.
🛡️ Stop Loss:
Place your stop below the swing low of the re-test.
This protects you if the breakout fails.
🎯 Target:
Profit booking zone is near ₹4580–₹4600.
Risk/reward ratio: 1:2, 1:3, 1:4+
3. Why Re-test Entries are Powerful
They allow low-risk entries with a tight stop loss.
You avoid chasing price and reduce emotional trading.
Confirmation helps you filter out false breakouts.
4. Final Words
In trading, discipline often beats speed. This LTTS setup is all about timing and structure.
🔔 Watch for the breakout.
🧘♂️ Wait for the re-test.
🎯 Enter only with confirmation.
If executed properly, this trade offers a clean, high R:R opportunity with a clearly defined setup.
