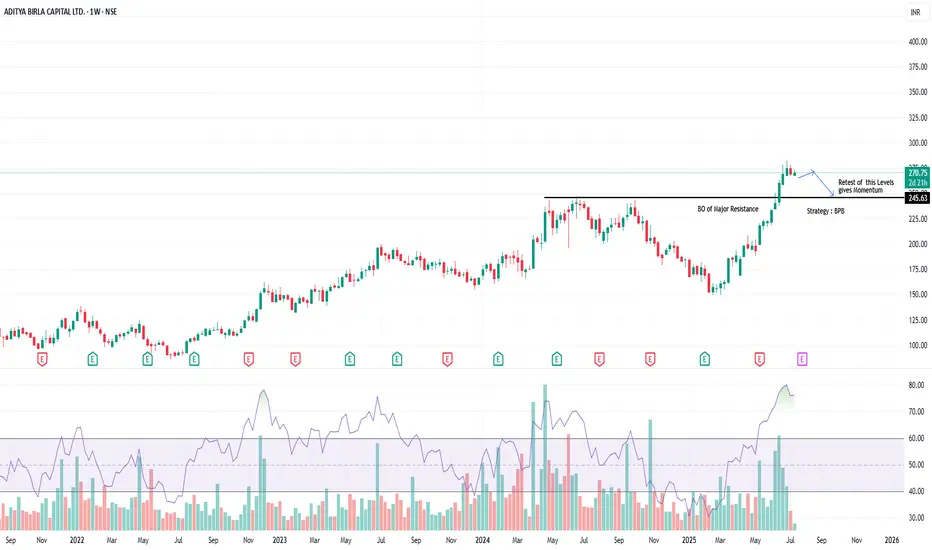
AB Capital – Clean Breakout of Multi-Year Resistance | BPB SetupTimeframe: Weekly | Strategy: Breakout–Pullback (BPB)
Technical Highlights:
========================
✅ BO (Breakout) of a major resistance zone around ₹250–₹255, which was acting as a multi-year supply zone.
📈 Strong bullish momentum seen with expanding volumes and wide-range candles.
🔄 BPB Strategy in Play: Price has broken out and now likely to retest the breakout zone.
🧠 Retest near ₹249–₹255 zone expected to provide fresh momentum.
📊 RSI confirms strength, currently above 70 – confirming a trending phase.
🔍 Key Zones:
===================
Breakout Level: ₹250 (Previous Resistance, now Support)
Immediate Resistance: ₹295–₹300
Target (Post BPB Confirmation): ₹330+
Support for Invalidating BPB: Weekly close below ₹245
📈 Trade Plan (for study purpose only):
=============================================
Wait for price to pull back into ₹250–₹255 zone.
Look for bullish candle confirmation on retest for entry.
SL: Below ₹245 | T1: ₹295 | T2: ₹330
⚠️ Disclaimer:
This idea is purely for educational purposes and does not constitute investment advice. Please consult your financial advisor before making any trading or investment decisions. Always do your own research and risk management.
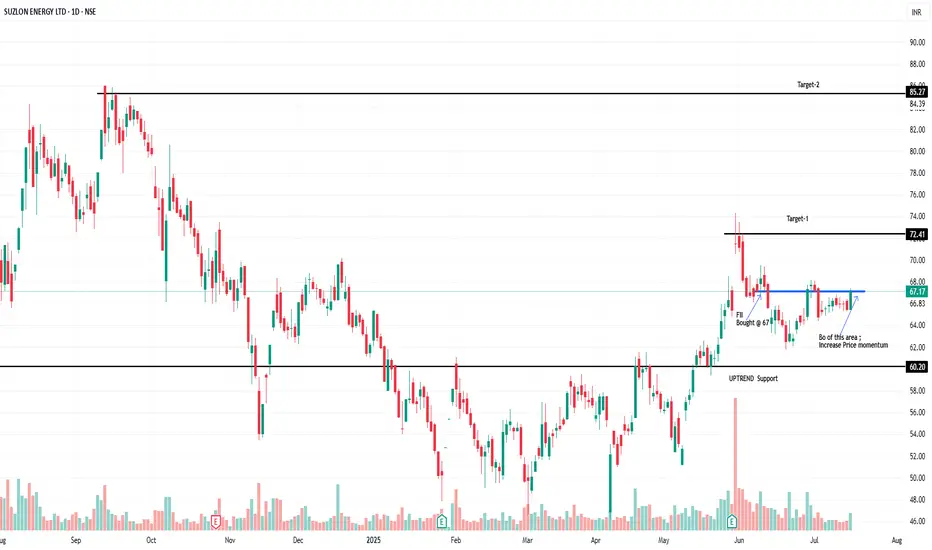
Suzlon Technical AnalysisPrice is currently at area where there was FII bought it earlier in June
-- Break out of current short-Term resistance can give lot of Momentum in price
-- BPB of current Resistance are can give Target-1 and thenTarget-2
Tatatech: Formation of cup and handlethe chart shows the formation of cup and handle in progress. It may shoot the targets depending upon the market perception.
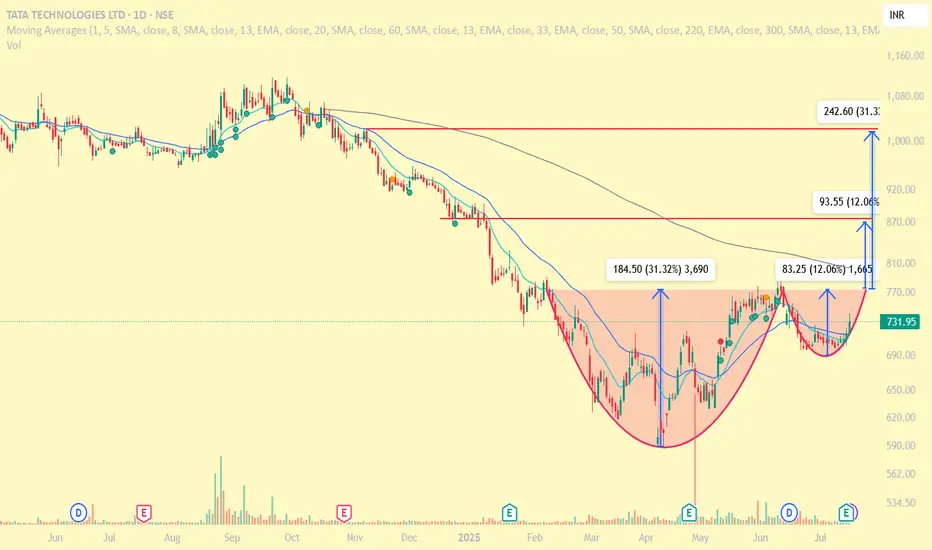
Moving average has only one principle, solve the problem, earn mMoving average has only one principle, solve the problem, earn money,
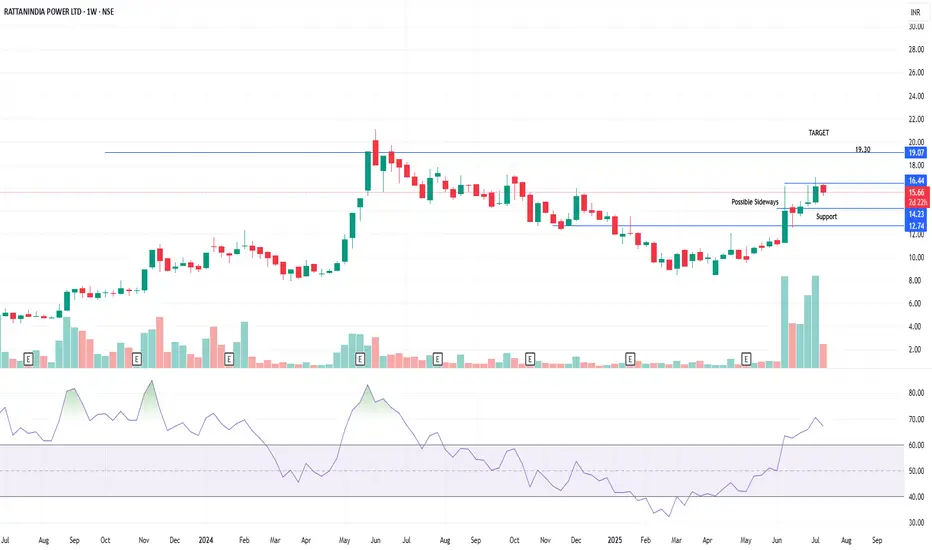
RattanIndia Power Ltd. – Breakout or Pause? A Technical & ShareTimeframe: Weekly | Idea Type: Technical + Smart Money Flow
🧠 Technical Analysis:
=============================================
📈 Stock is currently testing a key resistance zone around ₹16.44, after a strong uptrend.
📉 Possible sideways consolidation around ₹14.23–₹16.44 zone as shown on chart.
🧱 Support Levels:
₹14.23 (near-term support)
₹12.74 (base support zone)
🎯 Upside Target: ₹19.30 — if breakout sustains above ₹16.44 with strong volume.
📊 Volume Surge observed during recent rallies, suggesting accumulation.
💪 RSI above 70, signaling strength but also possible overbought conditions short-term.
💼 Shareholding Trend (as of June 2025):
=============================================
🏢 Promoter Holding stable at 44.06% (unchanged in 9 quarters).
🌍 FII/FPI holding increased from 0.31% (2023) to 4.95% (2025) — strong positive signal.
🏛️ DII holding steady around 6.63%.
📈 Non-Institutional holding has declined, suggesting smart money entry.
Conclusion:
================
“Smart money accumulation (FII/FPI rise), RSI breakout, and volume spike suggest a brewing breakout, but wait for confirmation above ₹16.44.”
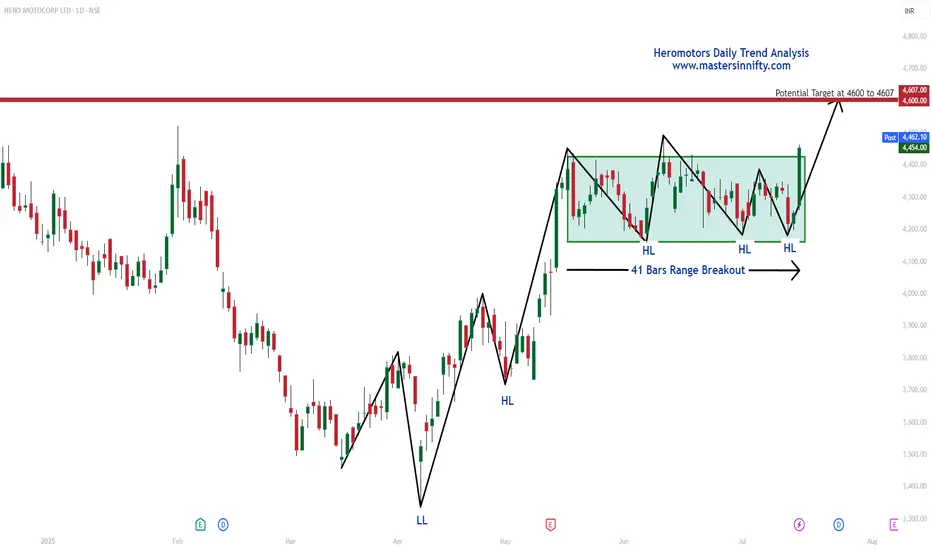
Heromotors Daily Trend Analysis"As per my Daily Trend Analysis, Heromotors Ltd has broken out of a 41-bar range and closed above it today. This breakout indicates a potential upward move toward the resistance zone of 4600 to 4607 in the coming sessions.
Traders are advised to perform their own technical analysis and ensure proper risk management before entering the trade."
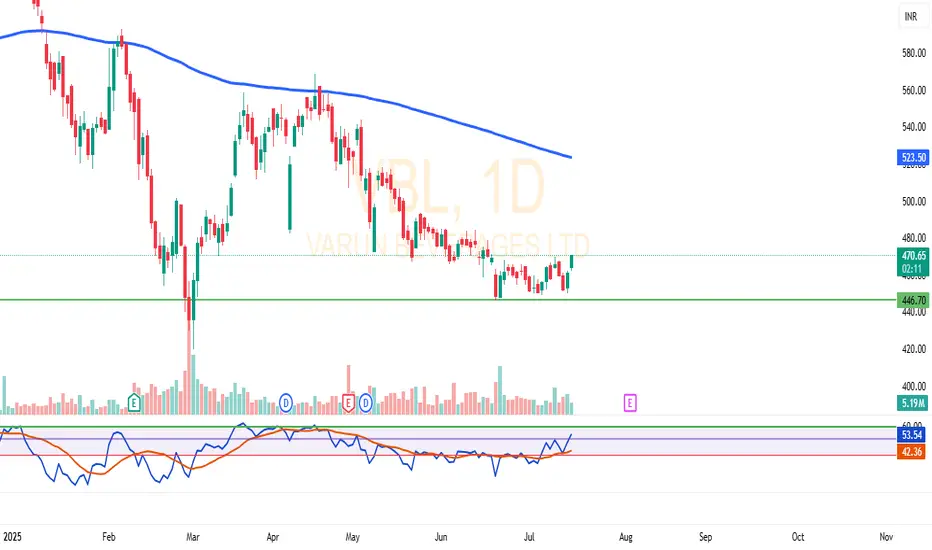
VBL Bounces from ₹446 Support – RSI Breakout with Volume SpikeVBL has shown multiple rebounds from the strong support zone around ₹446.
After several weeks of sideways consolidation, the stock is attempting a breakout with increased volume in the current session.
The RSI indicator has moved above the 50 level with a bullish crossover, indicating potential strength building up.
On the upside, the 200 EMA near ₹523 may act as a resistance level.
📊 This is a technical observation based on price structure, volume, and momentum — not a buy/sell recommendation.
The setup appears interesting for technical traders watching for a breakout from this range.
🔍 What’s your take on this pattern? Feel free to share your view in the comments.
Biocon: Heading for All-Time High?🚀 Biocon: Heading for All-Time High? 🚀
📉 CMP: ₹390
🔒 Stop Loss: ₹330
🎯 Targets: ₹428 | ₹478 | ₹560
🔍 Why Biocon Looks Promising?
✅ Weekly Rounding Bottom Breakout: Breakout triggered above ₹390
✅ Weekly Box Breakout: Confirmation above ₹398 strengthens the setup
✅ Final Confirmation: A weekly close above ₹402 will validate the breakout for a potential strong upside
💡 Strategy & Risk Management:
📈 Phased Entry: Build positions gradually post confirmation to manage risk effectively
🔒 Strict SL: Maintain stop loss at ₹330 to protect capital in case of reversal
📍 Outlook: Biocon is showing strong technical signals with an all-time high on the radar, making it a compelling positional trade setup.
📉 Disclaimer: Not SEBI-registered. Please do your own research or consult a financial advisor before investing.
#Biocon #PharmaStocks #TechnicalBreakout #AllTimeHigh #SwingTrading #StockMarket #InvestmentOpportunities

PAYTM - 3 WHITE SOLDIERSNo. of Candles: 3
Trend Context: Appears after a downtrend or consolidation (best)
Body Size: Long real bodies (bullish)
Wicks: Small or nonexistent lower wick
Volumes: > avg of 10 days
My criteria for spotting 3 white soldiers -
Each candle needs to opens within or slightly below the previous candle’s body and closes higher than the previous candle.
The candles also have a small or no lower shadow, indicating consistent buying pressure.
High on volumes

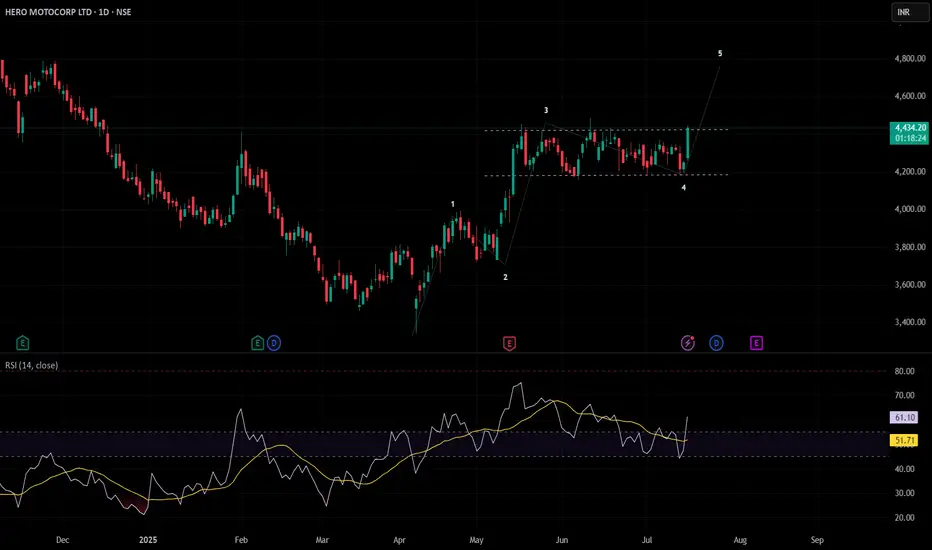
Hero MotoCorp: Reversal in Sight? 🚀 Hero MotoCorp: Reversal in Sight? 🚀
📉 CMP: ₹4438
🔒 Stop Loss: ₹4090
🎯 Targets: ₹5030 | ₹5700
🔍 Why Hero MotoCorp Looks Promising?
✅ Rounding Bottom Breakout: Weekly close above ₹4412 confirms this bullish reversal pattern
✅ Box Breakout: 8-week consolidation range of ₹4454–₹4202 broken above ₹4460, signalling strength
✅ Flag & Pole Setup: Larger range of ₹3354–₹4454 forms a flag-pole structure with breakout above ₹4460
💡 Strategic Insight:
📈 Confirmation Level: A weekly close above ₹4500 will further confirm reversal for long-term upside
🔒 Strict SL: Maintain stop loss at ₹4190 to manage downside risks effectively
📍 Outlook: Multiple technical setups indicate potential for a long-term bullish reversal with targets up to ₹5700.
📉 Disclaimer: Not SEBI-registered. Please do your own research or consult a financial advisor before investing.
#HeroMotoCorp #AutoSector #TechnicalAnalysis #BreakoutTrade #ReversalPattern #SwingTrading #StockMarketIndia #InvestmentOpportunity

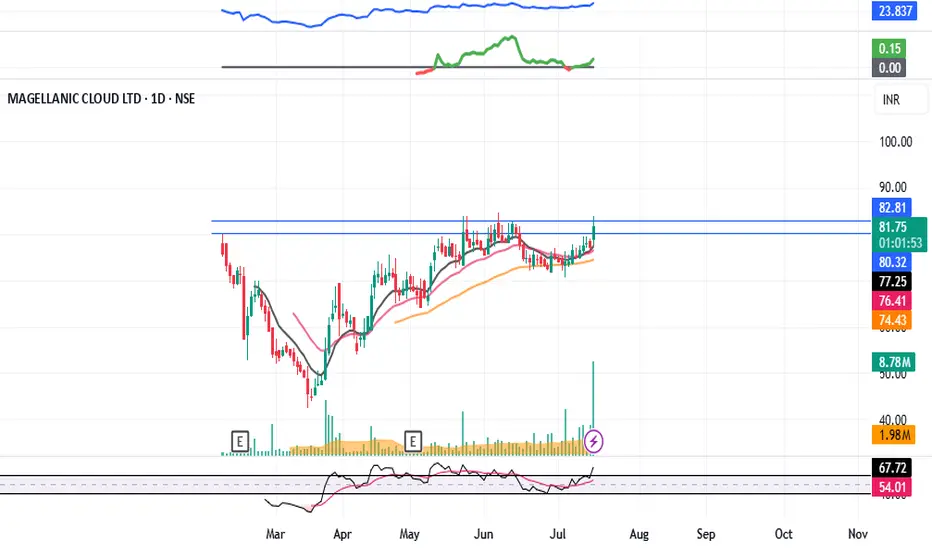
MCLOUD : Post IPO Base Breakout#MCLOUD #IPOstock #breakout #momentumstock #patterntrading #cupandhandle
MCLOUD : Swing Trade
>> Post IPO Base Breakout
>> Cup & Handle Pattern
>> Trending Stock
>> Good Strength & Volume Building-up
Swing Traders can lock profit at 10% and keep trailing
Pls Boost, Comment & Follow for more analysis
Disc : Charts shared are for Learning purpose not a Trade Recommendation, Take postions only after consulting your Financial Advisor or a SEBI Registered Advisor.
FACT : Approaching a major Red Band Resistance FACT : Approaching a major Red Band Resistance .
Important Level to watch for is 1112 .
( Not a Buy / Sell Recommendation
Do your own due diligence ,Market is subject to risks, This is my own view and for learning only .)

HERO MOTOCORP LTD. breaking outHero looking good for a swing.
Hero MotoCorp is showing signs of a breakout above ₹4,420 with strong buying momentum. If the price stays above this level with good volume, it could rise toward ₹4,930–₹5,000. This looks like a good opportunity for swing traders to enter and aim for higher gains.
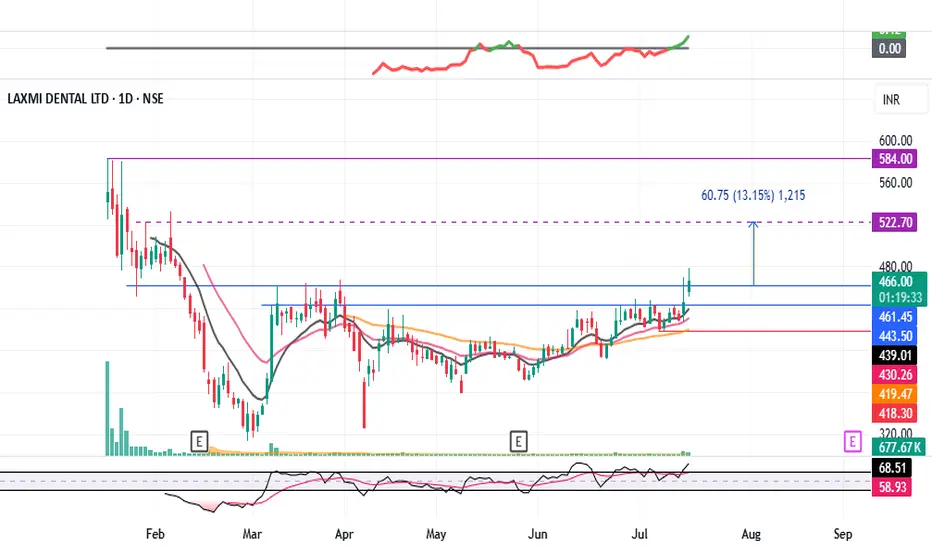
LAXMIDENTL : Consolidation Breakout#LAXMIDENTL #breakout #breakouttrading #ipostock
LAXMIDENTL : Swing Trade
>> Consolidation Breakout
>> Volumes Building up
>> Stock in Momentum
>> Good Strength in stock
>> Trending setup
Swing Traders can lock profit at 10% and keep trailing
Pls Boost, Comment & Follow for more analysis
Disc : Charts shared are for Learning purpose not a Trade Recommendation, Take postions only after consulting your Financial Advisor or a SEBI Registered Advisor.
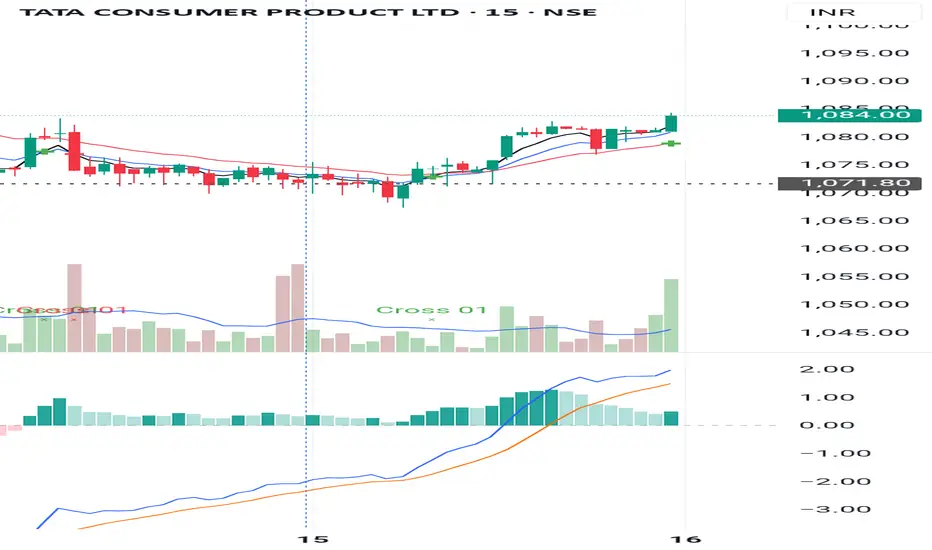
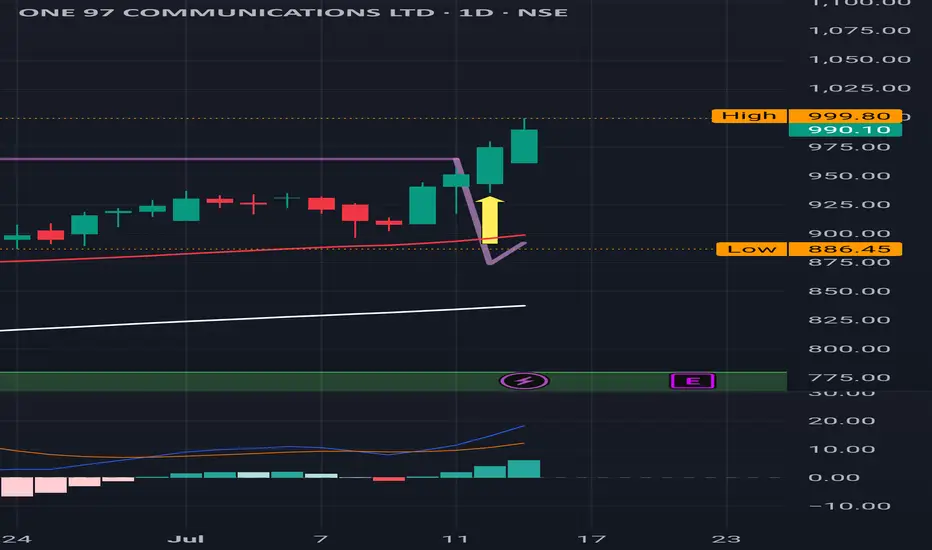
Paytm : Buy Triggered ,next level to watch for is 1062
Paytm : Buy Triggered ,next level to watch for is 1062.
( Not a Buy / Sell Recommendation
Do your own due diligence ,Market is subject to risks, This is my own view and for learning only .)
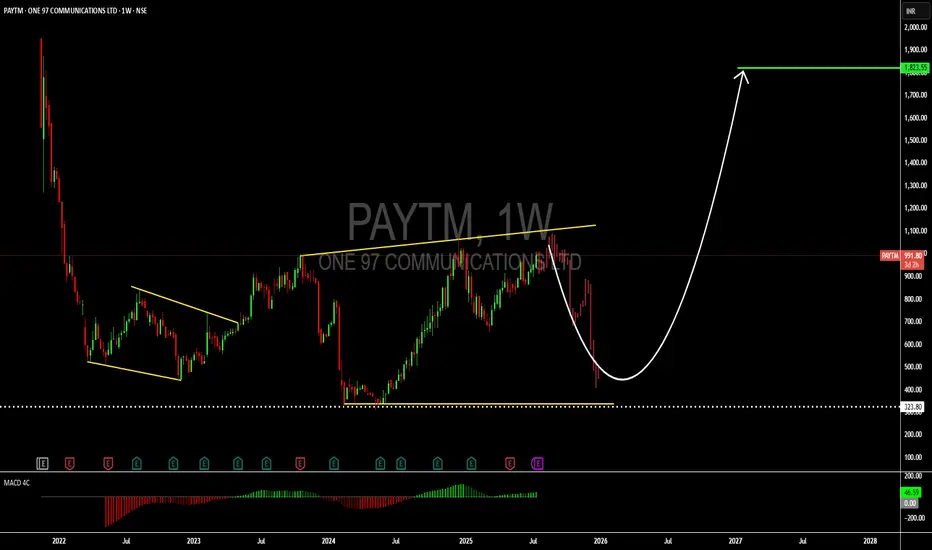
A long-term hold: PAYTM stockHello,
One 97 Communications Ltd. or PAYTM engages in the development of digital goods and mobile commerce platform. It operates through the following segments: Payment, Commerce, Cloud, and Others. The company was founded by Vijay Shekhar Sharma on December 22, 2000 and is headquartered in Noida, India.
The company's revenue continues to grow over time. During the 4th Quarter ended 31st March 2025, PAYTM reported revenu of $224M up from $214Mn in the previous quarter (Up 5% QoQ). The company is also now close to break-even from a profit after tax metric. PAT* of $(3) Mn, an improvement of $22 Mn QoQ. The business generated a net payment margin of $68mn including UPI incentive.
To continue driving value growth, the company states that they will be focusing on the below pillars;
Merchant payments
Consumer acquisition
International business
Financial services
Looking at the The Paytm Q4 FY25 report reveals several compelling opportunities for growth and profitability. The expanding merchant ecosystem, now at 12.4 million devices, provides a strong foundation for deeper financial services penetration, particularly merchant lending, which has seen consistent growth and high repeat rates. With India’s MSME sector largely underpenetrated in digital payments, there is a vast opportunity to deploy innovative payment solutions, especially in tier-2 and tier-3 cities. Additionally, the company’s focus on new products like the Solar and Mahakumbh Soundbox positions it well to enhance merchant engagement and retention. The financial services segment, buoyed by better asset quality and growing lender partnerships, offers room for scale in both lending and wealth management. Furthermore, regulatory prospects such as the introduction of MDR on UPI payments for large merchants could open new monetization pathways. International expansion, though longer-term, presents another avenue for replicating Paytm’s tech-driven financial services model in other markets.
While the situation looks positive, there are a few risks for this company.
Regulatory uncertainty
Credit cycle sensitivity
Competitive pressure
Security risks as Paytm scales its plartforms.
Dependence on incentives
The above risks are likely to delay or limit Paytm’s ability to achieve sustained profitability and growth across its payment, lending, and financial services segments. From a technical perspective, we see PAYTM as a long term buy or hold seeing long term opportunity for massive growth in the company.
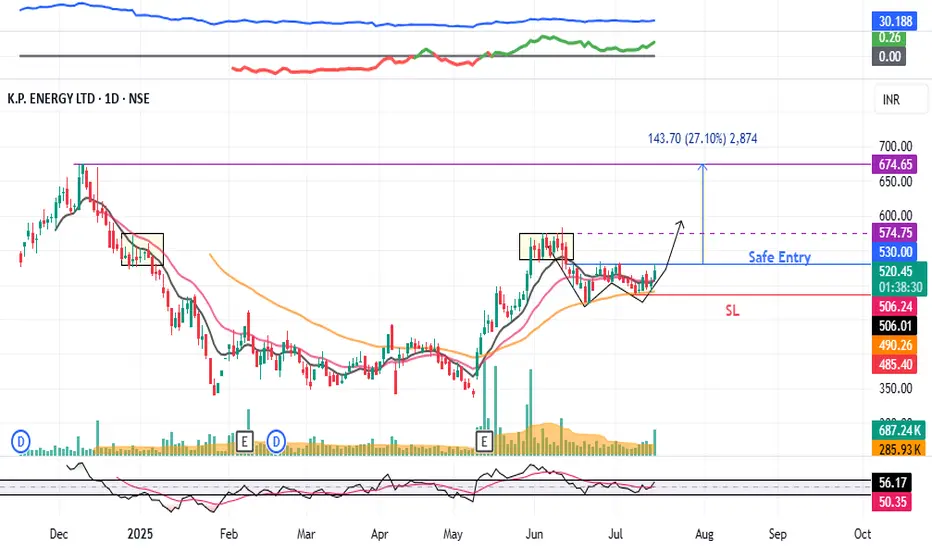
KPEL : Breakout stock#KPEL #swingtrade #breakoutstock #Wpattern #patterntrading
KPEL : Swing Trade
>> Trending Stock
>> W Pattern Breakout soon
>> Good Volumes & Strength
>> Good upside potential
Swing Traders can lock profit at 10% and keep trailing
Pls Boost, Comment & Follow for more analysis
Disc : Charts shared are for Learning purpose not a Trade Recommendation, Take postions only after consulting your Financial Advisor or a SEBI Registered Advisor.
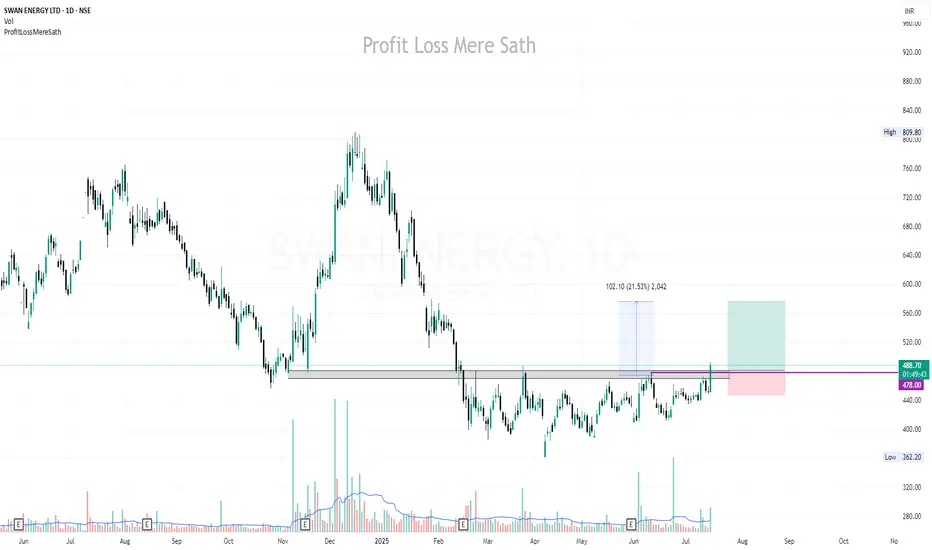
SWANENERGY | Risk-Takers Buy @LTP, Safer Buy Above 480 closing..Disclaimer:
This is not financial advice. Please do your own research or consult with a financial advisor before making any investment decisions. Investments in stocks can be risky and may result in loss of capital.
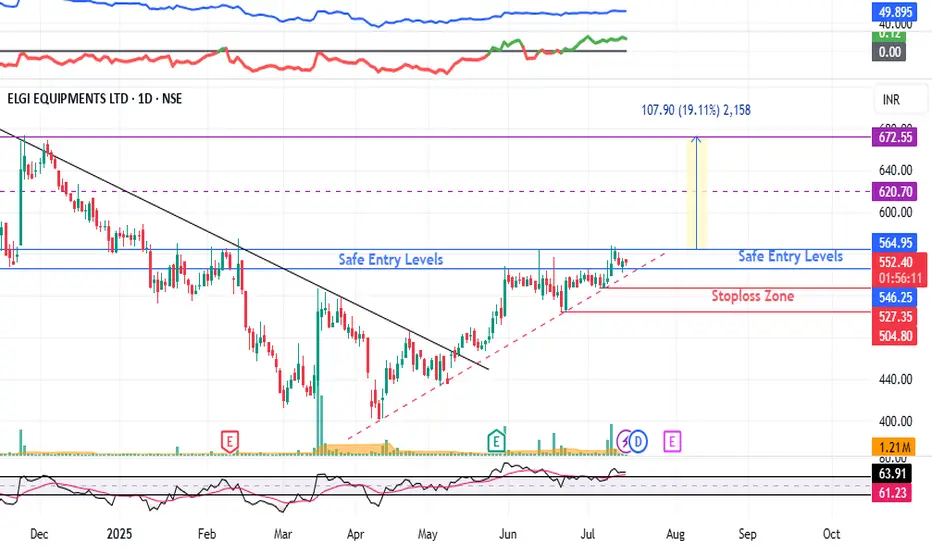
ELGIEQUIP : Breakout Soon#ELGIEQUIP #breakoutstock #swingtrade #trendingstock
ELGIEQUIP : Swing Trade
>> Breakout candidate
>> Trending changing happening
>> Good strength & Volume
>> Risk Reward Favorable
Swing Traders can lock profit at 10% and keep trailing
Pls Boost, Comment & Follow for more analysis
Disc : Charts shared are for Learning purpose not a Trade Recommendation, Take postions only after consulting your Financial Advisor or a SEBI Registered Advisor.
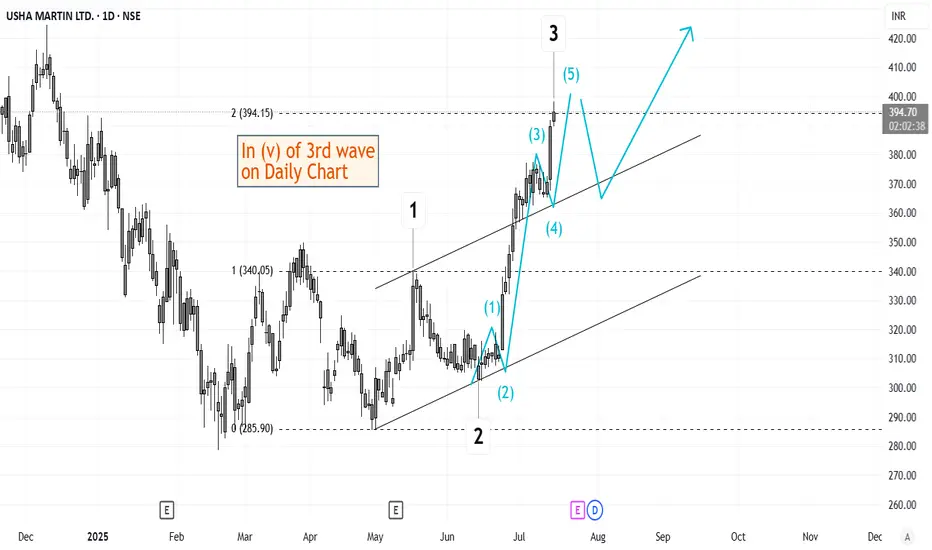
Elliott Wave Analysis of Usha Martin USHAMARTThe script is currently in (v) of 3rd wave on daily time frame. This should be followed by a short retracement and then a 5th wave up. Will keep updating this chart as it progresses.
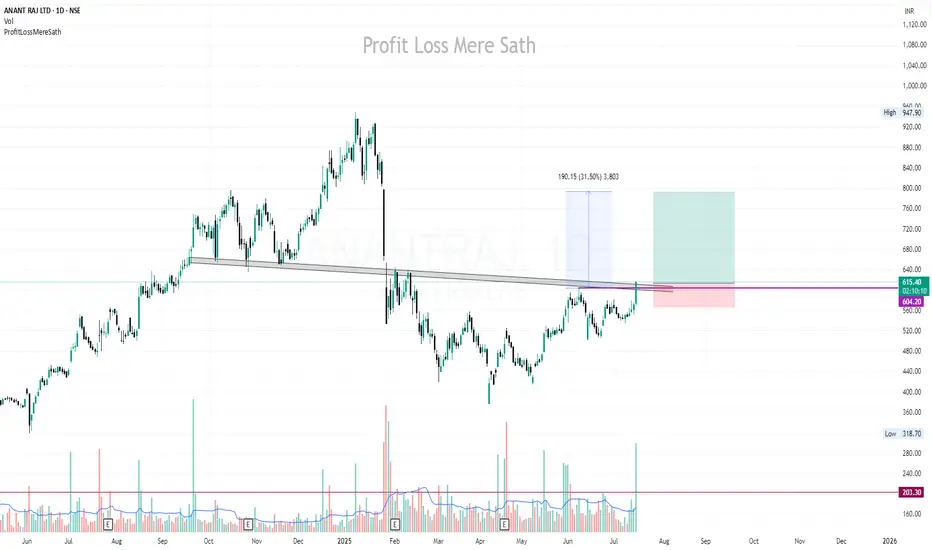
ANANTRAJ | Buy @LTP | SL below 560 | Target 790Disclaimer:
This is not financial advice. Please do your own research or consult with a financial advisor before making any investment decisions. Investments in stocks can be risky and may result in loss of capital.
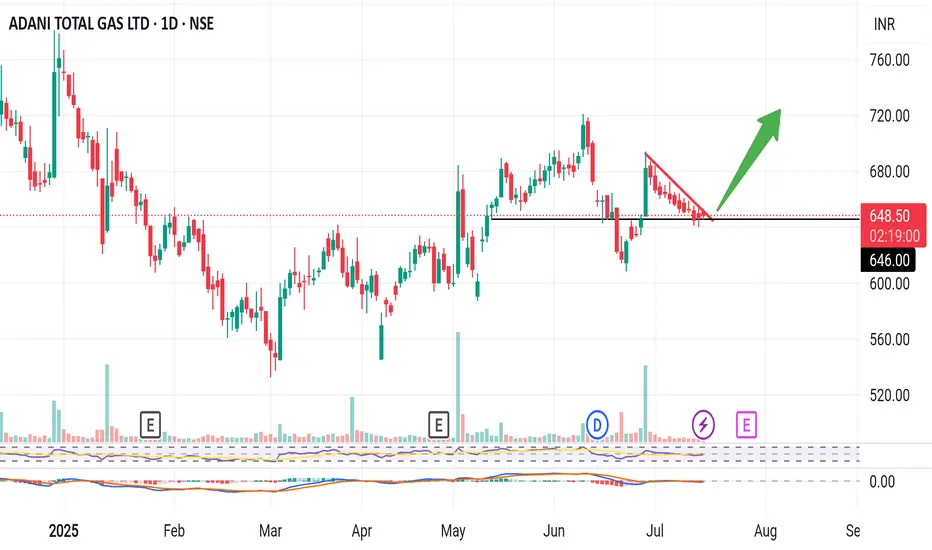
Atgl ready for big jump . Atgl accumulation phase going on. Anytime big breakout possible target 690/720/770...sl 610 below day close .risk reward 1:2/1:3/1:5. Choice z yours
Elliott Wave Analysis of Kirloskar Brothers KIRLOSBROSThe script is currently in 4th wave of hourly chart. The 4th wave seems to be ending, which means a 5th wave will start from here. The wave patters and patterns, retracements and analysis have been highlighted on the chart. Will update this as it progresses.
