ACC BULL waves started BIG Giant Ready to Roll !!!ACC daily counts suggested DUAL match for Eillot waves + Harmonics bullish Wave structure
both looks bullish implus started for this stock
LONG TERM investors get ready for good returns in future for 2 to 5 yrs
all charts shown to understand elliot waves theory + harmonics waves + gann theory + time theory
all charts are education purpose!!!!!
we don't any responsibilities for profit /loss

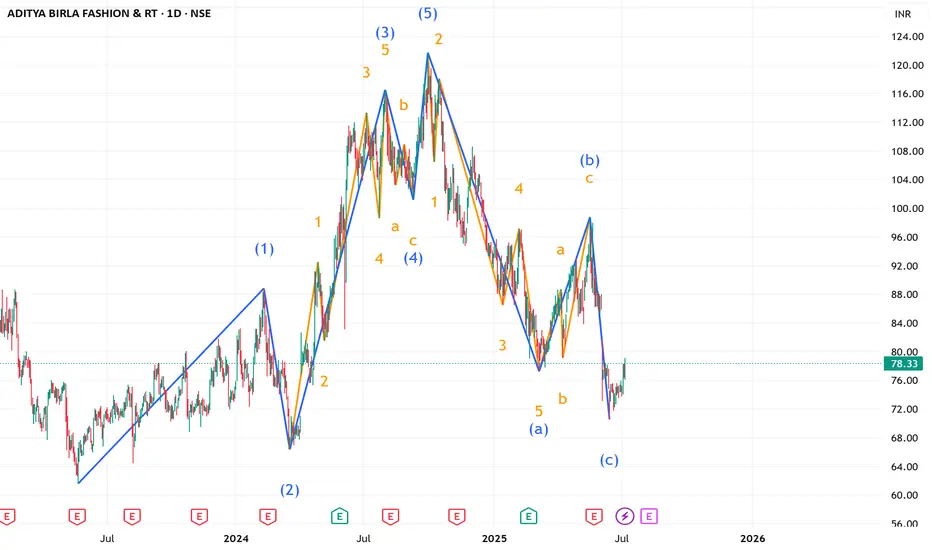
ABRL short term long 98 on the way LONG term also goodABRL
looking good structure as per daily counts
seems correction zigzag done ABC
in validation level 69.90 on daily
only for education chart
BAJAJFINSRV - A BULLISH RALLY AFTER DOUBLE BOTTOMHUHH!!
This rally is still on!! After double bottom "w" pattern it crosse300+ pts.
Now there is a consolidation phase.


Axis ...moving in a channel..Good for swing traders for short term. Stock moving in a channel... price levels given

AB AMCCup and handle pattern, fundamentally strong. Cheap, if compared with HDFC AMC. Price level given. Lets see...

FSN E COMMERCE VENTURES at Best Support Level | NYKAA !!This is the 4 hour Chart of Nykaa.
Nykaa having a good law of polairty near at 195-190 range.
Nykaa is forming ascending boradening wedge pattern with support at 190-195 range .
If this level is sustain , then we may see higher prices in Nykaa .
Thank You !!

NATCO , reversal breakNATCO Pharma, after a downtrend, moving in a higher high pattern. Hope fully a break out from this trend line. Lets see how it may behave from here. next levels have been provided.

L&T Finance : Monthly Time Frame , cleared the Red Band L&T Finance : Monthly Time Frame , cleared the Red Band Resistance at around 175 .
It's in a Buy trajectory on a daily time frame.
( Not a Buy / Sell Recommendation
Do your own due diligence ,Market is subject to risks, This is my own view and for learning only .)

ASTRA MICROWAVE LTD S/RSupport and Resistance Levels:
Support Levels: These are price points (green line/shade) where a downward trend may be halted due to a concentration of buying interest. Imagine them as a safety net where buyers step in, preventing further decline.
Resistance Levels: Conversely, resistance levels (red line/shade) are where upward trends might stall due to increased selling interest. They act like a ceiling where sellers come in to push prices down.
Breakouts:
Bullish Breakout: When the price moves above resistance, it often indicates strong buying interest and the potential for a continued uptrend. Traders may view this as a signal to buy or hold.
Bearish Breakout: When the price falls below support, it can signal strong selling interest and the potential for a continued downtrend. Traders might see this as a cue to sell or avoid buying.
MA Ribbon (EMA 20, EMA 50, EMA 100, EMA 200) :
Above EMA: If the stock price is above the EMA, it suggests a potential uptrend or bullish momentum.
Below EMA: If the stock price is below the EMA, it indicates a potential downtrend or bearish momentum.
Trendline: A trendline is a straight line drawn on a chart to represent the general direction of a data point set.
Uptrend Line: Drawn by connecting the lows in an upward trend. Indicates that the price is moving higher over time. Acts as a support level, where prices tend to bounce upward.
Downtrend Line: Drawn by connecting the highs in a downward trend. Indicates that the price is moving lower over time. It acts as a resistance level, where prices tend to drop.
Disclaimer:
I am not a SEBI registered. The information provided here is for learning purposes only and should not be interpreted as financial advice. Consider the broader market context and consult with a qualified financial advisor before making investment decisions.

MRF : Buy Triggered in this week MRF : Buy Triggered in this week
Developed a resistance at 148k
ATH is around 151k
( Not a Buy / Sell Recommendation
Do your own due diligence ,Market is subject to risks, This is my own view and for learning only .)

Arman Financial Services LtdThe stock has been in a long-term consolidation zone, building strong base structure.
Now it's showing signs of breaking out with solid volume, signaling potential shift in momentum.
🧱 Base formation = strength
🔥 Volume spike = interest returning
📈 Breakout here could lead to sustained upside if momentum follows through.
Level to watch:
Not financial advice – just sharing my view.

Looking to buy Vedanta above 475..Looking to buy Vedanta above 475, when it breaks decisively
looking for a final target of 525 and more
total swing trade
very very high probable trade.
keep an eye above 475 levels.

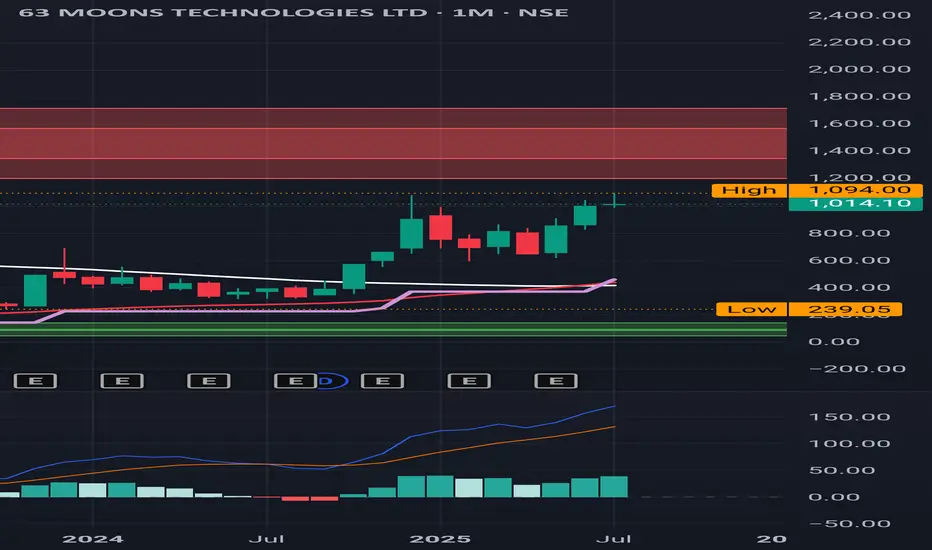
63 Moons : Monthly Time Frame. Red Band Resistance.
63 Moons : Monthly Time Frame. Red Band Resistance.
MACD looks extremely Strong .
( Not a Buy / Sell Recommendation
Do your own due diligence ,Market is subject to risks, This is my own view and for learning only
Looking to buy infosys when the range of 1650 gets broken...looking to buy infosys when the price of 1650 get broken decisively..
it can give good returns,final target oF 1960-1970..
it's a complete swing trade

PAYTM : Monthly Time Frame.Red Band Resistance
PAYTM : Monthly Time Frame. Red Band Resistance.
( Not a Buy / Sell Recommendation
Do your own due diligence ,Market is subject to risks, This is my own view and for learning only .)

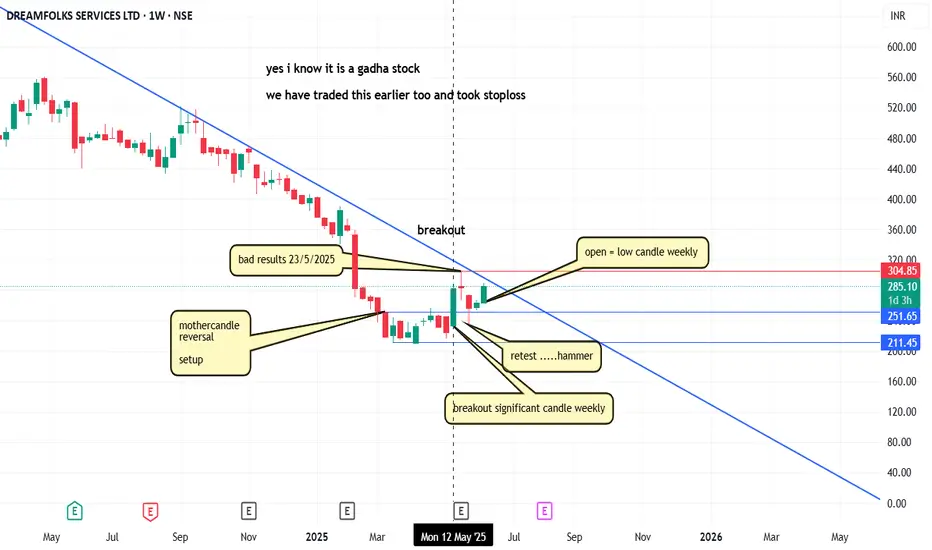
bottom fishing ...DREAMFOLKSTrying to plan a reversal with small risk and may be good reward upside
reading a chart and analysing it i feel it has a good potential on upside with limited downside move ....
i hope chart is well explained...
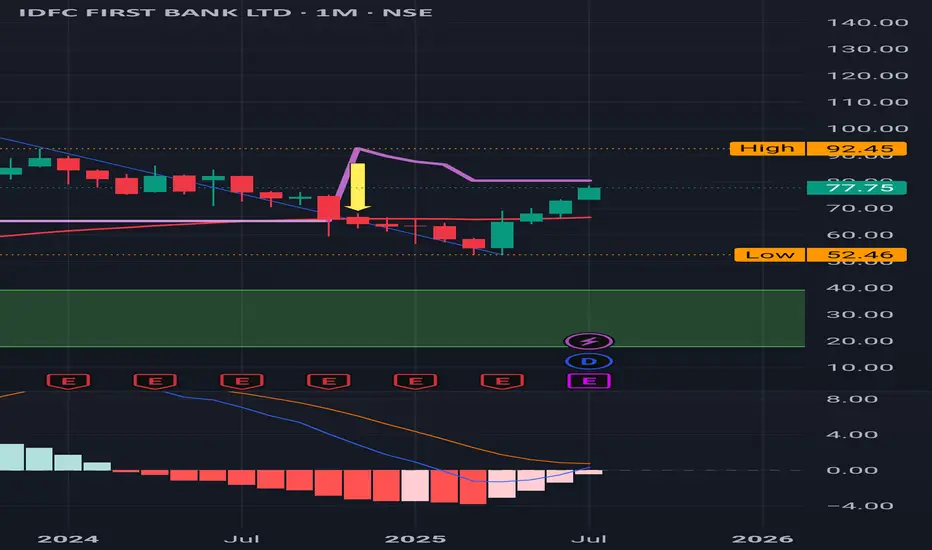
IDFC First: Monthly time frame , on a verge of a Buy Signal.IDFC First: Monthly time frame , on a verge of a Buy Signal. An important Milestone.
No more Red Band Resistances .
Upcoming Important Levels : 86 / 100 .
( Not a Buy / Sell Recommendation
Do your own due diligence ,Market is subject to risks, This is my own view and for learning only .)
Apollo Hospitals – Inverted Head & Shoulders BreakoutChart Pattern: Inverted Head & Shoulders
Timeframe: Daily
Breakout Level: ₹7,565
Target: ₹8,980
Potential Upside: +18.7%
Stop Loss: ₹7,250
Volume: Strong breakout volume confirms institutional activity
RSI: 71 – Momentum strong, no signs of exhaustion or divergence
Technical Thesis:
Apollo Hospitals has completed a multi-month inverted head & shoulders pattern with a breakout above the ₹7,565 neckline zone. The structure developed over 8 months, showing accumulation and basing under resistance. The breakout is supported by the highest volume since Oct 2023 and a clean bullish candle. There is no visible supply zone until the ₹8,800–₹9,000 area, suggesting potential for a swift move.
Trade Plan:
Entry: On breakout above ₹7,565 or on pullback to ₹7,450–₹7,500 (if offered)
Target: ₹8,980 (based on measured move projection)
Stop Loss: ₹7,250 (below neckline and prior range low)
Risk:Reward: ~3.5:1
Disclaimer:
This chart and analysis are intended for educational and informational purposes only. This is not a recommendation to buy, sell, or hold any financial instrument. The views expressed are based on technical patterns and personal interpretation and may not reflect actual market movement. Always do your own research and consult your financial advisor before making any trading decisions. Trading in equities involves risk of capital loss.

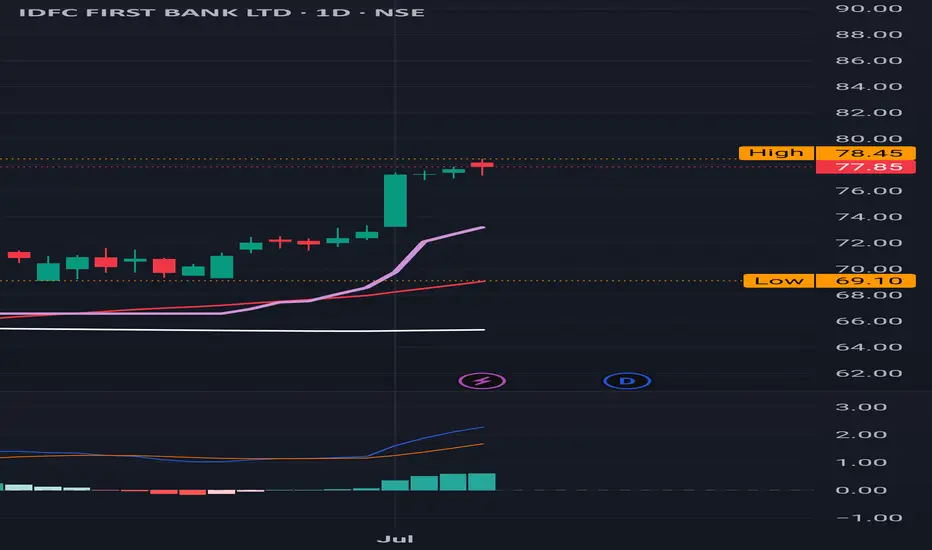
IDFC First: Red Band disappeared, a very important milestone , mIDFC First: Red Band disappeared, a very important milestone , momentum picks up .
Already it's in a Buy trajectory.
There are no more red bands in any time frames anymore ,Daily ,Monthly ,3 Monthly .
Important levels : 86/100
( Not a Buy / Sell Recommendation
Do your own due diligence ,Market is subject to risks, This is my own view and for learning only .)
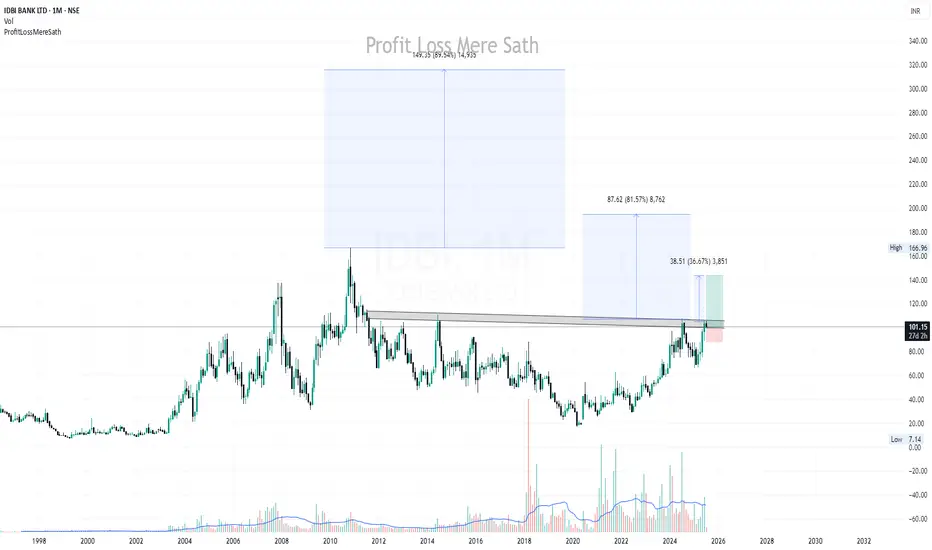
IDBI BANK LTD - for Long-Term🚀 Breakout Alert!
IDBI Bank has finally broken out of a multi-year resistance zone that was acting as a strong supply area since 2010. The breakout is supported by significant volume, indicating strong institutional participation.
🟩 Structure Highlights:
Price has broken above the long-term horizontal resistance trendline (marked in grey).
Monthly candle shows solid strength despite some profit booking from ₹105 levels.
Volume spike suggests buyer confidence.
📈 Potential Upside Targets:
Target 1: ₹140 (≈36.67%)
Target 2: ₹185 (≈81.57%)
Target 3: ₹250+ (≈149.35%) in the longer term, replicating past breakout moves.
📉 Support Zone: ₹88–95 (former resistance turned support). Any retest around this zone can offer good risk-reward entry.
📌 Conclusion:
This breakout marks the end of a decade-long consolidation. As long as the price holds above ₹88 on a monthly closing basis, the uptrend looks intact. Ideal for positional swing traders and long-term investors watching for multi-bagger potential.
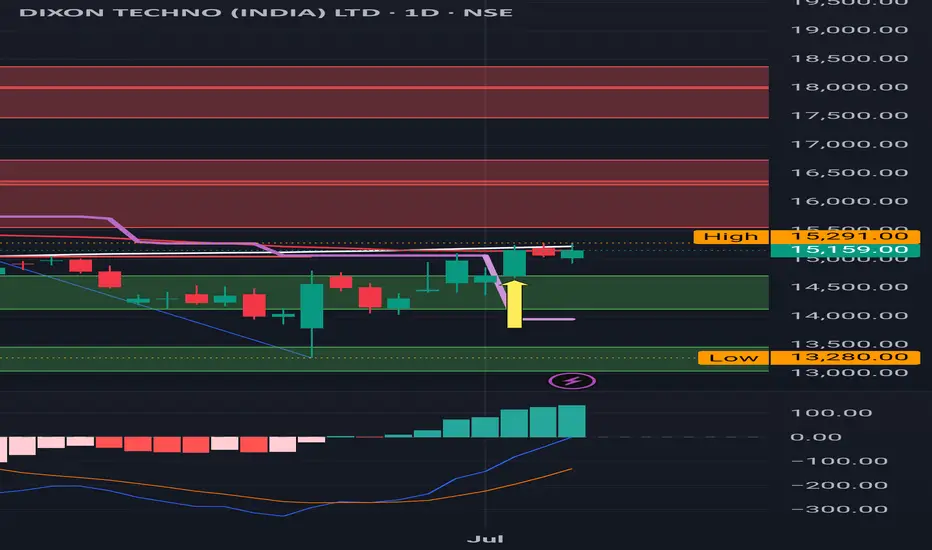
Dixon: Buy triggered, be mindful of a Red Band resistance Dixon: Buy triggered, be mindful of a Red Band resistance .
( Not a Buy / Sell Recommendation
Do your own due diligence ,Market is subject to risks, This is my own view and for learning only .)