HCLTECH | Buy @LTP | SL below 1600 | Target 2100Disclaimer:
This is not financial advice. Please do your own research or consult with a financial advisor before making any investment decisions. Investments in stocks can be risky and may result in loss of capital.

INFY | Buy @LTP | SL below 1525 | Targets 1880, 2000Disclaimer:
This is not financial advice. Please do your own research or consult with a financial advisor before making any investment decisions. Investments in stocks can be risky and may result in loss of capital.

keep in radar Dilip Buildcon for medium termkeep DBL in radar for tgt of 620 & 680. Above 700 can fire

Precision Electronic Long Term TradePrecision Electronic Long term Trade
Buy Price - INR 150 to INR 180
Targets -
T1 - INR 199
T2 -
T3 -
T5 -

INDUSTOWER at Best Support Zone !!This is the 4 hour chart of INDUSTOWER .
INDUSTOWER having good Law of Polarity at 360-370 range.
The stock is forming a Descending Triangle pattern on th L.O.P at 375 range .
If this level is sustain , then we may see higher prices in INDUSTOWER.
Thank You !!


INDIGOPNTS - Bullish view potential of 28 to 45% ROIAll details are given on chart for educational purpose only. If you like the analyses please do share it with your friends, like and follow me for more such interesting charts.
Disc - Am not a SEBI registered analyst. Please do your own analyses before taking position. Details provided on chart is only for educational purposes and not a trading recommendation

MPHASIS at Key Zone !!This is Daily chart of MPHASIS.
MPHASIS having a good law of polarity at 2700-2720 range.
If MPHASIS gives a breakout, the potential upside targets are 2,840 and 3,000 levels.
If L.O.P is sustain then , we may see lower prices in MPHASIS.
Thank You !!

MTARTECHMTARTECH has given strong breakout.. Potential Target can be seen 1700, 1750, 1780, 1800 in a few weeks. Almost 37% down from All time High keep an eye could be a Milky stock.

MRPLMRPL
Buy above 154 (Wait atleat to break the consolidation range)
Target: 160, 265, 270 above 270 price can be seen around 200
Time Frame: Within Few days

SWANENERGYSWANENERGY
Support Range broken after a long consolidation with good volume, Poised for upward move, Target can be expected 500. 530, 550, 570 in a few weeks.
Stop Loss: 455
Note: For Long position maker, it is opportunity for you to grab this stock at the movement and wait for 600, 700, 800 in few month.
Happy Investing :)

RELTDA good Bullish Pattern forming in weekly chart pattern, Taken support around 142-143 now trading at 153, Looking good for next milestone 155, 160, 165, 170, 200
Timeframe: Within few Weeks.
Stoploss: Rs. 140

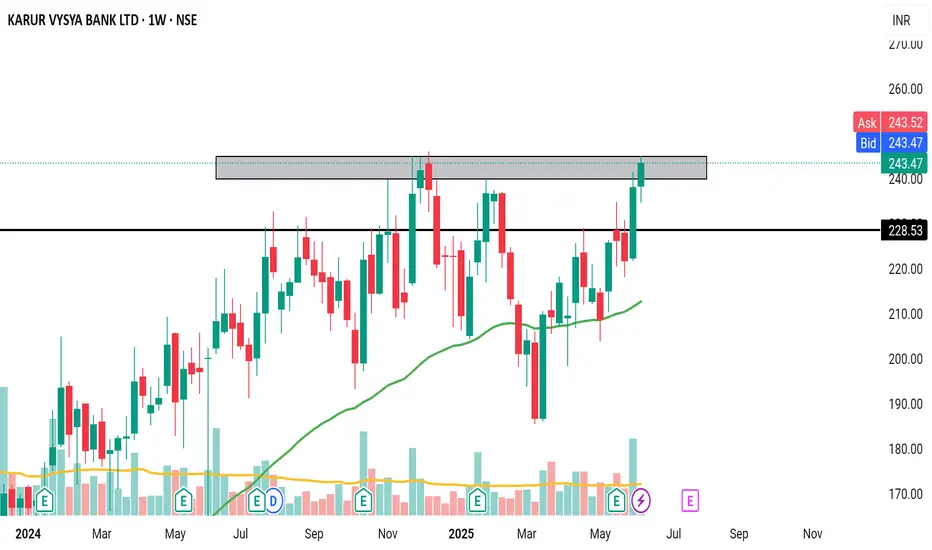
Karur ko watchlist mein rakhna jaroorOn the verge of breaking all time high. Good fundamentals, good volumes.
OFSSOFSS
watch above levels. green line is our entry, redline is our SL.
DISCLAIMER : I am NOT a SEBI registered advisor or a financial adviser. All the views are for educational purpose only.

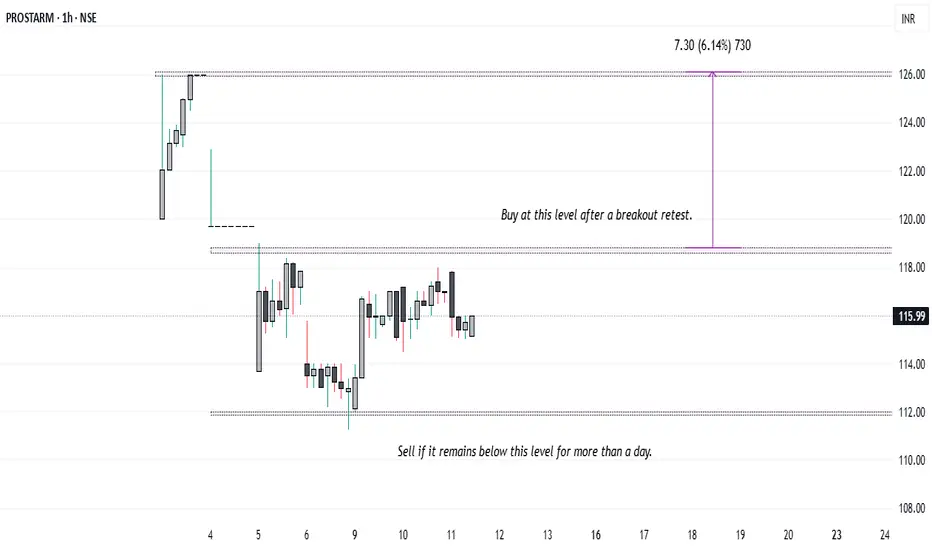
Prostarm Microfinance Ltd: Investment Update Buy, Sell, OR Hold Technical Outlook: Prostar Microfinance Ltd.
Current Market Structure:
Prostar Microfinance Ltd. is presently consolidating within a narrow trading range between ₹112 and ₹118. This range-bound movement indicates indecision in the market, with neither bulls nor bears taking full control at this stage.
Scenario-Based Strategic Guidance
1. Existing Shareholders (Including IPO Allottees):
Investors already holding shares—especially those allotted during the IPO—are advised to continue holding their positions while the stock remains above the key support level of ₹112. However, if the stock breaches this level on a daily close basis and sustains below ₹112 on the following trading session, it would signal a breakdown of the current support zone. In such a case, we recommend exiting the position and waiting for technical stabilization or a new bullish setup.
2. Prospective Buyers (No Current Holdings):
Investors looking to enter fresh positions should adopt a wait-and-watch approach until a clear breakout above ₹118 is observed. A breakout accompanied by significant volume and a confirmed close above ₹118 could offer a potential buying opportunity, with a near-term price target of ₹126.
3. Risk Monitoring:
A sustained move below ₹112 could open the downside toward the ₹105–₹100 levels. Hence, strict stop-loss discipline is crucial, especially for short-term traders and technical participants.
Summary :
| Scenario Action Plan
-------------------------- --------------------------------------------------
| Holding from IPO Hold above ₹112; exit if closes below and sustains
| No Holdings Buy only after a breakout and close above ₹118
| Post-Breakout First Target ₹126
Disclaimer: This is a technical outlook and should not be construed as investment advice. Investors are advised to consider their risk appetite, broader market conditions, and consult financial advisors before making investment decisions.
GAIL 1H Chart Analysis (Trendline Breakout Setup)NSE:GAIL GAIL 1H Chart Analysis (Trendline Breakout Setup)
The 1-hour chart of GAIL (India) Ltd shows a clean descending trendline breakout followed by higher lows, indicating strength building up. The price is consolidating just below a horizontal resistance around ₹193, forming a potential ascending triangle pattern.
Trendline Breakout:
Price has broken a long-standing descending trendline.
Retest and higher lows have followed the breakout, showing bullish intent.
Ascending Triangle Pattern:
Horizontal resistance near ₹193 is tested multiple times.
Rising trendline support suggests buyers are becoming aggressive.
Volume Confirmation Needed:
A breakout above ₹193.10 with volume would validate the bullish setup.
Trade Setup:
Buy Entry: Above ₹193.10 (confirmed breakout
Stop Loss: Below ₹190.00 (below rising trendline) CLOSING BASIS
Target 1: ₹196.85 (resistance zone)
Target 2: ₹204.50 (swing high)
The combination of trendline breakout and ascending triangle formation indicates a strong bullish continuation setup. Entry above ₹193.10 is ideal after confirmation, with targets up to ₹204 and risk well-managed below ₹190.
Disclaimer: I am not a SEBI-registered advisor. The analysis shared is purely for educational and informational purposes only. Please consult your financial advisor before making any investment or trading decision. Trading and investing in the stock market involves financial risk. The author will not be held responsible for any losses incurred.
@thetradeforecast
NSE:GAIL NSE:NIFTY

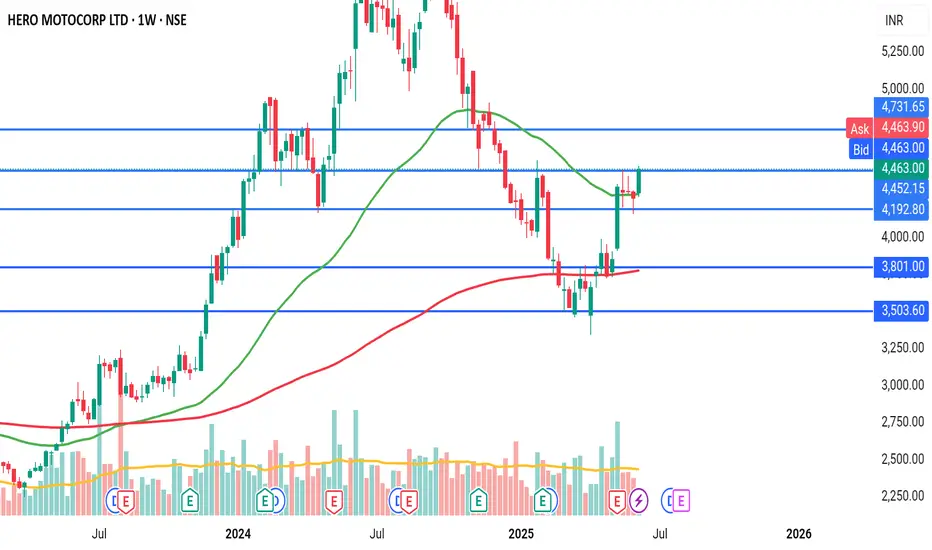
Hero starts heroingBreakout of inverted head and shoulder pattern in weekly timeframe, with big green candle and above average volume.
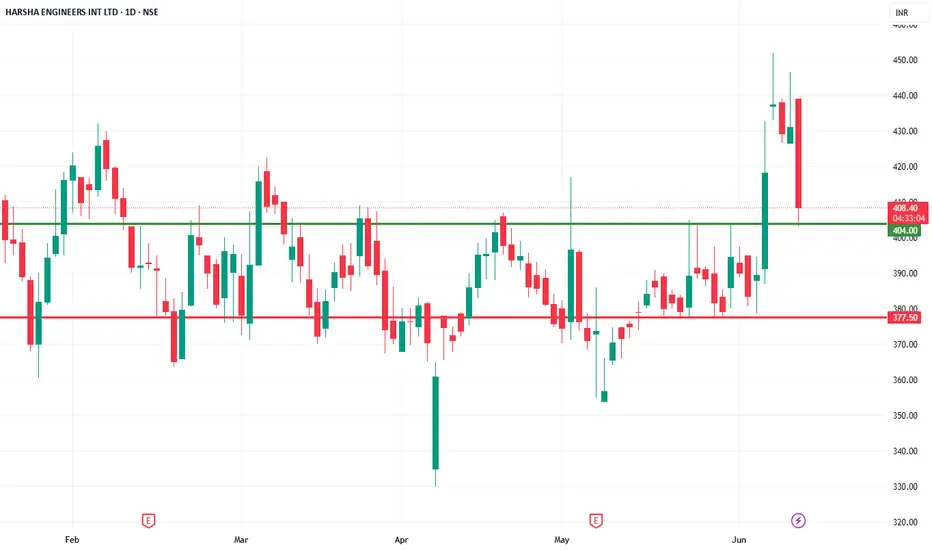
HARSHAHARSHA
watch above levels. green line is our entry, redline is our SL.
DISCLAIMER : I am NOT a SEBI registered advisor or a financial adviser. All the views are for educational purpose only.
Time to pour coffee in the cupBreakout of cup and handle pattern with huge green candles and great volume on monthly timeframe. Breakout in monthly timeframe assures the sustainability post breakout.


UPCOMING STRONGEST RALLY IN HEROMOT 1)Hero motor made INV H&S , and broken out of neckline 4430.
2)also currently running in wave 3 .. one of the strongest
3)Broken out from correction pattern FLAG
Immediate TGT comes at 4772 ,
T2 = 5150
T3 = 6050

SWANENERGY LONG TERM ANALYSISThanks for stopping by.
All analysis here is done strictly from an investor’s perspective — focusing on risk, return, valuation, and potential upside.
The notes cover key details. I’ve backed every thesis with my own analysis — no fluff, just what matters to investors.
If you find the idea useful or have suggestions, feel free to leave a comment. Always open to fresh insights.
Kind regards,
Psycho Trader

OIL - LONG TERM ANALYSISThanks for stopping by.
All analysis here is done strictly from an investor’s perspective — focusing on risk, return, valuation, and potential upside.
The notes cover key details. I’ve backed every thesis with my own analysis — no fluff, just what matters to investors.
If you find the idea useful or have suggestions, feel free to leave a comment. Always open to fresh insights.
Kind regards,
Psycho Trader
