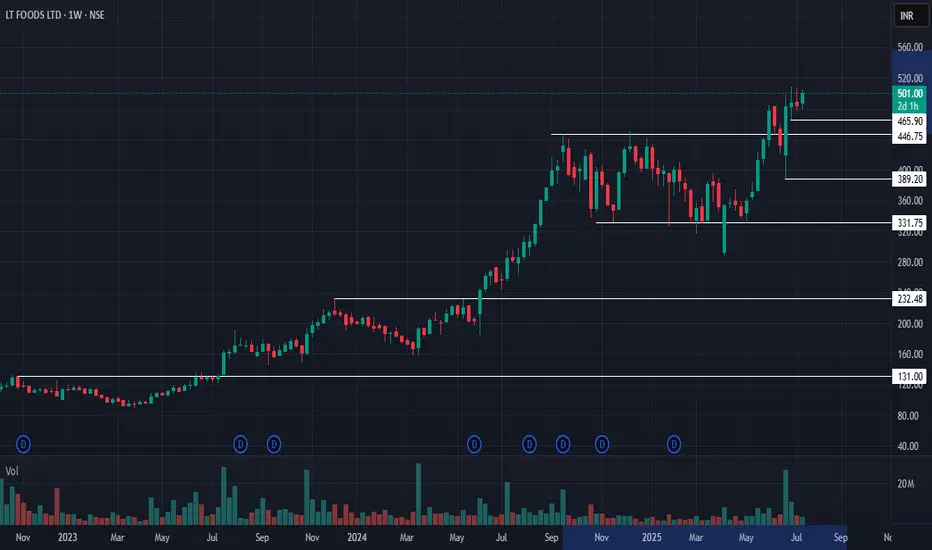
LT Foods: Ready for the Next Rally?🚀 LT Foods: Ready for the Next Rally? 🚀
📉 CMP: ₹502
🔒 Stop Loss: ₹460
🎯 Targets: ₹550 | ₹590
🔍 Why LT Foods Looks Promising?
✅ Big Base Breakout: Strong structural breakout with successful retest
✅ All-Time High Zone: Stock is hovering at its all-time high, indicating strength
✅ Double Doji Weekly Breakout: Preempting a breakout after a double doji weekly formation—a powerful continuation signal
💡 Strategy & Risk Management:
📈 Staggered Entry: Accumulate in phases to navigate volatility effectively
🔒 Strict SL: Maintain stop loss at ₹460 to protect capital in case of reversal
📍 Outlook: LT Foods is exhibiting strong bullish momentum with technical confirmations aligning for the next leg up.
📉 Disclaimer: Not SEBI-registered. Please do your own research or consult a financial advisor before investing.
#LTFoods #BreakoutStocks #TechnicalAnalysis #SwingTrading #StockMarketIndia #InvestSmart
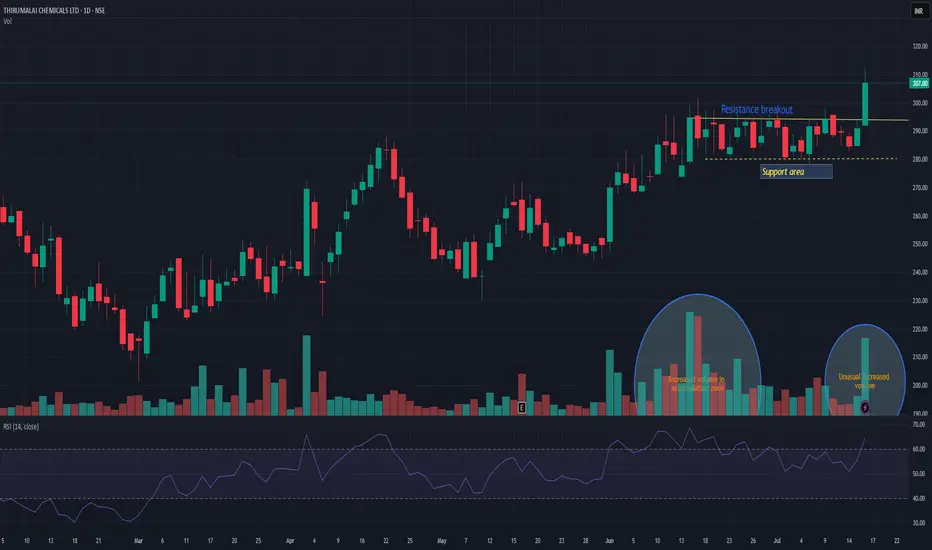
TIRUMALCHMTIRUMALCHM has given resistance breakout with decent volume. Another good thing is unusual volume increased in accumulation zone. Support can be seen near 280 levels. There is high probability that this time it may push the stock in to trend change and may take momentum to the next level. Keep it on radar.
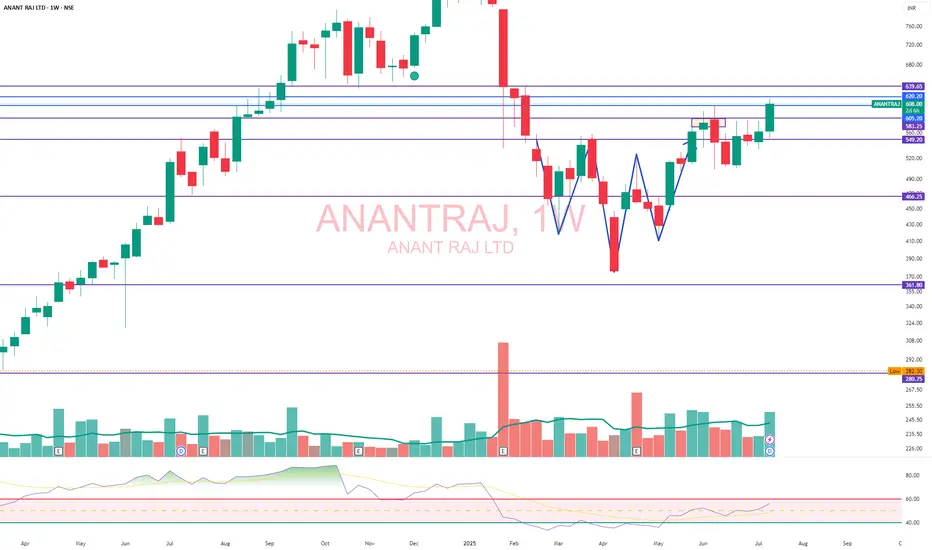
ANANTRAJAnantRaj a data center Gem: Watch above 620.. Ready to move 640, 650, 660 in few days.. RSI is shifting in upper direction.. Stock is moving with trendline..
CAMS Long_Support at 20 DEMA_Hidden Bullish DivergenceCAMS Long:
- Price takes support at 20 DEMA
- Hidden bullish Divergence
- First time price tests 50/ 20 DEMA after Golden Crossover
- Enter Long when the price is favorable in lower timeframe
- SL: close below 20 DEMA

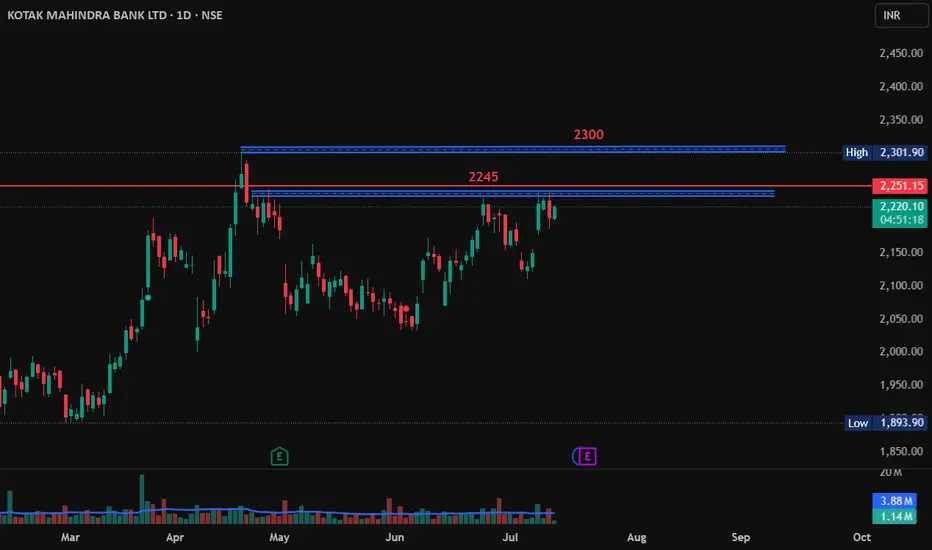
Kotak Mahindra Bank Long Positional ViewKotak Mahindra Bank is breaks 2245 and close above 2250 then it may go long till 2300 from here.
Buy above 2250
Target 2300
SL - 2230
Review and pln for 16th July 2025Nifty future and banknifty future analysis and intraday plan.
This video is for information/education purpose only. you are 100% responsible for any actions you take by reading/viewing this post.
please consult your financial advisor before taking any action.
----Vinaykumar hiremath, CMT

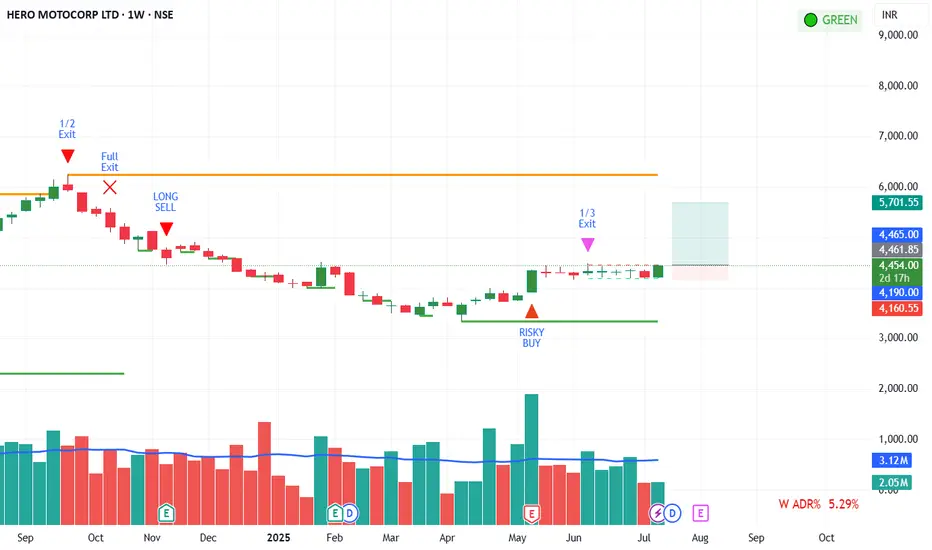
HERO MOTOCORP LTD looks Good HERO MOTOCORP LTD our Private indicator give signal earlier few weeks ago. Now it seems looks more constractive, and can be Take position stoploss according to chart.
Poonawalla Fincorp BuyPoonawalla Fincorp seems to take support at trend line. Buy @CMP (455) with SL of 445 and Target of 475 & 500.

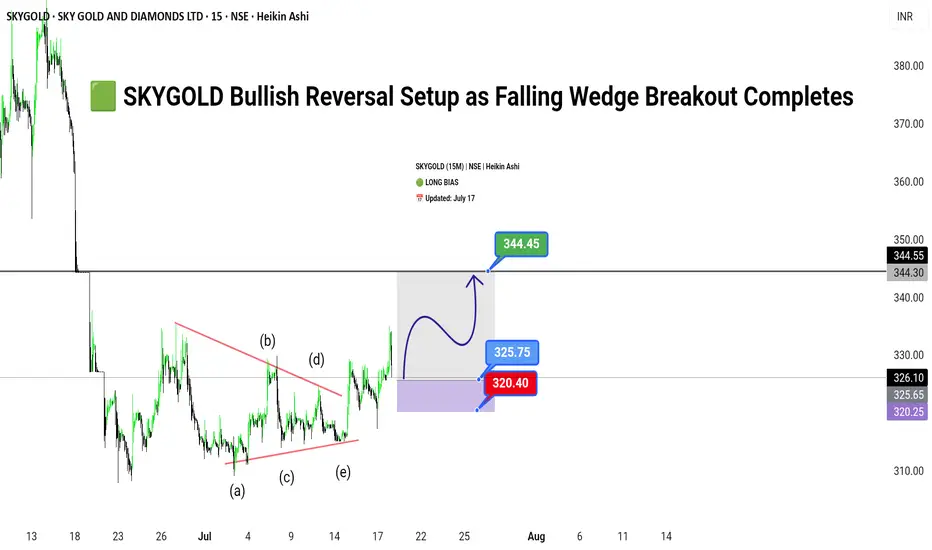
SKYGOLD Bullish Reversal Setup as Falling Wedge Breakout Complet🟩
SKYGOLD (15M) | NSE | Heikin Ashi
🟢 LONG BIAS
📅 Updated: July 17
---
🔍 Description
SKYGOLD has emerged from a prolonged corrective phase, breaking out of a well-defined falling wedge pattern on the 15-minute chart. The price action has respected a clean Elliott Wave ABCDE structure within the wedge, suggesting a completed consolidation cycle. With bullish momentum building above ₹325, the stock now appears poised for a breakout rally towards ₹344.45.
This setup reflects both a technical breakout and possible short-covering rally, making it an attractive opportunity for short-term swing traders. However, risk remains below the ₹320.40 zone, which invalidates the breakout structure if breached.
---
📊 Technical Structure (15M)
✅ Breakout above wedge resistance
✅ ABCDE wave structure complete (classic consolidation)
✅ Impulse targets in sight
📌 Upside Targets
First: ₹325.75
Final: ₹344.45
🔻 Risk Zone
Below: ₹320.40 (Breakdown invalidates setup)
---
📈 Fundamental/Flow Highlights
Sector Sentiment: Positive traction in mid-cap jewellery and gems segment.
Volume Spike: Notable rise in volume on breakout candle.
Short-Covering Potential: Highly likely due to prolonged consolidation.
---
⚠️ Risks to Watch
Sudden broad market correction in Nifty Midcap segment.
Lack of follow-through volume post-breakout.
Intraday rejection near ₹344 zone (previous supply).
---
🧭 Summary: Bias and Watchpoints
SKYGOLD is bullish above ₹325 with a breakout structure favoring continued upside toward ₹344.45. As long as the price holds above ₹320.40, the long thesis remains valid. Watch volume confirmation, and use trailing SL to lock gains.
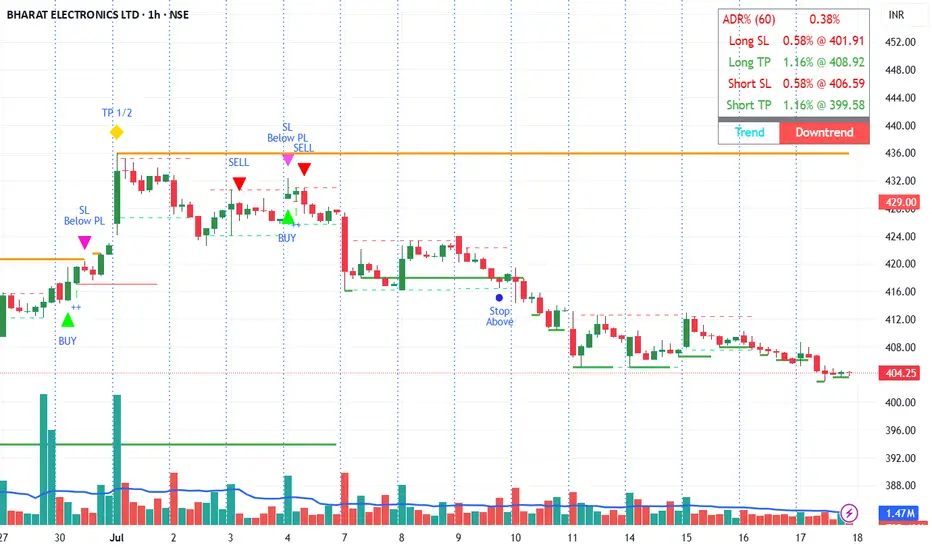
Recent trades on BHARAT ELECTRONICS LTDBHARAT ELECTRONICS LTD, Signal auto-generated by our Private Indicator, Serious traders can contact us for information.
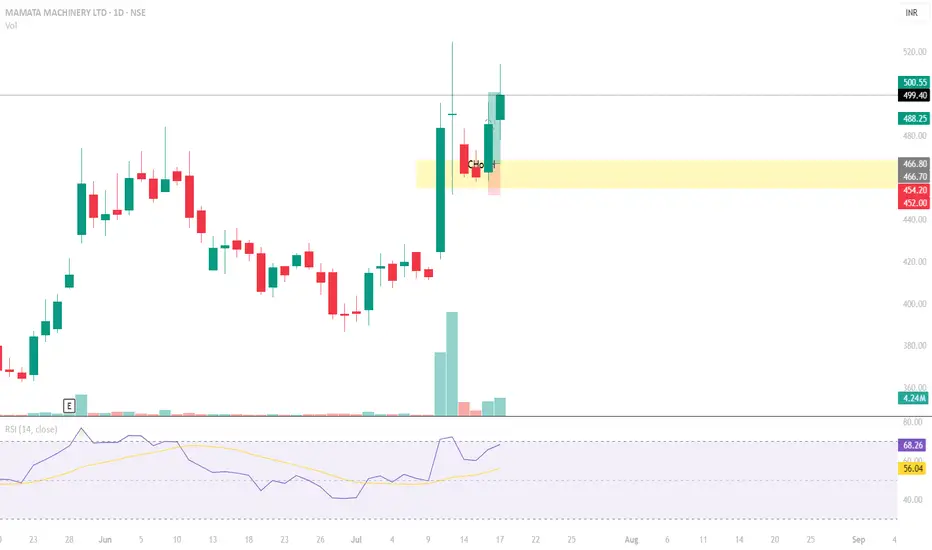
MAMATA MACHINERYTP HIT !!!
Had taken this stock at golden zone of fibnoacci retracement and had targeted the last high.
Although i closed all my positions at 1st TGT, the stock did hit my TP
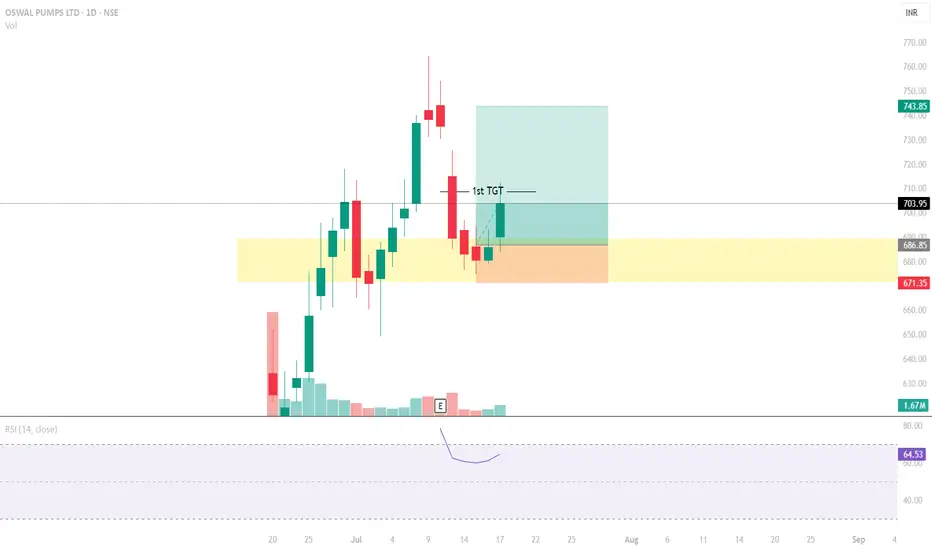
OSWAL PUMPSBased on my earlier prediction, the stock moved in my favour.
Also, i have exited all my positions at 1st TGT level
Review and plan for 18th July 2025Nifty future and banknifty future analysis and intraday plan.
Analysis of quarterly results.
This video is for information/education purpose only. you are 100% responsible for any actions you take by reading/viewing this post.
please consult your financial advisor before taking any action.
----Vinaykumar hiremath, CMT

LOOKS BULLISHMoving Averages (Simple & Exponential): All signals (from 5‑day to 200‑day) in both SMA & EMA suggest strong BUY .
Trend Oscillators:
MACD: Bullish with positive value ~134 .
ADX/DMI: ADX ~23 indicates weak trend, but DMI+ (32.8) > DMI– (14.8), signalling a bullish bias .
Momentum Oscillators:
RSI (~75), Stochastic K/D (~85/71), and Stochastic RSI K/D (~100/81) all in overbought territory.
CCI (~195), PSAR (~14,150) and Momentum (~4,343) are bullish.
However, True Range (~1,071) and ATR (~647) show heightened volatility—coded as SELL signals Technical Summary (May): ~83% of indicators were BUY signals, with 7% SELL, and 10% NEUTRAL

Axis Bank BuyAxis Bank trading in range. Currently it is near the bottom of the range. Buy @CMP (1165) with SL of 1140 (6 points below previous low of the range. Price may make new low before going up) and target of 1200 & 1235.

Gan Fan analysis of InfyGan Fan Line for infy the Gan Fan analysis for the infy has become so much important at this stage to make a long term decision watch the video till end


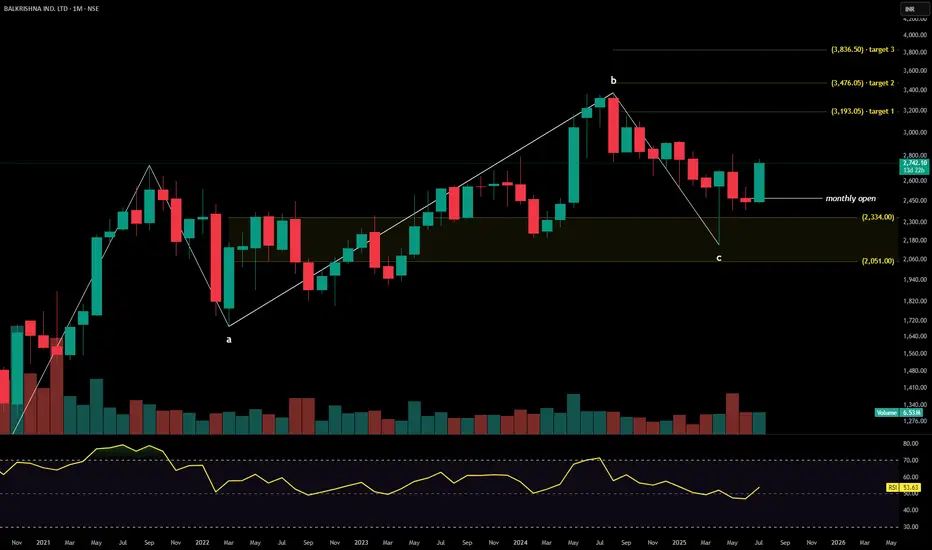
BALKRISHNA INDUSTRIESBalkrishna Industries Ltd. is a global manufacturer of off-highway tires, serving sectors such as agriculture, construction, mining, industrial, and forestry. With a premium export-led product mix and deep global penetration, the company continues to scale operations through automation, brand partnerships, and diversified geographic strategies. The stock is currently trading at ₹2,742.10.
Balkrishna Industries Ltd. – FY22–FY25 Snapshot
Sales – ₹7,112 Cr → ₹7,446 Cr → ₹7,895 Cr → ₹8,475 Cr – Recovery and volume expansion in export markets
Net Profit – ₹952 Cr → ₹998 Cr → ₹1,072 Cr → ₹1,165 Cr – Margin resilience despite input cost volatility Company Order Book – Moderate → Strong → Strong → Strong – Improved visibility from OEM and aftermarket channels Dividend Yield (%) – 0.88% → 0.91% → 0.95% → 1.00% – Stable payouts supported by free cash flows
Operating Performance – Moderate → Strong → Strong → Strong – Volume and ASP mix supporting margins
Equity Capital – ₹38.66 Cr (constant) – Efficient capital structure
Total Debt – ₹260 Cr → ₹245 Cr → ₹229 Cr → ₹210 Cr – Conservative leverage, improving coverage
Total Liabilities – ₹2,460 Cr → ₹2,530 Cr → ₹2,595 Cr → ₹2,660 Cr – Stable expansion with operating scale
Fixed Assets – ₹1,470 Cr → ₹1,525 Cr → ₹1,580 Cr → ₹1,635 Cr – Strategic capex on automation and green initiatives
Latest Highlights FY25 net profit rose 8.7% YoY to ₹1,165 Cr; revenue increased 7.3% to ₹8,475 Cr EPS: ₹60.13 | EBITDA Margin: 25.4% | Net Margin: 13.74% Return on Equity: 19.42% | Return on Assets: 11.95% Promoter holding: 58.30% | Dividend Yield: 1.00% Growth in U.S. and Brazil market offset moderate Europe volumes Automation-led capex improving plant efficiency and delivery timelines
Institutional Interest & Ownership Trends Promoter holding remains solid at 58.30% with no pledging or dilution. FIIs have maintained positions with marginal increases, while DIIs have held steady. Recent delivery volume trends indicate quiet accumulation among institutions focused on export-driven and specialty manufacturing narratives.
Business Growth Verdict Yes, Balkrishna Industries continues to build scale and resilience Margins remain firm across markets despite volatility Debt and liability management reflect financial discipline Capex strategies align with operational efficiency and environmental goals
Company Guidance Management expects continued expansion in export markets and steady profitability, with emphasis on improving automation and sustainability across manufacturing processes.
Final Investment Verdict Balkrishna Industries Ltd. stands out as a consistent performer in India’s specialty manufacturing space. Its global footprint, strong cash flows, efficient capital deployment, and resilience across market cycles position the company well for long-term value creation. Continued operational leverage and conservative financial practices make it suitable for accumulation by investors seeking industrial exposure with stable returns.
Good bullish signOn weekly tf, previous ath broken and trying to sustain. And if it breaks 15 mins tf with better volume, it may go up. This is only for educational purposes. Do your own analysis and do trade
VRL LogisticsVRL Logistics has broken out of a year-long base above ₹610 with strong volume and bullish momentum. Price is above key moving averages, signaling a fresh uptrend

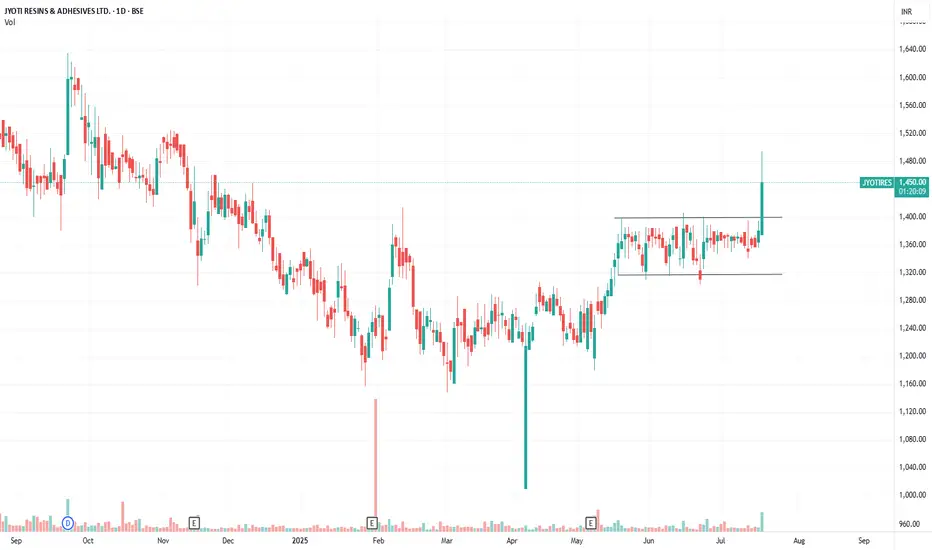
Watch out for the box breakout in Jyoti ResinWatch out for the box breakout in Jyoti Resin. Crude price is in control. As the consumption demand improves, this stock will run up. For this it will take 4-6 months. But one has to enter in lower levels to capture full move.
Time techno⏱️ Time Technoplast – Building Strength!
Clean technical setup, solid volume, and eyes on higher zones.
Positional traders, stay tuned ! 📈🚀
