TECHNOCRAFT is good to buy around 2876TECHNOCRAFT is in momentum now, on 15 min candle it shows buying indication around 2876,
if days momentum is posisitve then we will think to buy around that level otherwise we will watch it only.

AARTI DRUGS at Best Support !!This is the Weekly chart of AARTI DRUGS.
AARTI DRUGS having good law of polarity at 425-440 range.
If this level is sustain then we may see higher prices in AARTI DRUGS.
Thank You !!

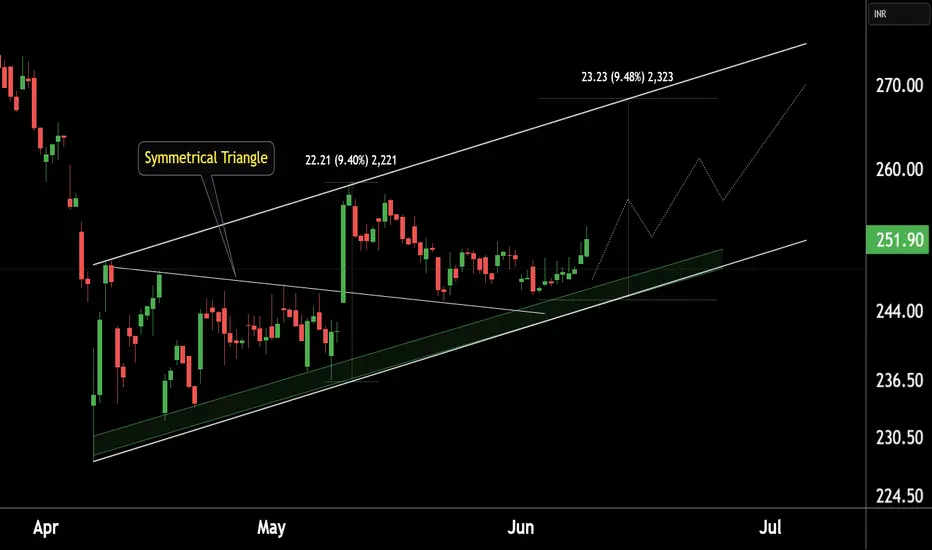
WIPRO at Best Support !!This is the 4 hour chart of Wipro ltd.
WIPRO has a strong support zone in the 245–248 range.
WIPRO is forming a symmetrical triangle pattern, with a potential target of 268, which also aligns with the channel's resistance zone at 268-270."
If this level is sustain , we may see higher prices in Wipro !!
Thank You
Positional Setup for Laurus LabsCMP: ₹667.35
Breakout Level: ₹657–660 (now turned support)
Support Zones: ₹657, ₹618
Resistance Levels (next targets): ₹705–710, ₹735
Indicators:
Supertrend: ✅ Bullish
TEMA 5-9-20: ✅ Trending up
Volume/Price Action: Strong bullish candle post consolidation
📈 Technical View (Positional)
Laurus Labs has broken out above ₹657 resistance with strong momentum, closing near day’s high.
The chart shows a previous consolidation box (highlighted) followed by trend continuation—classic breakout setup.
Positional structure is bullish, with price holding above key moving averages.
🚀 Positional Targets:
Target 1: ₹705
Target 2: ₹735
SL (Closing Basis): ₹638

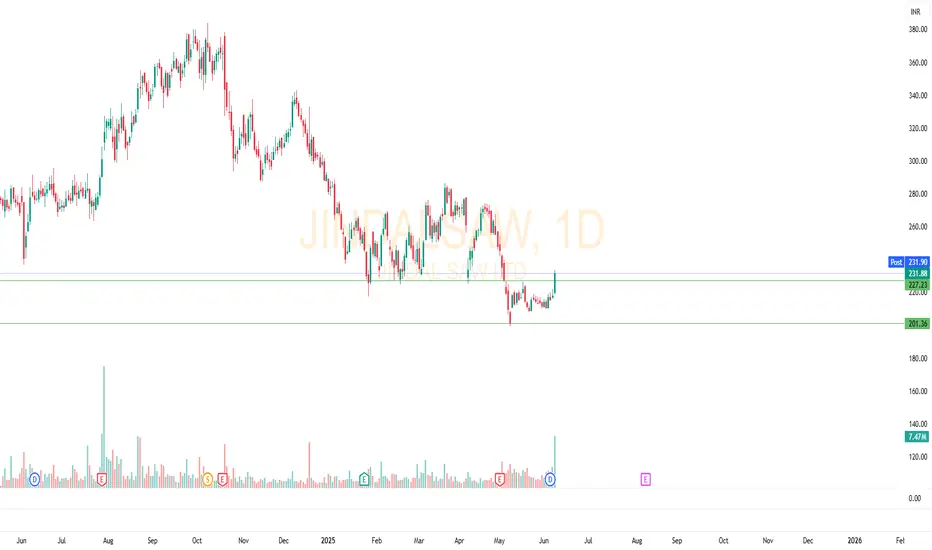
JINDAL SAW | Breakout from Base – Trend Reversal in Play?Jindal Saw Ltd has shown a strong bounce from the ₹200–₹202 support zone after multiple tests. Today’s breakout candle above ₹227 is accompanied by higher volume, indicating potential trend reversal.
🔹 Previous structure: Prolonged downtrend
🔹 Structure shift: Higher low formed, followed by a breakout
🔹 Immediate Resistance: ₹240–₹245
🔹 If sustains above ₹227, move toward ₹260–₹280 possible in coming weeks
RSI also crossed 50 mark with momentum, supporting bullish sentiment.
🔎 Trade Setup (for study only):
• Entry: ₹231.90
• SL: ₹220 (below previous swing)
• Target 1: ₹245
• Target 2: ₹260
Disclaimer:
This analysis is for educational purposes only. This is not investment advice. Please consult with a financial advisor before making any trading decisions. Always do your own research.
SKIPPER IS LOOKING TO BOUNCERelative Strength looks poised to breakout. Stock has been consolidating after a good run, looking to take the lead again. Some good candles coming in today along with strong volume. Bullish Engulfing candles are always a sight for the sore eyes. Will be eyeing this closely over the next few months.

VEDANTA LTD KEY ZONE..This is the 1 hour chart of VEDL.
VEDL is currently trading near its pattern (Broadening) resistance zone in the 462–465 range.
The stock is trading with in a channel, with its support zone in the 440–445 and resistance zone 485-495 range on the hourly chart.
If this level is sustain,we may see higher prices in VEDL
If VEDL breaks below its support zone, we may see lower levels around 415-405 range .
THANK YOU !!

SKIPPER BULLISH FLAG FORMEDThere is a Bullish Flag formed and near the breakout. If breakout happens, we can see 20% upside move.

naharpoly looks good on chartlooks good to take trade on wait for eod to enter and target are high upto 900 do your own research before entering any trade.


BALUFORGE ANALYSISThanks for stopping by.
All analysis here is done strictly from an investor’s perspective — focusing on risk, return, valuation, and potential upside.
The notes cover key details. I’ve backed every thesis with my own analysis — no fluff, just what matters to investors.
If you find the idea useful or have suggestions, feel free to leave a comment. Always open to fresh insights.
Kind regards,
Psycho Trader

MAN INDUSTRIES - Can have a LONG StoryAmazing results , bags new orders , also broke the resistance now on support. good for investing till the higher line price

Positional Setup for ABSLAMC (Aditya Birla Sun Life AMC)Positional Setup for ABSLAMC (Aditya Birla Sun Life AMC)
Current Price: ₹815.05
Resistance Levels: ₹860.05 → ₹901.40
Support Level: ₹786.20
Indicators: 5-9-20 EMA TEMA & Supertrend (Buy)
Breakout Observed: Strong upward move post consolidation
Volume Confirmation: Needed (check OBV or breakout candle volume)
📈 Technical View (Positional)
The stock has broken out of a resistance zone with strong momentum.
Currently trading above major EMAs and Supertrend in Buy mode.
If it sustains above ₹786–790, the next target zones are:
🎯 ₹860 (minor resistance)
🎯 ₹900–910 (major resistance zone / swing high)
Keep a positional SL below ₹760 for swing traders.

BALUFORGE ANALYSISThanks for stopping by.
All analysis here is done strictly from an investor’s perspective — focusing on risk, return, valuation, and potential upside.
The notes cover key details. I’ve backed every thesis with my own analysis — no fluff, just what matters to investors.
If you find the idea useful or have suggestions, feel free to leave a comment. Always open to fresh insights.
Kind regards,
Psycho Trader

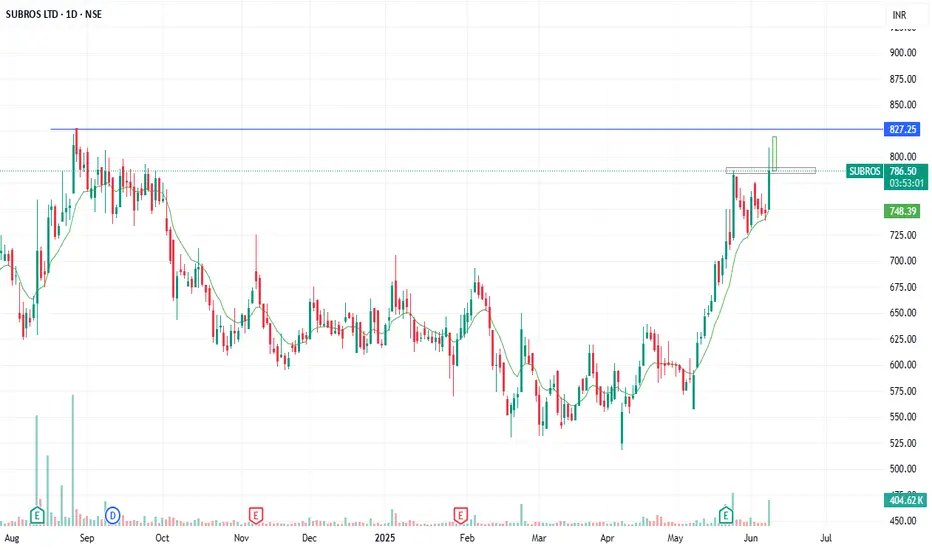
Let's see this candle will come or not in subrosLet's see this candle will come or not in subros
the stock is ready for a great breakout
NHPC INVERSE HEAD AND SHOULDER BREAKOUTInverse Head and shoulder at NHPC ABOVE Neckline
Now target is 110

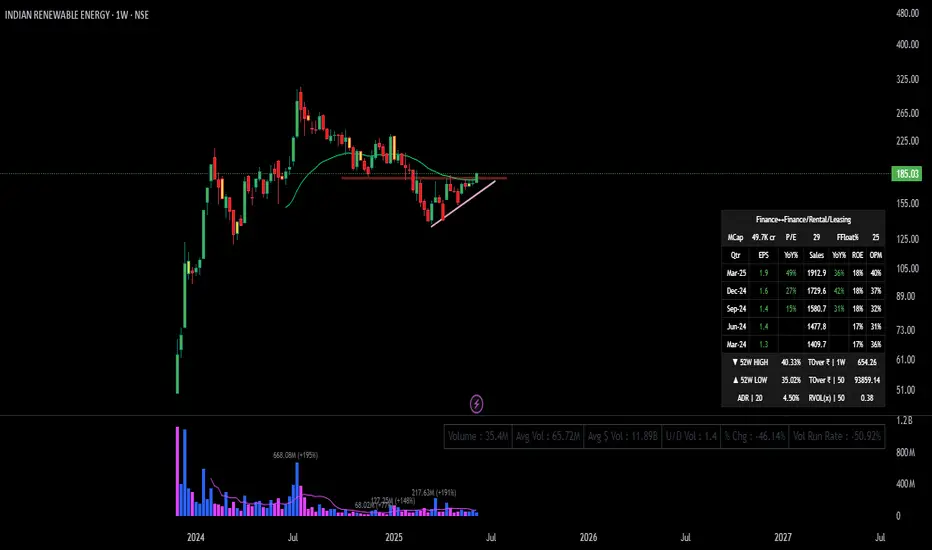
From Accumulation to Acceleration: IREDA Ready for a Run?Indian Renewable Energy Development Agency Ltd. is a non-banking financial company, which engages in the promotion, development, and extending financial assistance for energy conservation projects. It operates through the Financing Activities in the Renewable Energy and Energy Efficiency Sector and Generation of Power through Solar Plant Operations segments. The company was founded on March 11, 1987 and is headquartered in New Delhi, India.
IREDA remains well-positioned in the renewable-financing ecosystem, with strong fundamentals and proactive growth capital raising. Continued loan book expansion, robust profitability, and regulatory backing reinforce strategic upside, despite near-term dilution and credit vigilance.
📊 Technical Analysis
🔸 Chart Pattern: Ascending Triangle
Base Support Zone: Around ₹145–₹150.
Higher Lows Formation: Indicates accumulation.
Resistance: ₹180–₹185 (currently testing).
Volume: Drying up during consolidation – a bullish sign per Minervini/Boik for potential breakout.
Moving Average: Price hovering near or reclaiming 30-week MA (Weinstein Stage 1 to Stage 2 transition).
📌 Stan Weinstein – Stage Analysis
Stage: Transition from Stage 1 (base) to potential Stage 2 breakout.
Needs strong volume breakout above ₹185–₹190 for confirmation.
📌 Anna Coulling – Volume Price Analysis (VPA)
Volume Decline on pullbacks confirms no aggressive selling.
Watch for volume spike + wide range candle above ₹185 to confirm buyer dominance.
📌 Mark Minervini – SEPA Criteria
Consolidation: 5-month tightening range.
Relative Strength: Bouncing back while broader markets corrected.
Trigger Entry: ₹180–₹186 (pivot point), with SL below ₹169.
📌 William O’Neil – CANSLIM Style
C: Current Earnings – Q4 EPS ₹1.9 (+49% YoY) ✅
A: Annual Earnings – consistent growth trend ✅
N: New – Transitioning sector, renewed momentum in green energy 🟡
S: Supply/Demand – Low float (25%), positive U/D volume ratio ✅
L: Leader – Improving performance, but not sector leader yet 🟡
I: Institutional Demand – Improving but needs volume surge ✅
M: Market – Tailwind from green energy and power reforms ✅
✅ Strengths:
High and rising Operating Margins (40%)
Growing Sales and EPS
Decent ROE (18%)
Small float stock – prone to sharp moves.
⚠️ Watchlist Risks:
Price still below previous highs – needs breakout confirmation.
Low volume participation recently.
🎯 Recommendation
📌 Action Plan:
NSE:IREDA Buy Above ₹180–₹185 with volume confirmation.
Target 1: ₹230
Target 2: ₹265
Stoploss: ₹169 (below triangle base)
📝 Summary
Indian Renewable Energy is on the verge of a technical breakout after a prolonged base. Supported by improving fundamentals, bullish volume structure, and classic accumulation patterns, it aligns well with the strategies of Weinstein, Minervini, and O'Neil. A breakout above ₹180–₹185 on volume will confirm a fresh rally phase.
hindcopperHindustan Copper approaching a "Do or Die" zone near ₹261—confluence of resistance & falling trendline.
Bounce from 0.618 Fib at ₹201 strong.
Watch for breakout with volume — targets ₹319 / ₹415 possible.
RSI nearing overbought; short-term caution.


SWIGGYSWIGGY
watch above levels. green line is our entry, redline is our SL. current level also good.
DISCLAIMER : I am NOT a SEBI registered advisor or a financial adviser. All the views are for educational purpose only.

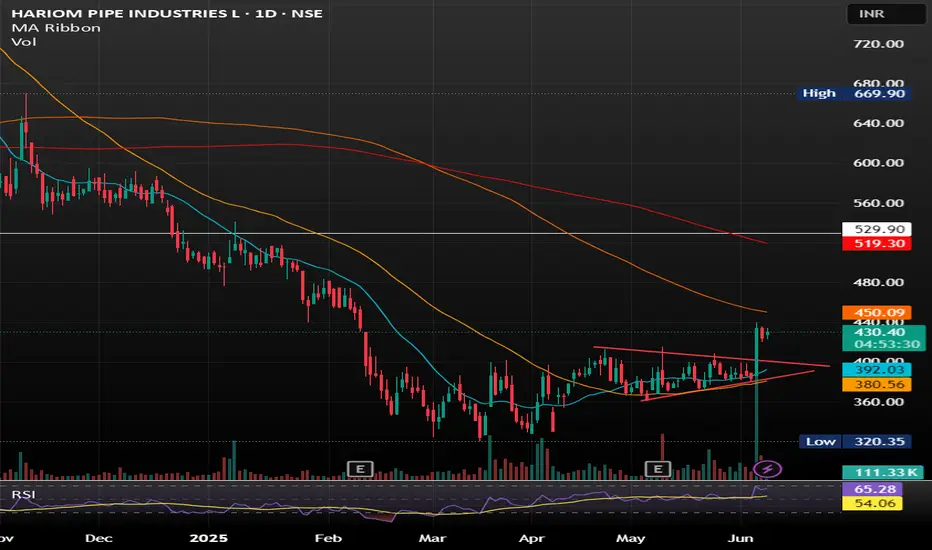
Hariom Pipes Industries Ltd Hariom Pipes Industries Ltd is a leading manufacturer of high-quality steel products, including HR Pipes, GI Pipes, GP Pipes, MS Pipes, HR Coils, and Billets. The company was established in 2007 and has grown into a major player in the iron and steel industry in India.
SYMETRIC TRIANGLE BREAKOUT WITH GOOD VOLUME SHOWING GOOD UPWARD MOMENTUM .
BUY IN ANY PULLBACK SUGGESTS.
at real good levelasset is in positive bending we can expect demand from here half demand zone is also important.

Bullish on INDUSTOWERINDUSTOWER has been in a triangular consolidation since 30th Aug 2024.
The stock corrected sharply since Sep2024 and then consolidated through the months of Nov2024 to March 2025 which is quite a considerable consolidation period.
The stock is now showing a Bullish momentum and is set to breakout.
We can anticipate a Target of 421 price level in the near term.
P.S. Not a Recommendation. Pls do your own due diligence.
