MINDACORPNSE:MINDACORP
Note :
1. One should go long with a Stop Loss, below the Trendline or the Previous Swing Low.
2. Risk :Reward ratio should be minimum 1:2.
3. Plan your trade as per the Money Management and Risk Appetite.
Disclaimer :
>You are responsible for your profits and loss.
>The idea shared here is purely for Educational purpose.
>Follow back, for more ideas and their notifications on your email.
>Support and Like incase the idea works for you.

3M INDIA🎯 Updated Trade Plan
Parameter Value
Entry Price 29440
Stop Loss 26628
Risk 2812
Reward 10648
Target 40088
Risk:Reward 3.8
Last High 36366
Last Low 25718
✅ Trade Strength Highlights
Strong Confluence of Demand Zones across all timeframes (HTF, MTF, ITF), confirming bullish bias.
Entry (29440) is well-positioned at a fresh Weekly RBR Demand Zone, indicating low institutional resistance at that level.
Stop Loss (26628) aligns with Half-Yearly Demand Distal, offering safety below key institutional zone.
RR of 3.8 exceeds the standard 2.0 benchmark, making this a high-quality trade setup.
Target (40088) is 10K+ points away, leveraging trend continuation and minimal supply interference up to recent high (36366).
🛡️ Risk Management Notes
Use partial profit booking strategy at or near 36366 (Last High).
Shift SL to breakeven after crossing ~30500–31000 to protect gains.
Monitor macro news/events that could impact industrials or mid-large caps.
📊 Consolidated Multi-Timeframe (MTF) Analysis: 3M India
Timeframe Zone Trend Logic Proximal Distal Avg
HTF Yearly UP RALLY BASE RALLY 26662 21300 23981
HTF Half-Yearly UP BUFL 28500 26628 27564
HTF Quarterly UP BUFL 28500 26628 27564
HTF Avg UP 27887 24852 26370
MTF Monthly UP BUFL 28500 26628 27564
MTF Weekly UP BUFL 27717 26200 26959
MTF Weekly UP RALLY BASE RALLY 29440 28830 29135
MTF Daily UP DMIP 28400 26820 27610
MTF Avg UP 28514 27120 27817
ITF 240M UP DMIP 28118 27830 27974
ITF 180M UP DMIP 28118 27830 27974
ITF 60M UP DMIP 29275 28515 28895
ITF Avg UP 28504 28058 28281

RKFORGE | Buy @LTP or 642 | SL below 580 | Targets 845, 1000Disclaimer:
This is not financial advice. Please do your own research or consult with a financial advisor before making any investment decisions. Investments in stocks can be risky and may result in loss of capital.

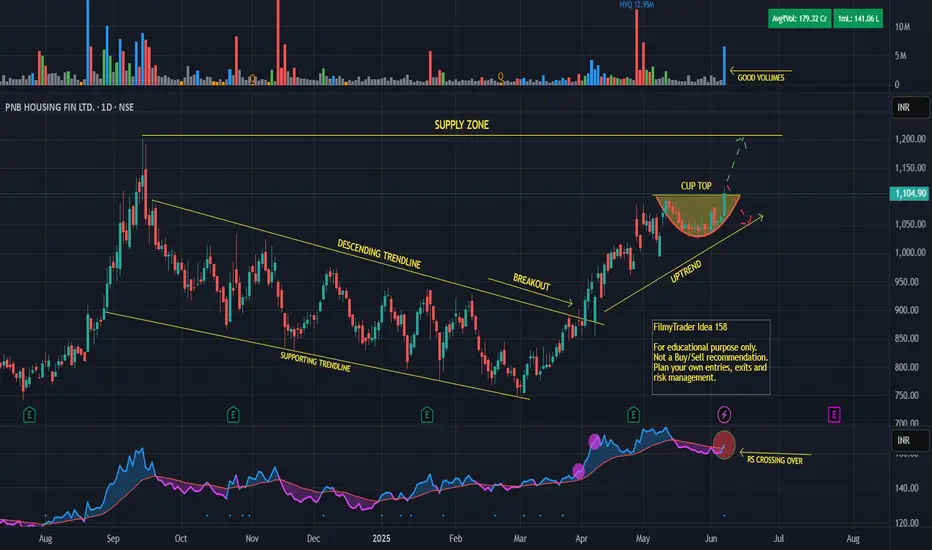
PNB housing - Cup pattern breakoutPNB Housing Finance Ltd
Breaking out of a CUP pattern in daily timeframe.
Stock in uptrend gaining momentum.
PSAR indicating bullish trend.
Close within 52 week zone.
Disclaimer:
For educational purpose only.
Please do your own research before taking any trades.
Happy Trading!
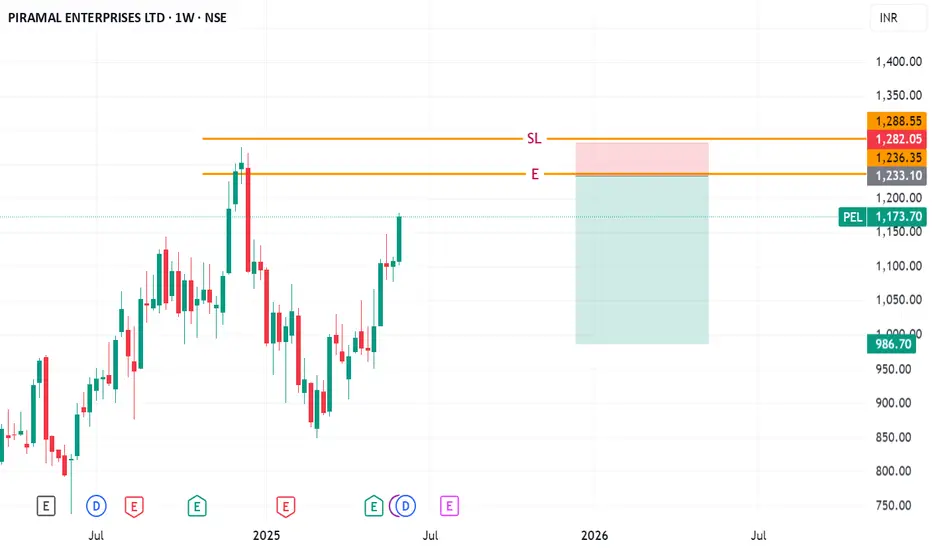
#PEL SUPPLY ZONE (SHORT SELL)PEL (Piramal Enterprises Ltd) has entered a supply zone, indicating potential selling pressure where sellers are likely to dominate.
STERTOOLS | Buy @LTP | SL below 335 | Targets 446, 540, 740Disclaimer:
This is not financial advice. Please do your own research or consult with a financial advisor before making any investment decisions. Investments in stocks can be risky and may result in loss of capital.

LT possible to touch 2850 for 15 to 17% correctionLT has shown Head & Shoulder pattern formation, it there is a breakdown then it has possibility to have following targets;
3260 / 3100 / 2930 / 2850

Godrej Properties - H&S Pattern to reach 1600Godrej Properties has confirmed Head & shoulder pattern breakdown.
With this breakdown, following targets possible.
2000 / 1885/ 1750 / 1600
SL: 2470

SBI towards 650? Butterfly pattern to complete "W"SBI is on the verge to form Butterfly pattern it has potential to reach 650 target with following support.
720 / 700 / 680 / 650

IREDA forming Shark pattern now towards 200 and the further....IREDA has formed shark pattern it has immediate target for 200. with SL 190.
Consecutive 3 candles close above 200 will open targets as below,
Target2: 210 / 220
Also in short term it will have possible target for 250 / 270.

ApolloTyre forming Head & shoulder - Possible 300.ApolloTyre has formed H&S pattern on weekly time frame.
It will have potential for 300 target in short term.
SL: 450
Target: 390 / 360 / 330 / 315 / 305 / 300

DLF - Towards 580 - Triple top BreakdownDLF has shown Triple top breakdown and with this it will have following targets
Target1: 655
Target2: 580

RKFORGE - LONG TERM ANALYSISThanks for stopping by.
All analysis here is done strictly from an investor’s perspective — focusing on risk, return, valuation, and potential upside.
The notes cover key details. I’ve backed every thesis with my own analysis — no fluff, just what matters to investors.
If you find the idea useful or have suggestions, feel free to leave a comment. Always open to fresh insights.
Kind regards,
Psycho Trader

Infy Bullish Infy 1563 is showing signs of bullish for target 1620. Support 1549.
Currently Undervalued and has potential to target 1833.

Indegene Technical Analysis - Still in SidewaysFollow the green channel for uptrend breaking IPO open price
Lookout for Exit below the Red trend line with text

Titan Target ₹12,000 in 3 yearsTitan is silently building a generational setup.
3 powerful cups.
Smart money is loading.
💸 Buy ₹2,500–₹3,600
🎯 Target ₹12,000 in 3 years
One of the most reliable compounding stories in India.
#Titan #Nifty50 #BreakoutStocks #IndiaInvesting #LongTermWealth #TATAGroup

Fortis rounding bottom breakout ;)I think the title explains it? Fortis made a rounding bottom and broke out

SBIN Weekly Levels and reportLook at the Weekly Chart:
This will show you how SBIN’s price has moved each week.
Identify Support and Resistance:
Support is where the price usually doesn’t fall below (like a floor).
Resistance is where the price often doesn’t go higher than (like a ceiling).
Example: If SBIN’s price bounced off ₹590 a few times, that’s support. If the price keeps struggling around ₹640-650, that’s resistance.
Check for Fibonacci Levels (Optional):
You can use a tool that shows you Fibonacci retracement levels. It helps find where prices might bounce or reverse.
Key levels to watch for are 38.2%, 50%, and 61.8% retracements from a big move (up or down).
Draw Trendlines:
If SBIN has been moving up, draw a line connecting the lows to see where it might find support in the future.
If it’s in a downtrend, connect the highs to see where resistance might be.
Check the Moving Averages:
The 50-week and 200-week moving averages can show if the stock is generally moving up or down.
If SBIN is above the 50-week average, it might be in a bullish (up) trend.
If it’s below the 200-week average, it might be in a bearish (down) trend.
Look for Round Numbers:
Prices like ₹600, ₹650, ₹700 are often seen as psychological levels. Traders often watch these prices because they’re easy to remember.
Example:
If SBIN recently bounced off ₹590 or ₹600 multiple times, that’s support.
If it keeps facing resistance around ₹640 or ₹650, those are resistance levels.
Final Thoughts:
If SBIN’s price breaks above resistance (say ₹650), it might go higher.
If it falls below support (say ₹590), it might drop further.

Double Bottom Formation--PRAJ- Bullish view- Educational PurposeBOUNCE FROM WEEKLY DEMAND ZONE- BULLISH VIEW
EDUCATIONAL PURPOSE
Bounce back observed from weekly demand zone after consolidation of 6-7 weeks
Double bottom formation in weekly demand zone indicates reversal of downtrend
Fibo Targets
Target 1 : 1088 (116%) (24-36 months)--June 2028
Target 2 : 1240 (146%) (40-60 months)-- June 2030
stoploss : Weekly closing below 438 (-15%)
RR ratio 1:10
Only long term view, Need to clear hurdle near 825-850

BULLISH VIEW IN RK FORGING--Educational PurposeBOUNCE FROM WEEKLY DEMAND ZONE- BULLISH VIEW-
Educational purpose
Bounced after testing weekly demand zone and consolidating for 3 weeks suggest reversal of the downtrend.
Fibo targets :
Target 1 : 1375 (108%) (24-30 months)
Target 2 : 1570 (137%) (36-42 months)
SL : weekly closing below 550 (-17%)
RR Ratio : 1:8.5
Only long term view

NTPC TARGET NEARBY 35% Will JUMP Within next monthsNTPC SHARE TARGET AND SL PROVIDED . There is no any recomandation of buy or sell
#ntpc#target

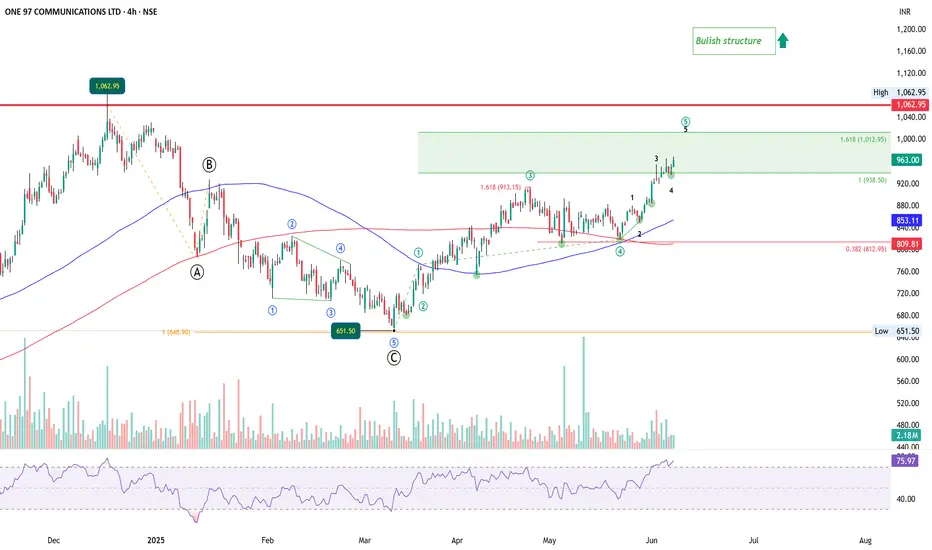
Paytm Approaching Key Zone – Bullish Impulse Nearing MaturityAfter completing an ABC correction at ₹651.50, Paytm (One 97 Communications) has formed a clean 5-wave impulsive move upward. The current structure shows Wave 5 progressing, with internal subwaves 1-2-3-4-5 clearly visible within it.
The projected target zone for Wave 5 lies between ₹938.50 and ₹1,012.95, derived from 1x and 1.618x of Wave 1 measured from Wave 4. Price is currently trading near ₹963 – right inside this key confluence zone.
Volume picked up during Wave 4 and has continued into Wave 5, showing continued interest from participants.
RSI is in overbought territory (~76) and has not confirmed the new high, hinting at potential bearish divergence.
Price remains above both the 100 and 200 SMAs, confirming the overall bullish structure. However, with momentum showing signs of fatigue, a short-term pullback may follow as Wave 5 nears exhaustion.
Chart will be updated as price action evolves.
Disclaimer: This analysis is for educational purposes only and does not constitute investment advice. Please do your own research (DYOR) before making any trading decisions.
TATA STEEL- NO DESCRIPTION NEEDEDsimple price action says everything on the chart- 200 is indeed looking good- track tata steel.
