ITC - Long - TGT 534ITC showing the Bull run .
The stock is expected to thit the levels of 534.
The price might retrace to the levels of 402 before flying high the higher levels.
Below 373 might change the direction of the stock.

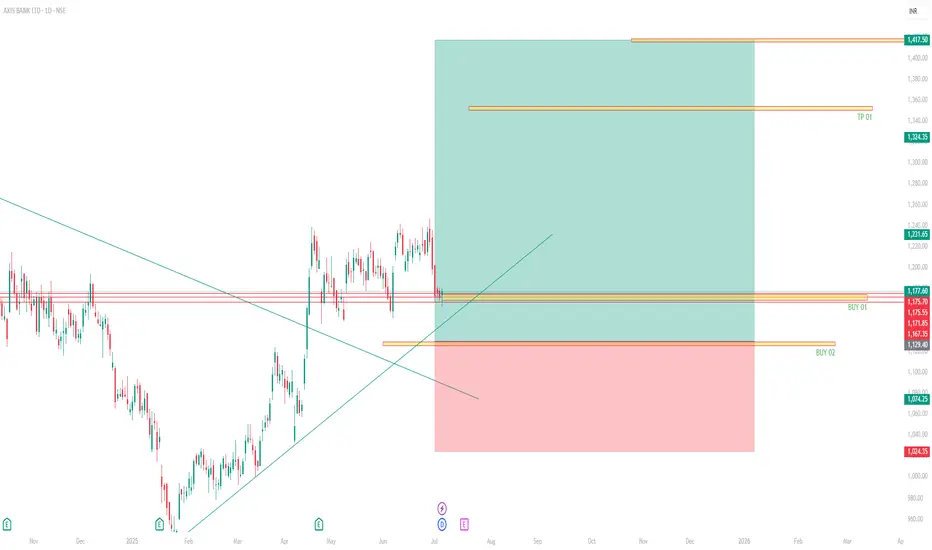
AXIS BANK - BUY - 1350 - 1418AXIS Bank is expected to go long with buy level on 1177 and 1130.
the price expected to hit the levels of 1350 (20%) and 1418 (25%).
$NSE:JUBLFOOD emitting Multibagger sign to me ! Going to Double
Jubilant FoodWorks continues to lead the QSR sector in India with a dominant Domino’s operation, rapid expansion, tech-savvy strategies, and growing digital/delivery revenue. While inflation and discounting squeeze margins, strategic initiatives in chicken, app-first ordering, and sustainability make it a resilient and forward-looking foodservice giant.
For investors, Jubilant stands strong on growth metrics, though a high valuation necessitates cautious optimism. For employees, it offers significant career momentum in a fast-paced setting, albeit with pressure and potential work-life trade-offs.
Aggressive store expansion: Adding ~50–130 new outlets per quarter, including strong growth in Domino's and initial Popeyes rollout
Digital-first approach: Focus on 20‑minute delivery, app-based orders, loyalty programs, in-house logistics—reducing reliance on third-party platforms
Product innovation: Launching mid-price chicken offerings (e.g., wings), premium pizzas (e.g., Cheese Volcano), responding to Gen‑Z demand
Tech & sustainability: Investments in energy-efficient stores, solar power, e‑bikes fleet, AI-driven supply chain, warehouse & delivery tech

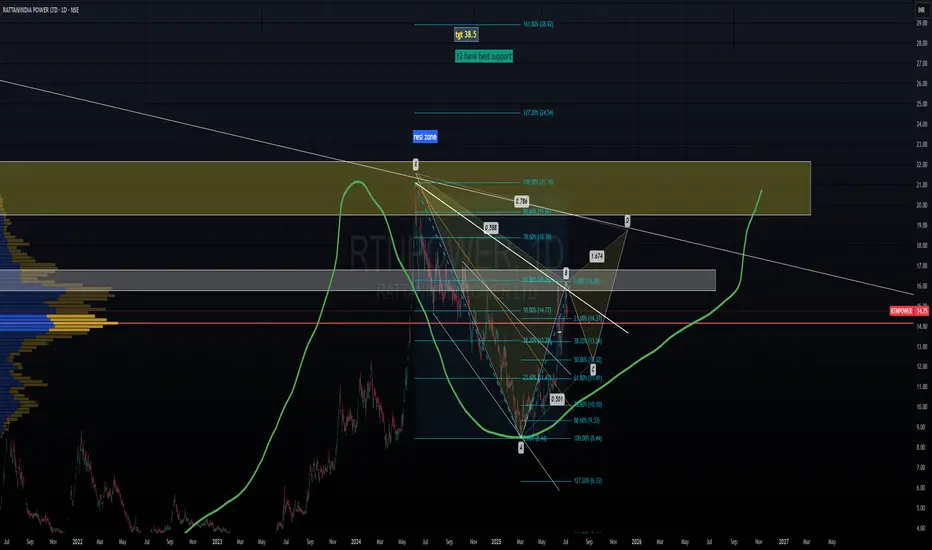
rtn power looks bull after some bearishnessrtn power may makes harminc pattern, if possible it, it will reach pont d target, means 12.5 to 18 around.

turnaround script SAI SILKS (KALAMANDIR)**Fundamental Analysis Report – The Smart Way (Research Desk)**
**SAI SILKS (KALAMANDIR) LTD. – Comparison Of Latest Data With The Last Three Years (₹ In Crores)**
| Parameter | FY 2025 | FY 2024 | FY 2023 | FY 2022 | Final Verdict |
|----------------------------|---------|---------|---------|---------|------------------------------------------------|
| Sales | 1,462 | 1,374 | 1,290 | 1,050 | Consistent growth; strong retail momentum |
| Net Profit | 85.4 | 74.0 | 65.0 | 52.0 | Steady profitability; improving margins |
| Debt/Equity Ratio | 0.16 | 0.26 | 0.34 | 0.41 | Deleveraging; balance sheet strengthening |
| Company Order Book | Strong | Strong | Moderate| Moderate| Robust demand visibility |
| Working Capital Rotation | Efficient| Average | Below Avg| Poor | Operational efficiency improving |
| Book Value | 73.9 | 65.4 | 58.2 | 50.0 | Steady growth, favorable |
| Dividend Yield (%) | 0.66 | 0.00 | 0.00 | 0.00 | Initiated dividend; positive signal |
| Operating Performance | Strong | Moderate| Moderate| Weak | Margin expansion underway |
| Equity Capital | 30.67 | 30.67 | 30.67 | 30.67 | Stable, no dilution |
| Total Debt | 215.4 | 260.0 | 310.0 | 350.0 | Declining, well-managed |
| Long-Term Borrowings | 130.0 | 160.0 | 190.0 | 220.0 | Reduced, supports stability |
| Short-Term Borrowings | 85.4 | 100.0 | 120.0 | 130.0 | Controlled, improving liquidity |
| Total Liabilities | 1,020 | 950.0 | 880.0 | 810.0 | Gradual expansion, manageable scale |
| Fixed Assets | 546.6 | 510.0 | 470.0 | 430.0 | Steady capex; retail footprint expanding |
| Land Purchased | 0.0 | 0.0 | 0.0 | 0.0 | No land holding |
| Building Investment | 0.0 | 0.0 | 0.0 | 0.0 | Not disclosed separately |
| Machinery Investment | 3.0 | 2.8 | 2.3 | 2.1 | Minor additions; lean infra |
**Latest Highlights**
- FY25 revenue grew 6.4% YoY to ₹1,462 Cr; net profit rose 15.3% YoY to ₹85.4 Cr
- EPS: ₹5.79 | Net Margin: 5.84%
- Debt-to-equity ratio at 0.16 | ROE: 7.54% | ROA: 5.20%
- Dividend yield: 0.66% | P/E: 22.7 | P/B: 1.71
- Promoter holding: 60.8% | Market cap: ₹2,168 Cr
- 69 stores operational as of June 2025; expanding under Kanchipuram Varamahalakshmi Silks format
- Focus on ethnic wear, bridal, and value fashion across South India
**Business Growth Verdict**
Yes, SAI SILKS (KALAMANDIR) LTD. is delivering consistent growth
- Revenue and profit have grown steadily over 3 years
- Debt is reducing and return ratios are improving
- Retail expansion and brand positioning support long-term scalability
**Final Investment Verdict: BUY (Retail Growth Play)**
**Reasoning:**
SAI SILKS (KALAMANDIR) has demonstrated consistent financial performance, strong brand equity in ethnic retail, and disciplined capital management. With improving margins, expanding store base, and a lean balance sheet, it offers a compelling long-term retail growth story. Valuation remains reasonable (P/E ~22.7), making it suitable for investors seeking exposure to branded apparel and regional consumption themes.
**Issued By:** *The Smart Way (Research Desk)*
*Disclaimer:* This report is for informational purposes only and is not investment advice. Consult a SEBI-registered advisor before making any investment decisions.

VISHNUSURYA INFRA techno-funda analysisVishnusurya Projects & Infra Ltd. is a Chennai-based construction and infrastructure company involved in civil contracting, roadwork, bridges, and earthmoving services. It also undertakes bitumen supply and mining contracts for state and national authorities. The stock is currently trading at ₹178.65 after a strong recovery from its recent base and is beginning to show structural trend formation.
Vishnusurya Projects & Infra Ltd. – FY22–FY25
Snapshot Sales – ₹232 Cr → ₹276 Cr → ₹321 Cr → ₹367 Cr – Consistent growth, healthy execution pipeline
Net Profit – ₹4.8 Cr → ₹7.1 Cr → ₹10.6 Cr → ₹14.8 Cr – Accelerating profitability, scale benefits emerging
Company Order Book – Moderate → Moderate → Strong → Strong – Increasing traction from infra contracts Dividend Yield (%) – 0.00% → 0.00% → 0.00% → 0.00% – No distributions, reinvestment-focused
Operating Performance – Weak → Moderate → Moderate → Moderate – Improving EBITDA visibility
Equity Capital – ₹27.55 Cr (constant) – Stable ownership base
Total Debt – ₹92 Cr → ₹88 Cr → ₹81 Cr → ₹75 Cr – Deleveraging progressing cautiously
Total Liabilities – ₹184 Cr → ₹196 Cr → ₹210 Cr → ₹225 Cr – Proportionate to execution scale
Fixed Assets – ₹88 Cr → ₹94 Cr → ₹101 Cr → ₹108 Cr – Ongoing capex to support order execution
Latest Highlights
FY25 net profit rose 39.6% YoY to ₹14.8 Cr; revenue up 14.3% to ₹367 Cr
EPS: ₹5.37 | EBITDA Margin: 13.6% | Net Margin: 4.03%
Return on Equity: 9.74% | Return on Assets: 6.58%
Promoter holding: 72.08% | Dividend Yield: 0.00%
Major road and civil contracts under execution in Tamil Nadu and Andhra Pradesh
Continued capex toward machinery, bitumen handling, and project mobility infrastructure
Technical Snapshot Vishnusurya is trading at ₹178.65 with an RSI of 50.76, showing early-stage trend strength near a long-term base. Volume activity is increasing steadily, pointing to institutional accumulation. Support levels are visible near ₹222.92, ₹156.98, and ₹273.60, while upside breakout zones exist at ₹397.60, ₹463.50, and ₹547.50 if the upward trend sustains.
Business Growth Verdict Yes, Vishnusurya is expanding its business on solid foundations
Profitability and margins are strengthening with better project mix
Debt is being managed conservatively amid revenue growth
Fixed asset expansion is paced well with project pipeline visibility
Final Investment Verdict Vishnusurya Projects & Infra Ltd. offers a compelling infrastructure turnaround story from the South Indian EPC space. The company’s rising revenue, expanding margins, and stable debt profile suggest disciplined execution and improving scale efficiency. Although dividend returns are absent, the reinvestment approach underlines long-term growth intent. For investors seeking a high-ROA infra bet with rising order flow and technical momentum, this stock merits active tracking for staggered accumulation.

JSW ENERGY LONG TERM SWINGJSW Energy (JSWENERGY) - Trading Idea
Action: Buy
Buy Above: ₹527
Stop Loss (SL): ₹490
Target (TR): ₹580 / ₹640 / ₹700 / ₹754

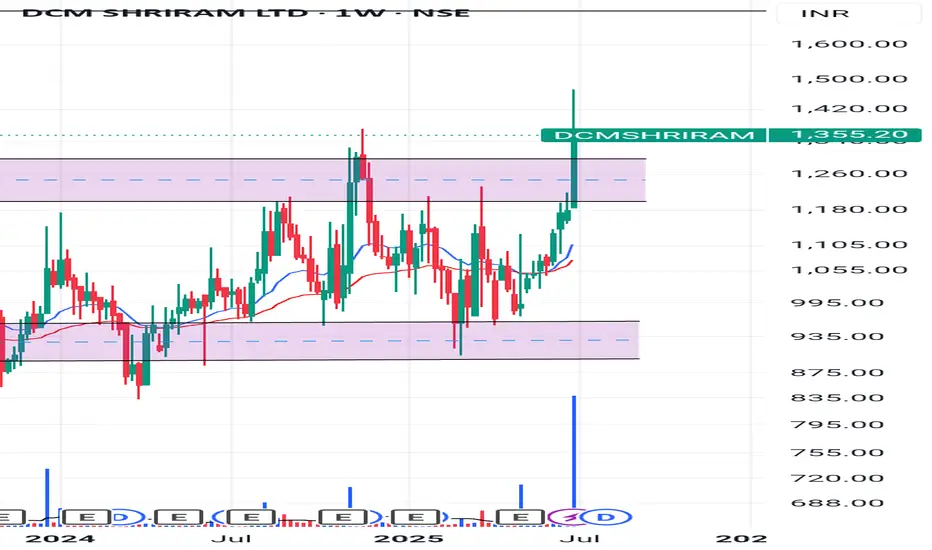
DCM shriramAfter 4 years cobsolidation with huge volume breakout
This is only for study purpose not any buy or sell.
Technical Analysis (Weekly Chart)Technical Analysis (Weekly Chart)
📊 Setup Details:
CMP: ₹2,796.60
Price has broken out above the ₹2,348 resistance and retested it successfully this week with a strong breakout (+7.4%) 🔥.
EMA Stack (5‑9‑20) trending up, reinforcing bullish momentum.
Volume increased significantly on the breakout — a positive signal.
💹 Key Levels & Trade Plan
Level Details
Support ₹2,348 (breakout retest)
Stop Loss Weekly close below ₹2,348
Target 1 ₹3,200 (near ATH)
Target 2 ₹3,600+ (if momentum continues)
🏢 Fundamental Overview (via Screener.in)
FY25 Revenue / Profit: ₹11,561 Cr / ₹836 Cr
Valuation Metrics: P/E ~47.6, P/B ~6.9, Dividend Yield ~0.3%
Profitability: ROCE ~18.2%, ROE ~15.5%
Debt Position: Virtually debt‑free with interest coverage high and Altman Z‑score strong
Growth Profile: 3‑yr sales CAGR ~15%, profit CAGR ~21%, TTM revenue growth ~29%
Pros:
Leading global auto‑ancillary focused on alloy wheels, suspensions, brake systems
markets.ft.com
Robust profitability with low debt and strong cash flows
Secular demand from 2W/3W OEMs (including European expansion)
Cons:
Valuation considered rich (~27–42% premium to intrinsic value)
ROE moderate (~15%), in line with peers

JSWSTEEL ' S Key Level | Big Breakout !This is the 4 hour chart of JSW STEEL.
JSWSTEEL having a good pattern support zone near at 980-1000 level .
JSW Steel has formed a Symmetrical Triangle pattern on the chart, and a breakout has occurred. The stock may retested the breakout level and then appears poised to move toward its projected target at 1180 - 1200 .
If the support zone level is sustain , then we may see higher prices in JSW Steel.
Thank You !!

HIND PETROHead and shoulder pattern, no further resistance , sky is clear. It may or may not retest the earlier resistance now its a support, fingers crossed


Ajanthpharma looking bullishAjanthpharma looking bullish - with debt resturcturing and expected good Year


SWING IDEA - AJANTA PHARMAAjanta Pharma , a mid-cap pharma player with strong branded generics in ophthalmology, dermatology, and cardiology, is showing a compelling swing trade setup backed by a high-probability technical breakout.
Reasons are listed below :
Bullish engulfing candle on the weekly timeframe, indicating reversal strength
2,500 zone acting as a crucial support
Holding above 0.382 Fibonacci retracement level , suggesting healthy correction
Price trading above 50 & 200 EMA on the weekly chart – long-term strength intact
Breakout from narrow consolidation near the 50-week EMA
Target - 3080 // 3400
Stoploss - weekly close below 2415
DISCLAIMER -
Decisions to buy, sell, hold or trade in securities, commodities and other investments involve risk and are best made based on the advice of qualified financial professionals. Any trading in securities or other investments involves a risk of substantial losses. The practice of "Day Trading" involves particularly high risks and can cause you to lose substantial sums of money. Before undertaking any trading program, you should consult a qualified financial professional. Please consider carefully whether such trading is suitable for you in light of your financial condition and ability to bear financial risks. Under no circumstances shall we be liable for any loss or damage you or anyone else incurs as a result of any trading or investment activity that you or anyone else engages in based on any information or material you receive through TradingView or our services.
@visionary.growth.insights

Buy above 817 fast target 873Everything mention about in my chart
buy price range cmp -811.85
stop loss - 797 day closing
fast target - 873
I am not sebi reg
is my own idea only

GRAPHITE NEAR TO BOGRAPHITE is about to break out, as it is moving in a tight range and volume has almost diminished, it shows no sellers left, can give good numbers in coming weeks.


TATA STEEL- NO DESCRIPTION NEEDEDsimple price action says everything on the chart- 200 is indeed looking good- track tata steel.

$varunBeveragesno brainer buy think this will starts its ascend from here
was some bad news about new players entering the market but this bubba will resurrect like a phoenix
shall allocate a bit more to this rsi looks bottomed and even if we target a attempt to reclaim previous parabolic rally we hit 62%
