LIC HOUSING FINANCE AT KEY SUPPORT ZONE.This is the 4 hour chart of LICHSGFIN.
LICHSGFIN is trading near it's support zone at 600 range.
If this level is sustain,then we may see higher prices in stock.
Thank You !!

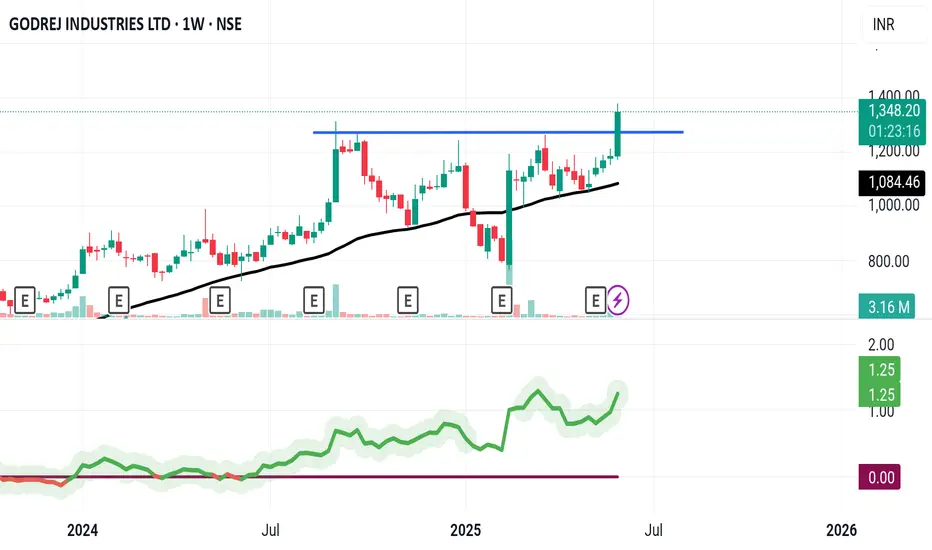
Godrej Industries Ltd Weekly Trend AnalysisGodrej Industries Ltd has broken out to a new all-time high, closing at 1359.50. The stock indicates a potential uptrend with likely targets at 1480 and 1717.
Traders are advised to carry out their own technical analysis before making any trading decisions.

Jindal stainless ltdJindal Stainless Ltd has been forming higher lows and has now broken through the key resistance level at 660. With this congestion breakout, the stock signals a continued bullish move, potentially heading towards the target of 740.
Please conduct your own technical analysis and apply proper risk management before taking any trade. This is solely my personal view.
#jsl #bestbreakout #uptrend #longteam

TATA STEEL at Resistance ZoneThis is Daily Chart of TATA STEEL.
Tata steel having good Law of Polarity at 163-168 range.
If this level is sustain , then We may see lower prices in the stock again.
Tata steel is a good support zone at 125-130 range.
Two EMAs are also supporting the stock, with the first EMA positioned at ₹140 and the second at ₹129.
THANK YOU !!

GODREJ INDUSTRIES LTDBreakout happend in this stock with rising 200dma and RS indicator is also showing strength.
Keep your risk and reward ratios according to your own preferance.
This is for educational purpose, do your own research before investing.

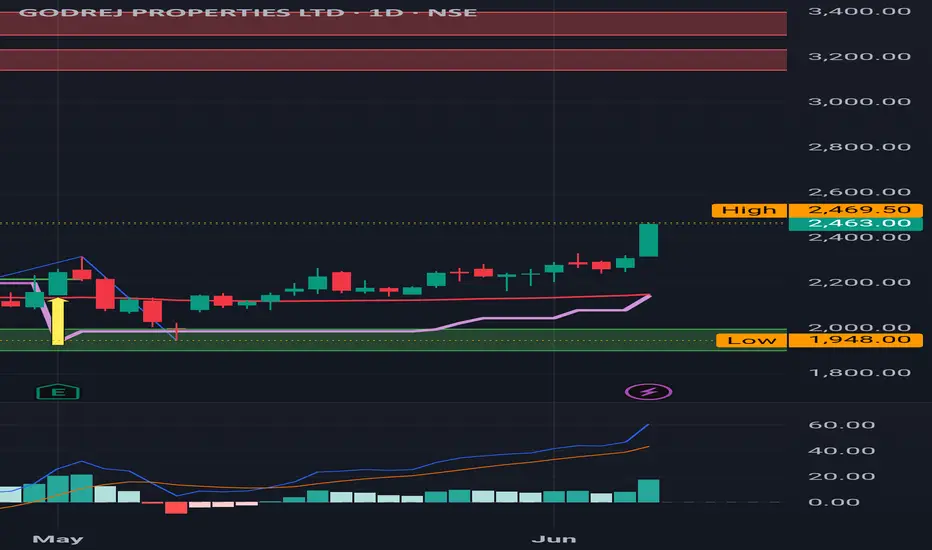
GODREJ Properties: Rallied quite well from a Buy Signal GODREJ Properties: Rallied quite well from a Buy Signal .
Important levels to test are 2522 /3000 .
( Not a Buy / Sell Recommendation
Do your own due diligence ,Market is subject to risks, This is my own view and for learning only .)
HFCL : In a Buy trajectory and resistance levels HFCL : In a Buy trajectory and resistance levels .
( Not a Buy / Sell Recommendation
Do your own due diligence ,Market is subject to risks, This is my own view and for learning only .)

IDFC First Bank : Rallied from a Buy Signal, now at a resistance
IDFC First Bank : Rallied from a Buy Signal, now at a Red band resistance.
( Not a Buy / Sell Recommendation
Do your own due diligence ,Market is subject to risks, This is my own view and for learning only .)

ZYDUS LIFESCIENCES AT BEST SUPPORT !!This is the 4 hour Chart of ZYDUSLIFE.
Zydus Lifesciences at good support zone near ₹920–₹930 range.
Zyduslife is moving in a Higher High and Higher Low (HH-HL) formation.
Stock has formed a broadening pattern within the channel.
If this level is sustain, we may see higher prices in ZYDUSLIFE.
THANK YOU !!


Consolidation Breakout forming on Dhampur Sugar1. Stock is consolidating below 151 resistance, forming higher lows with a bullish structure.
a breakout required above 151 with strong volume to a fresh bullish move.
2. price action shows a volatility contraction.
3. moving averages sloping up trend intact. wait for volume breakout and bullish close.
4. volume has since declined but remains stable, showing healthy consolidation.


Syncom looking good Syncom formulations looking good
And try to break trendline
Also create good base in this range

Jindal Stainless Ltd Stock Daily AnalysisJindal Stainless Ltd has been forming higher lows and has now broken through the key resistance level at 660. With this congestion breakout, the stock signals a continued bullish move, potentially heading towards the target of 740.
Please conduct your own technical analysis and apply proper risk management before taking any trade. This is solely my personal view.

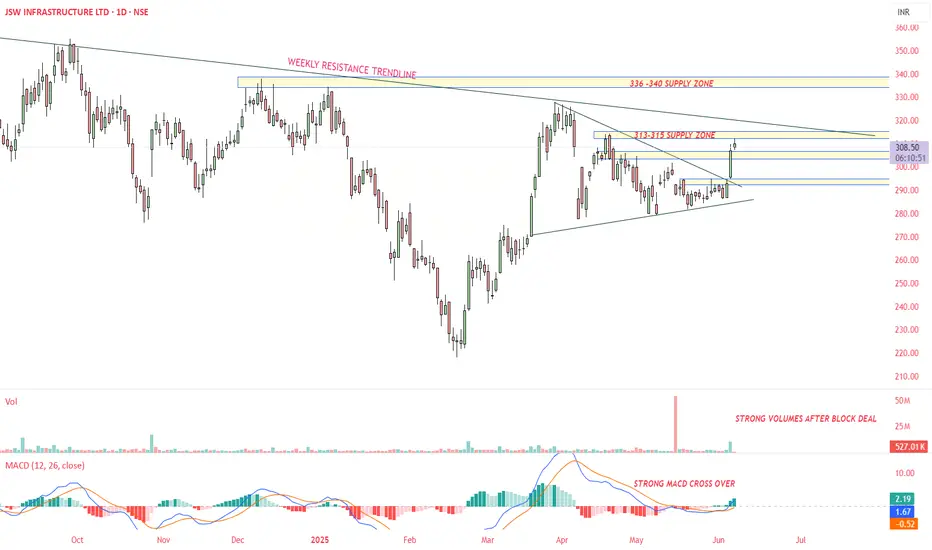
JSWINFRA - Daily time frame StudyFollowing are my Inputs for above chart reading -
1. MACD cross over
2. High volume Breakout of Symmetrical Triangle Pattern - Daily Time frame
3. It may go till weekly resistance line 330-340
This chart is only for educational purpose, Please contact your financial advisor for any trading or investment decisions.
APL APOLLO TUBES - Rectabgular PatternNSE:APLAPOLLO in 2 Year Break Out. It has formed a Rectangular Pattern. If it's able to sustain above 1810, you can Target for 1900 and Exit.

LT Foods (Channel Break)LT foods
Breaking above channel
High Volumes on buying days
SL : 435
Target 550

JWL (Swing):JWL (Swing):
JWL is getting ready for an up move by breaking the past supply levels.
Script is consolidating and have formed a strong base.
Trade offers a RR of more than 1:5.
Check out my earlier views for a better understanding.
Note: Do your own due diligence before taking any action.

Wipro ExitWipro 247 is in bearish trend. Exit with SL 243.
Signals are negatively diverged.
If support breached, it may fall to 213.

DYNAMIC CABLES LTDStock fundamentally strong
Breakout with DOJI above key resistance and both EMAs.
Strong volume spike.
Bullish structure with higher highs and higher lows and trend line support.

TataMotors Time To BoostTataMotors Recently Touched Day 1 Timeframe Demand Zone And In Previous He Also Touched Monthly / Quarterly Demand Zone So Trend Is UP Perfect Swing Trading Setup
