SBIN - VCP formationThe sector has a whole is lagging the broader market, private banks and financial services have been the leaders. Position size should be in check. Wait for trendline breakout for an ideal entry. This is a long term play.

TECHNOETechno Electric is looking good for swing target CMP: 1517 around.
Time: Few Days.
Target: 50,100 points can be earned!

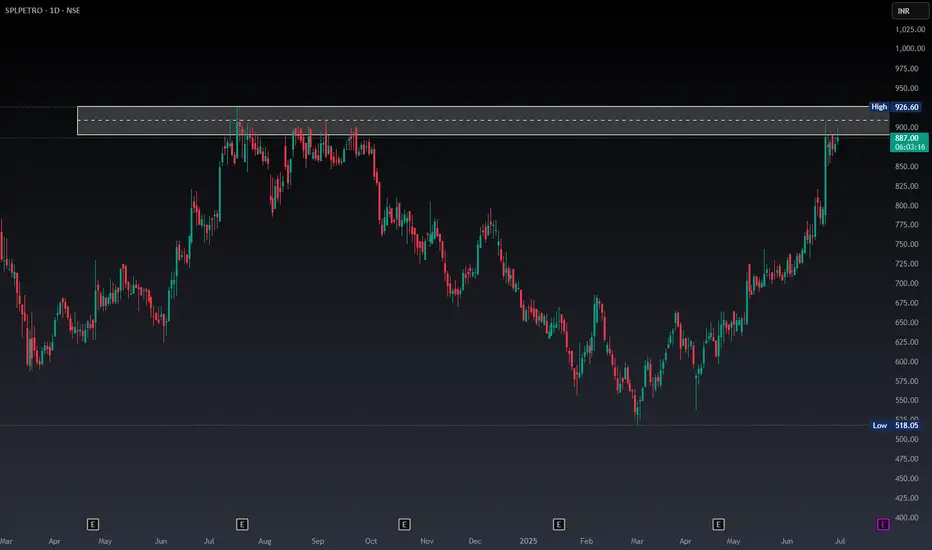
SPLPETRO - Looks stronger and can BreakoutSPLPETRO on the Breakout level and RSI on most TF looks positive, good chances of giving a breakout
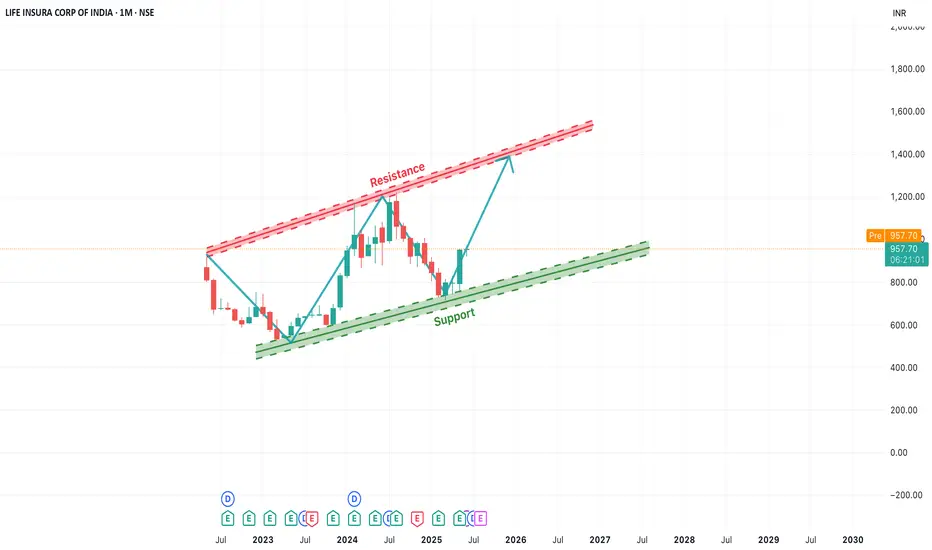
[Long-Term]LICI Rising Channel Pattern Indicates Bullish OutlookIn this monthly chart of LICI, we observe a clear ascending channel pattern forming over the past two years. The price has consistently respected both the support and resistance trendlines, creating a strong bullish structure.
Currently, the stock is bouncing off the lower support trendline, indicating a potential upward move towards the upper resistance zone. This offers a positive long-term outlook, especially if the momentum sustains. The key levels to watch are:
Support Zone: Around ₹850–₹900
Resistance Zone: ₹1250–₹1300
Traders and investors can monitor for a gradual rise toward the resistance level. A breakout beyond this channel may open up new highs, while a breakdown below the support trendline would invalidate the pattern.
APARINDS Trade for TomorrowApar Industries nicely moving in a tight range for more than a month, Looks like now ready to move up!

IIFL MOVING IN RANGEIIFL has recently BO and now moving in a tight range its previous resistance now become its support. Its likely to move up from here.

breakoutThe Accumulation
Refers to buying pressure, where more buyers than sellers are active in the market

cera ...consumer durables ..seems at good price cera ...consumer durables ..seems at good price ...
price at support showing great support ...price action seems good ...it could a good swing opportunity...do study it guys


strong technical uptrendeverything mention about in my chart
I am not sebi reg
just my own technical analysis
happy trading
Happy good day....

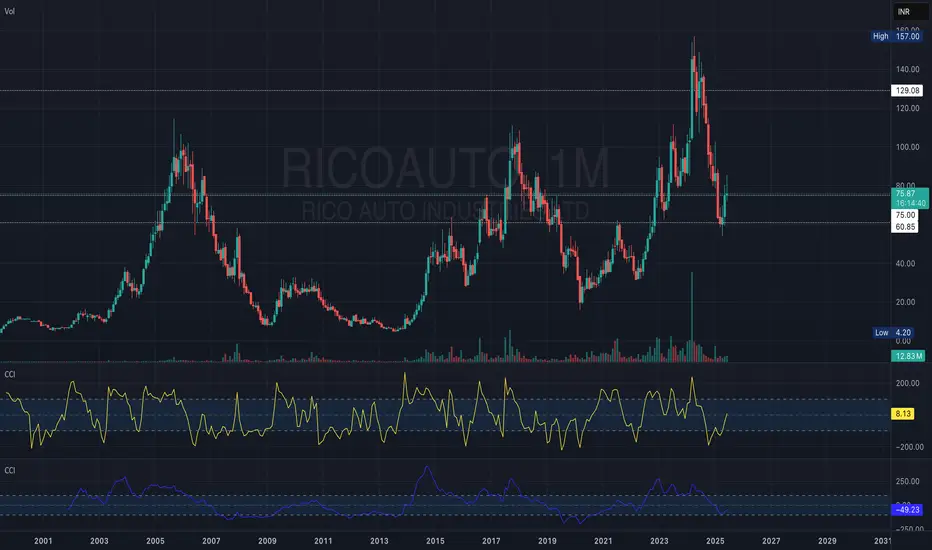
After recent correction Rico auto industries...After recent correction looks like Rico Auto found the base at 75 and will not go below 75, one can start buying in tranches for targets towards ATH...slow move....
INDUS TOWER - BREAKOUTNSE:INDUSTOWER Breakout stock with momentum indicators and multiple timeframe.


NCL IND - BREAKOUTNSE:NCLIND Breakout stock with multiple timeframe analysis and momentum indicators.


LTFOOD BUY @ 460-480. TARGET 800LTFOODS | Breakout 🍚🚀
Best Buy: ₹460–480
🎯 Target: ₹800+ in 6–12 months
#UniproMomentumPattern detected
📈 Strong volume surge + breakout from base
#LTFOODS #StockMarketIndia #BreakoutStocks #CupWithHandle #Multibagger


JUBILANT PHARMOVA - BREAKOUTNSE:JUBLPHARMA Breakout stock with momentum and bullish on multiple timeframes.

SML ISUZU - BREAKOUT RETEST BREAKOUTNSE:SMLISUZU Breakout stock with momentum indicators and bullish on multiple timeframes.

PRIVI SPECIALITY - BREAKOUT STOCKNSE:PRIVISCL Breakout stock on multi timeframe from qty , weekly, daily charts. momentum indicators also in force.

GRAPHITE - BREAKOUT NSE:GRAPHITE Breakout stock with consolidation of many years, weekly and monthly also positive.
