SBIN | Buy @LTP | SL below 776 | Targets 880, 970Disclaimer:
This is not financial advice. Please do your own research or consult with a financial advisor before making any investment decisions. Investments in stocks can be risky and may result in loss of capital.

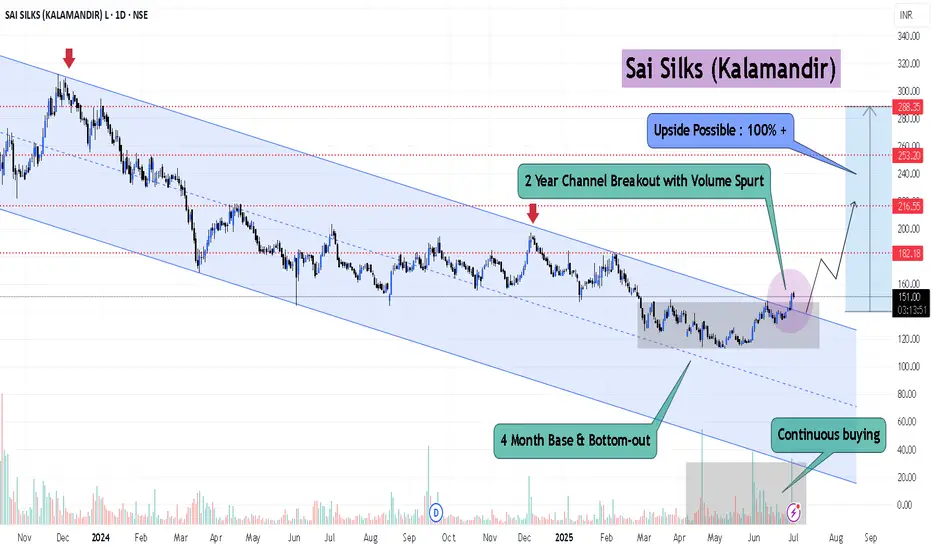
Sai Silk Potential Upside 70-100%- 2 Year Channel Breakout
- 4 Month Base & Bottom-out
Like & Boost are highly appreciable
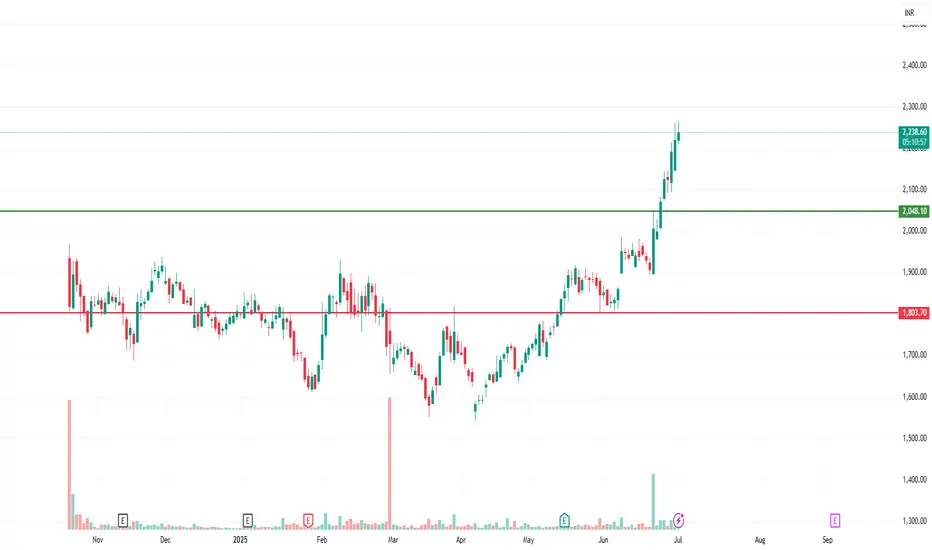
Deepak Fertilisers- mera Ghar kaa DEEP!!📊 Summary:
Deepak Fertilizers has successfully broken out of a Cup and Handle pattern with a weekly close above ₹1450, confirming a strong bullish trend. RSI supports the move, and price action aligns with classic breakout behavior.
🔍 Technical Breakdown:
Pattern: Cup & Handle formation – bullish continuation setup.
Breakout Zone: ₹1450 breached on weekly closing basis.
Stoploss: Revised to ₹1414 (recent swing low and pattern base).
Immediate Resistance: ₹1637 (recent high – minor resistance).
Next Target Zone: ₹1750–₹1850 (based on cup depth projection and pattern breakout).
RSI (14): 69.17 – just below overbought zone, strong momentum.
Volume: 1.24M – confirms breakout strength with good participation.
✅ Suggestions:
Trend Confirmation: Weekly close above ₹1450 = Confirmed uptrend.
Buy on Dips: Any retest toward ₹1450–₹1475 could be a good entry zone.
Short-Term Targets: ₹1650–₹1700
Medium-Term Targets: ₹1800–₹2000 (Cup & Handle measured move)
Stoploss (Trailing): ₹1414 (weekly close basis) – can be revised higher as price progresses.
RSI Alert: Watch if RSI crosses into 70–75 zone – that may signal potential overbought conditions; partial profit booking advised.
⚠️ Caution:
After a sharp breakout, minor pullbacks are natural – don’t panic on short-term dips.
Avoid chasing the price – wait for consolidation or minor retracement to enter.
📌 Conclusion:
Deepak Fertilizers has entered a strong bullish phase post a confirmed Cup and Handle breakout. Momentum is healthy, supported by volume and RSI. Maintain a bullish stance with a trailing stop below ₹1414, and ride the trend toward ₹1750+ over the coming months.

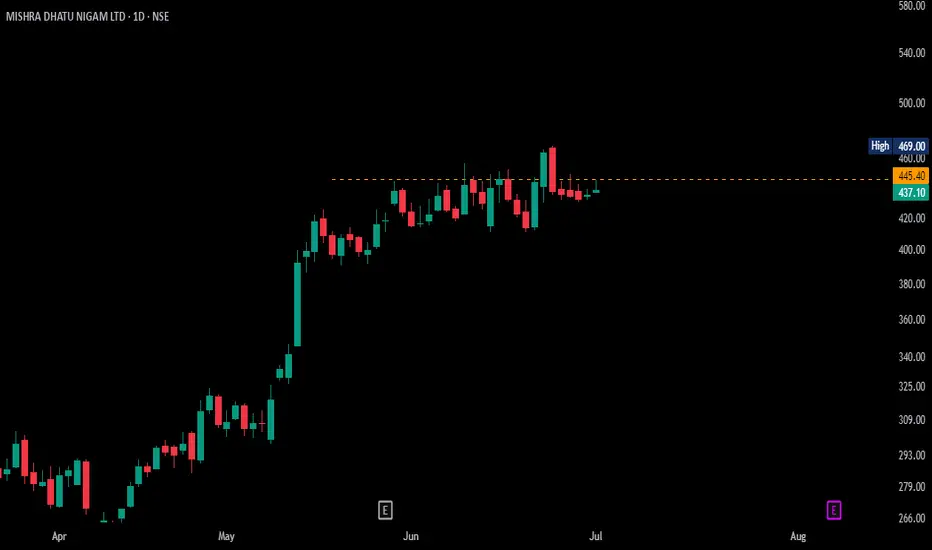
MIDHANI READY TO GOMisra Dhatu Nigam Limited, it has completed its setup and ready to go above this orange line.
HYUNDAIHYUNDAI
watch above levels. green line is our entry, redline is our SL.
DISCLAIMER : I am NOT a SEBI registered advisor or a financial adviser. All the views are for educational purpose only.
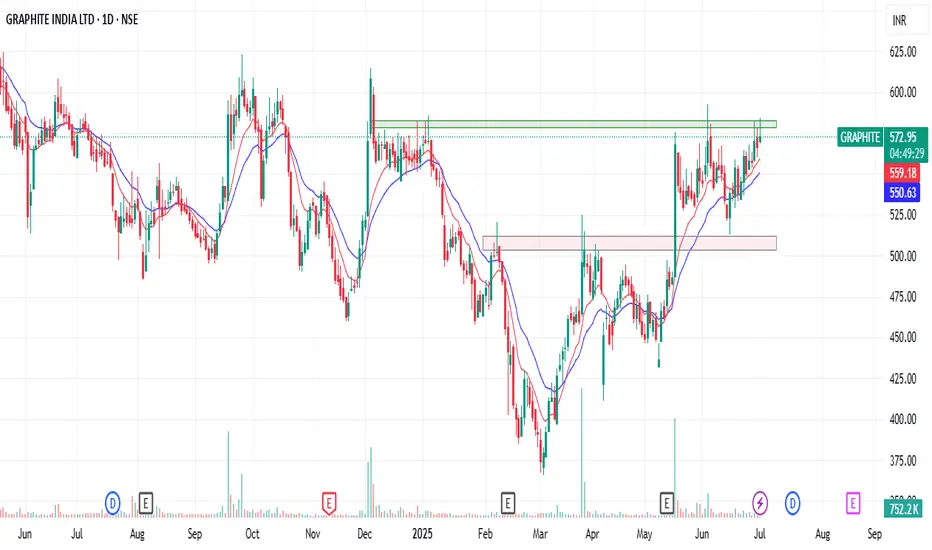
kirloskar industry looks good kirloskar industry had form a nice base and started to move on looks good will enter for target of 4000,4500

RESPONSIVE INDUSTRIESResponsive Industries Ltd. is a specialized manufacturer of vinyl flooring, synthetic leather, and luxury vinyl tiles (LVT) used in infrastructure, automotive, and lifestyle segments. It has a growing international footprint, with exports contributing significantly to its revenue mix. The stock is currently trading at INR 237.00, showing a sharp uptick on the back of strong volume and renewed investor interest.
Key Levels
Support Levels: INR 137.05, INR 164.90, INR 199.30 Swing Level: INR 237.00 Possible Upside: INR 318.95, INR 363.30, INR 419.80
Technical Indicators
RSI (Relative Strength Index): At 51.18, the RSI signals a neutral to mildly bullish setup. While not yet overextended, it hints at improving strength following recent accumulation.
Volume: At 4.66M, volume has expanded alongside price, indicating strong institutional interest and increased market participation.
Sector and Market Outlook
Responsive Industries operates in the infrastructure-linked materials and engineered surface solutions space, benefiting from:
Rising demand for affordable and decorative flooring in commercial real estate and transit hubs
Government-backed infra investment in healthcare and education facilities
Global shift toward eco-friendly, customizable vinyl solutions
Risks include exposure to PVC price volatility, logistics and export cycle sensitivity, and fluctuating margins due to competition and input costs.
Latest Developments
Export Growth: Significant volume growth reported in key geographies including Europe and Middle East
Product Innovation: Launch of high-durability and antimicrobial vinyl flooring for institutional use
Financial Performance: Operating margins improved on the back of scale efficiencies and better realization per unit
Dividend Update
Responsive Industries declared a dividend of ₹1.50 per share, reflecting improved profitability and a consistent payout policy.
Analysis Summary
Responsive Industries is gaining upward traction after a prolonged base formation. With volume expanding and indicators turning constructive, the stock appears to be transitioning into a positive trend. Supported by sector tailwinds and operational leverage, it presents a compelling case for further attention among mid-cap industrial growth names.

Endurance - Ready to RollAfter long time consolidation, this auto component maker is about to take a ride.


Balkrishna Ind- Short_Rejection from 20 DEMABalkrishna Ind- Short:
- Price rejected from 20 Daily EMA
- Enter when price is favorable in the lower timeframe
- Target: 2395
- SL: Today high or close above 20 DEMA

Hindalco Short_Near Resistance_Bearish Engulfing candleHindalco Short:
- Price near Resistance
- Bearish Engulfing Pattern
- SL: Today's High
- Target 20 DEMA
- Enter when price is favorable in lower timeframe

KIMS READY TO BREAK OUTKIMS moving in a range and now looks ready to breakout from here once moved out of this box

MRF BuyMRF jumped up taking support from its trend line. Buy @CMP (142400) with SL of 135800 and target of 150000 & 180000

Mannapuram Finance SellMannapuram Finance seems to take resistance at channel line. A lower top seems to form. Sell @CMP (275) with SL of 285 and target of 260 and 250.

AGIIL : Sniped a Long with 1% Risk on the TableDecided to enter after the market consolidated post a strong ATH breakout. Looking for a rally toward the channel’s dynamic resistance from here.
📢📢📢
If my perspective changes or if I gather additional fundamental data that influences my views, I will provide updates accordingly.
Thank you for following along with this journey, and I remain committed to sharing insights and updates as my trading strategy evolves. As always, please feel free to reach out with any questions or comments.
Other posts related to this particular position and scrip, if any, will be attached underneath. Do check those out too.
Disclaimer : The analysis shared here is for informational purposes only and should not be considered as financial advice. Trading in all markets carries inherent risks, and past performance is not indicative of future results. It’s essential to conduct your own research and assess your risk tolerance before making any investment decisions. The views expressed in this analysis are solely mine. It’s important to note that I am not a SEBI registered analyst, so the analysis provided does not constitute formal investment advice under SEBI regulations.


GILLETTE : Took a long position with 1% riskEntered right after the close of the momentum candle that broke the ATH levels. Sl is kept underneath the most recent low. Will be managing the trade depending on the momentum of the market in the coming days.
📢📢📢
If my perspective changes or if I gather additional fundamental data that influences my views, I will provide updates accordingly.
Thank you for following along with this journey, and I remain committed to sharing insights and updates as my trading strategy evolves. As always, please feel free to reach out with any questions or comments.
Other posts related to this particular position and scrip, if any, will be attached underneath. Do check those out too.
Disclaimer : The analysis shared here is for informational purposes only and should not be considered as financial advice. Trading in all markets carries inherent risks, and past performance is not indicative of future results. It’s essential to conduct your own research and assess your risk tolerance before making any investment decisions. The views expressed in this analysis are solely mine. It’s important to note that I am not a SEBI registered analyst, so the analysis provided does not constitute formal investment advice under SEBI regulations.

Paytm going to boom like Zomotoyes, as per my analaysis paytm frnd of zomoto company going to boom as per my technical i am expecting 1950 target in comming days

$NSE:NTPC : A Powerhouse with Multibagger Potential?I’ve been reviewing NTPC Ltd ( NSE:NTPC ), India’s largest power generation company, and I see promising long-term potential as the company pivots towards cleaner energy and expands capacity to support India’s growing energy needs.
Why I See Multibagger Potential
Green energy pivot: NTPC is transforming from a thermal-heavy player to a clean energy leader — the transition opens huge long-term value.
Undemanding valuation: Despite the growth visibility, NTPC trades at reasonable PE and PB multiples, offering valuation comfort.
Policy tailwinds: Strong government focus on energy security, renewables, and electrification will continue to favor NTPC.
Execution strength: NTPC has a long history of successfully executing large-scale projects on time and within budget.
Just Accumulate near it best support Green AREA !
oNLY IN cASH
tHANKS

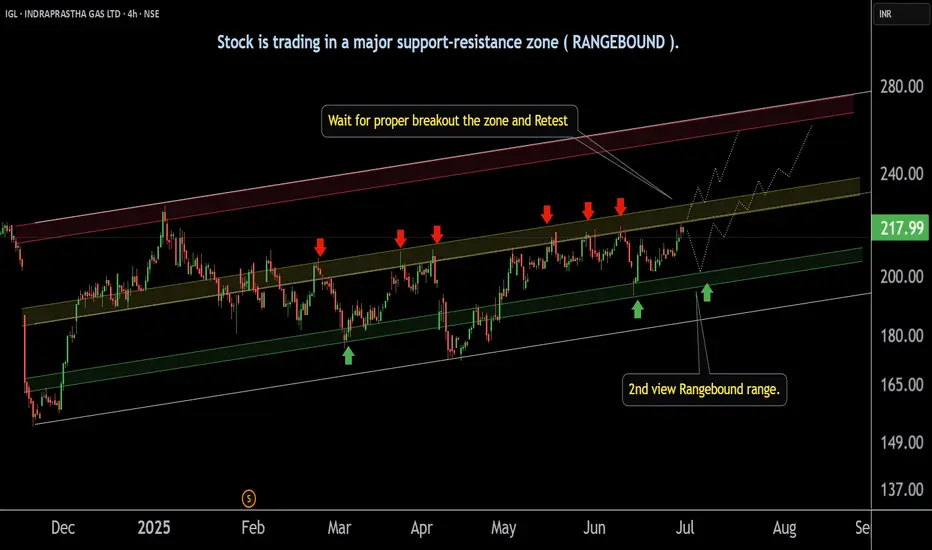
INDRAPRASTHA GAS ' s Support zone | Breakout level |This is the 4 hour chart of INDRAPRASTHA GAS .
IGL is moving in a well defined parallel channel with support range near at 195-200 level.
Igl having good law of polarity at 230 range if Igl give breakout this level and sustain above this level next resistance is near 260 and 280 .
Thank you !!
63 Moons PLAN FOR FUTURE INVESTMENTThanks for stopping by.
All analysis here is done strictly from an investor’s perspective — focusing on risk, return, valuation, and potential upside.
The notes cover key details. I’ve backed every thesis with my own analysis — no fluff, just what matters to investors.
If you find the idea useful or have suggestions, feel free to leave a comment. Always open to fresh insights.
Kind regards,
Psycho Trader

KNRCON INVESTOR'S ANALYSISThanks for stopping by.
All analysis here is done strictly from an investor’s perspective — focusing on risk, return, valuation, and potential upside.
The notes cover key details. I’ve backed every thesis with my own analysis — no fluff, just what matters to investors.
If you find the idea useful or have suggestions, feel free to leave a comment. Always open to fresh insights.
Kind regards,
Psycho Trader
