highest ever weekly close : breakout on chartsHPCL witnessed its highest ever weekly frame close with a clean clear breakout
volumes are healthy with stock clocked more than 11% jump last week.
rsi witnessed healthy improvement and suggest the momentum to continue

ATGL: RSI improved significantly, good R:R Stock near a multi-tested support and witnessed a sharp move last week
the momentum indicator RSI indicates strength.
risk reward seems healthy for bulls with enough room for stock to inch higher

RAIN INDUSTRIES ' s Key Support Zone This is the one hour chart of RAIN INDUSTRIES.
Rain Industries is moving within an ascending parallel channel with support around 140 range and resistance around 160 range.
If this level is sustain , then we may see higher prices in the
Rain Industries
Thank You !!

Ye Chart Kuch Kehta Hai - Prime Focus LimitedPrime Focus Ltd’s stock shows strong technical momentum on the monthly chart, supported by high volume, price above key moving averages, and positive price forecasts. Fundamentally, the company’s leadership in media post-production, expanding digital solutions, and improving operating margins underpin its growth potential despite some profitability challenges. These factors combined suggest a favorable outlook for the stock’s growth in the near to medium term.
Technical Rationale (Monthly Chart)
Strong Uptrend Momentum: The stock price recently surged nearly 20% in a single day, closing at ₹136.83, well above its 50-day average (~₹108.7) and 200-day average (~₹118.1), indicating strong bullish momentum on the monthly scale.
Volume Surge: The volume of over 20 million shares traded is significantly higher than the average volume (~694,580), suggesting strong buying interest and potential continuation of the upward trend.
Price Recovery from Lows: The stock has rebounded from a low of ₹85 to current levels near ₹137, showing a recovery phase that often precedes further gains on monthly charts.
Positive Price Targets: Forecasts indicate a bullish trend with mid-year 2025 targets around ₹137.61 and year-end targets near ₹160, supporting the technical outlook for continued growth.
Fundamental Rationale
Market Position and Business Model: Prime Focus Limited is a global player in media and entertainment post-production services, including visual effects, 3D conversion, and cloud-based media solutions, serving major Hollywood studios, OTT platforms, and broadcasters. This diversified service portfolio positions it well in a growing digital content market.
Revenue and Operating Profit: Despite some volatility, the company reported strong operating profit margins recently (22% in FY2025) and operating profit of ₹786 crore, indicating operational efficiency improvements.
Growth Prospects: The company’s digital transformation offerings (CLEAR cloud media ERP suite) and global footprint across 18 cities enhance its growth potential in the expanding entertainment technology sector.
Valuation and Intrinsic Value: The stock currently trades at a premium of about 63% over its median intrinsic value estimates, reflecting positive market sentiment and growth expectations.
Return Ratios and Challenges: While ROE remains negative (-15.8%) and sales growth has been modest (4.21% over 5 years), the improving operating margins and strategic investments in technology could drive future profitability and shareholder returns.
Promoter Holding and Market Cap: Promoter holding slightly decreased recently but remains significant, and the market cap stands around ₹4,240 crore, indicating a mid-cap stock with room for institutional interest and growth.

Ye Chart Kuch Kehta Hai - IDFC First BankThe weekly technical chart for IDFC First Bank (NSE:IDFCFIRSTB) indicates a positive outlook for the stock due to several key factors:
Strong Buy Signals from Moving Averages: All major moving averages (5, 10, 20, 50, 100, and 200 periods) are signaling a "Buy" on the weekly chart, reflecting strong upward momentum and trend strength.
Positive RSI and MACD Indicators: The Relative Strength Index (RSI) stands at around 57.4 on the weekly scale, which is in a healthy bullish zone below overbought levels, suggesting room for further upside. The MACD is also positive, reinforcing bullish momentum.
Support from Ultimate Oscillator and Other Indicators: The Ultimate Oscillator reading is above 50, indicating buying pressure. Although some oscillators like CCI and ADX show mixed signals, the overall technical consensus leans bullish.
Price Above Key Pivot Points and Supports: The current price is trading above key pivot levels and support zones, which typically act as strong floors for price action and reduce downside risk.
Recent Price and Volume Trends: The stock price has risen about 4.58% over the past week and 6.12% over the last month, indicating sustained buying interest. Mutual fund holdings have also increased recently, which often supports price appreciation.
Analyst Sentiment and Growth Indicators: Over 50% of analysts recommend a "Buy" rating with an average target price near current levels, reflecting confidence in the stock’s growth potential. The company has shown consistent revenue growth and outperformance relative to peers in recent quarters.
In summary, the weekly technical chart for IDFC First Bank shows a confluence of bullish signals from moving averages, momentum indicators, and price action, supported by positive market sentiment and fundamental growth trends. This technical setup suggests a likely upward movement in the stock price in the near term on a weekly basis

BANCOINDIA - Earnings Gap up (EP)
- Strong prior buying force
- Narrow range consolidation near ATH
- Volume dry up
- Small SL , High R:R

Ye chart Kuch Kehta Hai - Jio Financial Jio Financial Services stock shows strong potential for growth on the weekly technical chart based on multiple technical indicators and moving averages signaling bullish momentum:
Strong Buy Signals Across Moving Averages: All key moving averages (5, 10, 20, 50, 100, and 200-day SMAs and EMAs) are indicating a "Buy" or "Strong Buy" signal, reflecting sustained upward price momentum over various time frames.
Bullish Technical Indicators: Indicators such as MACD, ADX, CCI, ROC, and Ultimate Oscillator are all showing buy signals, supporting a positive trend continuation. For example, MACD is positive and rising, ADX at 46.6 indicates a strong trend, and CCI at 177.7 confirms bullish momentum.
Overbought but Strong Momentum: Although the RSI (14) is overbought at 81.3, which typically signals caution, in strong trending markets this can indicate continued strength rather than an immediate reversal.
Price Action and Pivot Levels: The stock price is currently above key pivot points and resistance levels, with classic pivot resistance around 329-335 levels, suggesting room for further upward movement before significant resistance is encountered.
Recent Price Performance: Jio Financial has gained nearly 10% in the past week and over 11% in the last month, demonstrating strong recent buying interest and momentum.
Volatility and Volume Support: The ATR (Average True Range) indicates high volatility, which can fuel strong price moves, and the Bull/Bear Power indicator confirms buyers' dominance.
In summary, the weekly technical chart for Jio Financial Services reflects a robust bullish setup with multiple moving averages and momentum indicators aligned on the buy side, supported by recent strong price gains and favorable pivot levels. This technical landscape suggests a high probability of continued price appreciation in the near term on the weekly timeframe

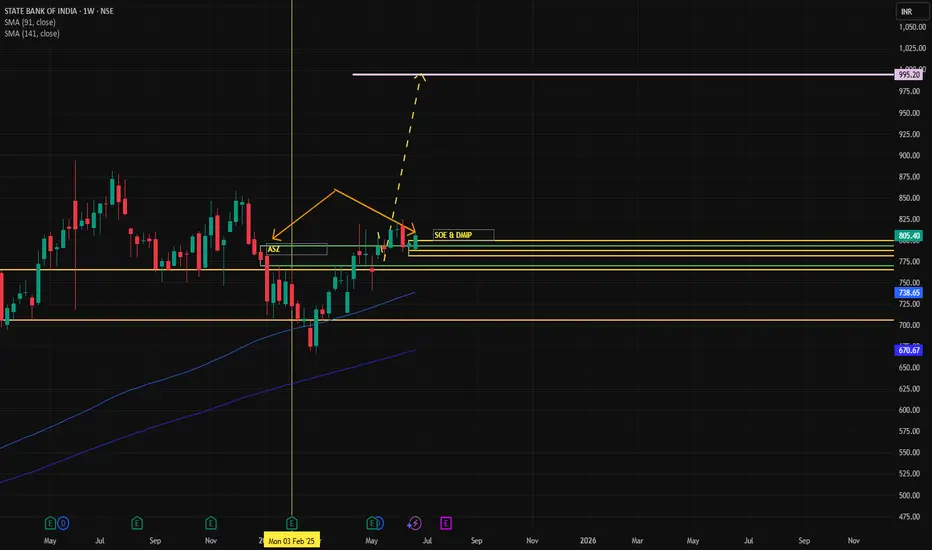
SBIN📝 Trade Plan
Position: Long (Buy)
Entry: 800
Stop Loss: 757
Risk: 43 points
Target: 1256
Reward: 456 points
Risk-Reward (RR): 10.6 – Excellent
✅ Multi-Timeframe Trend & Demand Zone Alignment
Zone Trend Demand Logic Avg Demand Zone
HTF UP RBR, BUFL 650
MTF UP RBR, DMIP, SOE, BUFL 762
ITF UP DMIP, BUFL 785
Trade Point Avg 732
This shows full timeframe alignment (HTF, MTF, ITF) in UP trend, strengthening the case for a long trade.
✅ Key Trade Logics – Highlights
Quarterly Demand (BUFL) is being respected.
Weekly ASZ previously formed at 793 – now engulfed with DMIP + SOE at 799 → Strong Demand.
Price trading above Gann Level of 766 → Bullish confirmation.
Entry at 800 is just above all critical demand structures (DMIP, BUFL, ASZ).
✅ Technical Observations
Last High = 894 → Short-term resistance.
Target = 1256 → Ambitious but possible if structure breakout confirms.
Last Low = 666 → Strong swing low. SL at 780 protects this level.
⚠️ Considerations / Watch Points
Immediate Resistance: ₹894 (last high); could act as short-term hurdle.
Gap Risk: Entry very close to Weekly demand zone (780–800) – be cautious of volatile retests.
Target Realism: ₹1256 may require a multi-week/month hold; consider scaling out partially at swing levels (e.g., ₹894, ₹975, ₹1050).
Reconfirm with Volume: Check for breakout with rising volumes above 800 and around 894 zone.
✅ Verdict
This is a strong, high-conviction trade setup with:
Perfect MTF Trend Alignment
Tightly defined risk
Excellent R:R ratio
Strong structural demand support
HIND motors- My Pick - No AdviceReason for Picking - first support in 50 MA after goldencross alinging with previous resistance turning support. A very simple trade idea. simplicity works best. Bullish Hammer Candle followed byback to back inside bars. A break above Rs. 30 with good volume, is what I am looking for making the entry.

BDL - MY PICK - No AdviceBDL - the defence sector stock, is in strong uptrend. it corrrected slightly to about 14% and has also grabbed liduidity and had taken support with 2 time the delivery volumes. Its now ready for new high with strong momentum

BSE breaking the channelAs the analysis is showing it has breaked the channel and retested support moving towards downward level 2326
Narayana Hrudayalaya - Strong Fundamental & TechnicalFundamental plus Technical Analysis on a Financially Strong Company:
Narayana Hrudalaya Ltd is engaged in providing economical healthcare services. It has a network of multispecialty and super specialty hospitals spread across multiple locations.
Focus
Company plans to add 700 plus beds for the next 3-4 years at Bangalore Health City. It intends to invest upto Rs. 1,000 Cr in the West Bengal for setting up a superspecialty hospital.
Capex Plan
Company has planned a total capex of 1136 Cr for FY24 and till Q3 FY24 it has spent 477 Cr.
Stock P/E - 31.7
Industry PE - 56.3
EPS growth 5Years - 67.8 %
Buy Score - 4.56 (Buy Score above 0 for me, is considered very good and above 1, excellent.)
ROCE 5Yr - 19.6 %
Please note that this idea is meant to spread awareness and should NOT be considered a buy recommendation. Do your own research before making any financial commitments.

Jio Financials Inverse Head & ShoulderThere is a developing pattern on the charts of Jio Financials.
The levels are marked clearly.
This is to spread awareness and pass my technical analysis learnings.
Conduct your own research before taking any financial decision.

Shemaroo Breakout Watch | Near 200-DMA ResistanceShemaroo Entertainment (NSE: SHEMAROO) is showing strong bullish momentum and has recovered sharply from ₹88 levels to ₹126.84. The stock is now testing the 200-Day Moving Average resistance.
📊 Technical Analysis:
• Trading near long-term 200-DMA (trend decider)
• RSI is strong but not overbought yet
• Volume increasing — suggests accumulation
🔹 Key Levels:
• Resistance: ₹128–₹132
• Breakout Above: ₹132
• Support Zone: ₹118–₹120
🎯 Targets post-breakout:
• Target 1: ₹145
• Target 2: ₹160
🚫 Stoploss: ₹117
⸻
⚠️ Disclaimer:
This is not investment advice. I am not a SEBI-registered advisor. This analysis is shared only for educational and informational purposes. Please consult your financial advisor before making any investment.

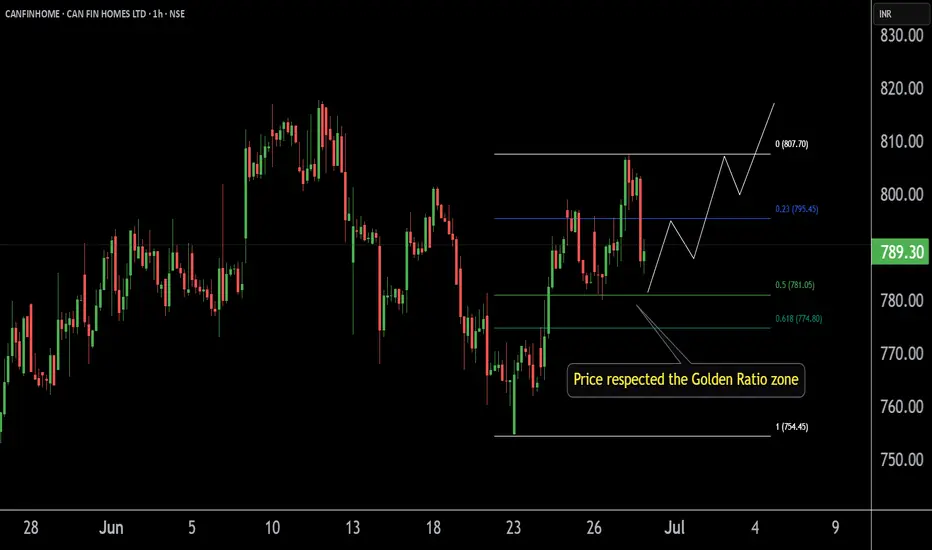
CANFINHOME'S Key ZoneThis is the 1 hour chart of CANFINHOME.
Canfinhome is taking support at the Fibonacci Golden Ratio zone.
If this zone is sustain then we may higher price in CANFINHOME .
Thank You !!
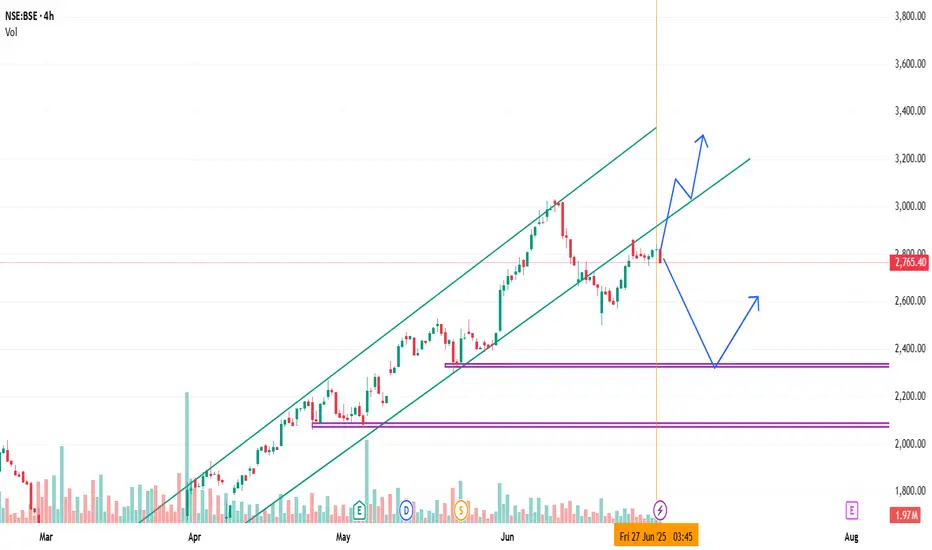
NSE:TATACONSUM CHART PATTERN ANALYSIS🔍 Chart Pattern Analysis:
Pattern Identified: Bullish Flag
Pole: The sharp move up from March to early May.
Flag: The downward-sloping parallel channel (purple lines) forming from mid-May to late June.
Breakout Zone: Price has approached the upper boundary of the flag, suggesting a potential breakout.
📊 Volume Analysis:
Volume increased during the flagpole (strong buying).
Volume decreased during consolidation in the flag (healthy sign for a flag pattern).
A volume spike during breakout (not yet seen) would confirm bullish momentum.
📈 Price Projection:
Based on the flagpole height:
Pole height: Approx. ₹1060 to ₹1245 = ₹185
Breakout level: Around ₹1150
Target: ₹1150 + ₹185 = ₹1335
Your chart already shows a projected upward move towards the ₹1,350–₹1,400 region, aligning with this measured move.
✅ Bullish Confirmation Signals:
Price nearing breakout above the flag.
Strong trend from earlier (bullish continuation expected).
Breakout may lead to quick momentum-driven gains.
⚠️ Risks & Invalidations:
Breakdown below flag support (~₹1,080) invalidates the pattern.
Bearish candle near breakout zone without volume can indicate a fakeout.
Broader market weakness may weigh on follow-through.
📝 Conclusion:
This is a bullish continuation pattern (flag).
A breakout above ₹1,160 with volume confirms an upward target of ₹1,330–1,400.
Ideal entry: On breakout with volume.
Stop-loss: Below ₹1,080 (flag low).
Let me know if you’d like a Pine Script for this pattern or volume-based alerts for breakout confirmation.

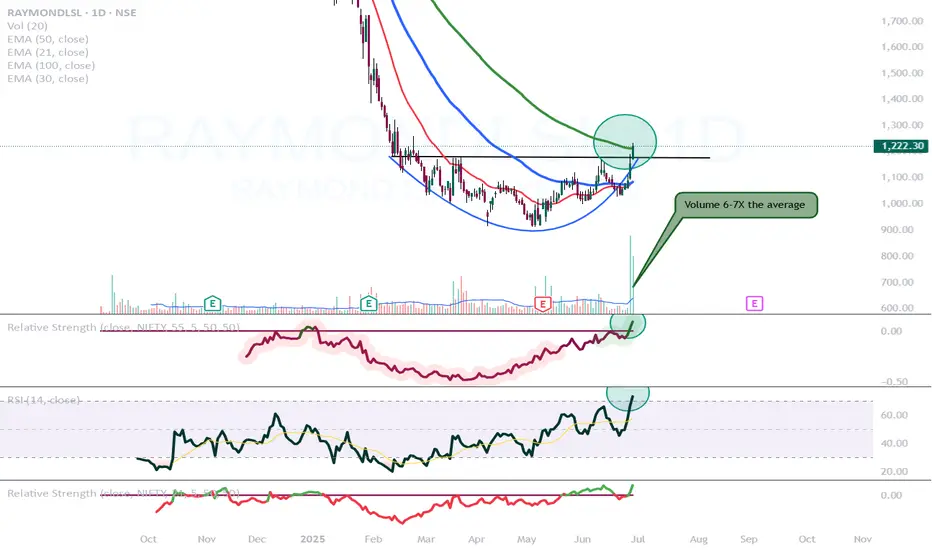
Raymond Lifestyle is looking good!NSE:RAYMONDLSL
- After a 5 month long consolidation now breaking out.
- This is looking like a stage 2 breakout.
- Relative strength turned positive.
- RSI is above 70 indicating very high momentum
- Volume is also very good on the break out candle. Also we can observe that volume is higher on the green candles and lower on the red ones.
- Today it closed above its 100 day exponential moving average as well.
COCHINSHIP SWING ANALYSIS ( 25% Upside )COCHINSHIP SWING ANALYSIS ( 25% Upside )
Thanks for stopping by
Regards
PsychoTrader

HDFC Life Insurance Buy27-Jun-2025 (Friday)
HDFC Life Insurance reversed taking support from channel line as well as it previous ATH. Seems to make false breakdown and reversed upside to new ATH. Buy @CMP (807) with SL of 770 and target of 840-860

HDFC Asset Management Buy27-Jun-2025 (Friday)
HDFC Asset Management bounced back from trend line. Also it tested previous ATH as support and reversed upwards. Buy @CMP (5150) with SL of 4860 and target of 5250, 5550-5600 & 6900

HDFC Bank BuyHDFC Bank bounced back from its trend line. also break above a consolidating range. Buy @CMP (2015) with SL of 1960 and a target of 2500.

JYOTICNC Swing Analysis ( Holding 3-6 Months, 20% Upside )JYOTICNC Swing Analysis ( Holding 3-6 Months, 20% Upside )
Thanks for Stopping By.
Regards
PsychoTrader