Hindustan Unilever looks strong. Hindustan Unilever Ltd. engages in the manufacture of consumer goods. It operates through the following segments: Home Care, Beauty and Personal Care, Foods and Refreshments, and Others. It is one of leading company in FMCG sector.
Hindustan Unilever Closing price is 2453.60. Dividend Yield @CMP = 1.78%. The positive aspects of the company are Stocks Outperforming their Industry Price Change in the Quarter, Companies with Zero Promoter Pledge, Company able to generate Net Cash - Improving Net Cash Flow for last 2 years, FII / FPI or Institutions increasing their shareholding and MFs increased their shareholding last quarter. The Negative aspects of the company are high Valuation (P.E. = 53.9), Increasing Trend in Non-Core Income, Declining Revenue every quarter for the past 2 quarters and PEG greater than Industry PEG.
Entry can be taken after closing above 2460 Historical Resistance in the stock will be 2498 and 2534. PEAK Historic Resistance in the stock will be 2571 and 2601. Stop loss in the stock should be maintained at Closing below 2391 or 2369 depending upon your risk taking ability.
Disclaimer: The above information is provided for educational purpose, analysis and paper trading only. Please don't treat this as a buy or sell recommendation for the stock or index. The Techno-Funda analysis is based on data that is more than 3 months old. Supports and Resistances are determined by historic past peaks and Valley in the chart. Many other indicators and patterns like EMA, RSI, MACD, Volumes, Fibonacci, parallel channel etc. use historic data which is 3 months or older cyclical points. There is no guarantee they will work in future as markets are highly volatile and swings in prices are also due to macro and micro factors based on actions taken by the company as well as region and global events. Equity investment is subject to risks. I or my clients or family members might have positions in the stocks that we mention in our educational posts. We will not be responsible for any Profit or loss that may occur due to any financial decision taken based on any data provided in this message. Do consult your investment advisor before taking any financial decisions. Stop losses should be an important part of any investment in equity.

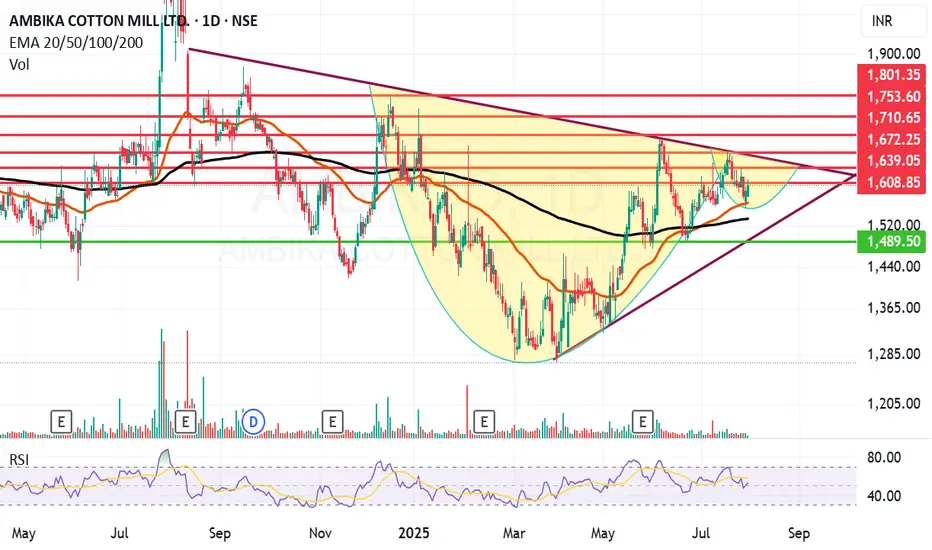
Ambika Cotton looking ambitious on the charts and fundamentally.Ambika Cotton Mills Ltd. engages in the provision of manufacturing and selling of cotton yarn catering to the needs of manufacturers of premium branded shirts and t-shirts.
Ambika Cotton Mills Ltd. Closing price is 1603.20 Dividend Yield @CMP = 2.35%. The positive aspects of the company are attractive Valuation (P.E. = 13.9), Stocks Outperforming their Industry Price Change in the Quarter, Companies with Zero Promoter Pledge, Companies with Low Debt, Rising Net Cash Flow and Cash from Operating activity and FII / FPI or Institutions increasing their shareholding. The Negative aspects of the company are Increasing Trend in Non-Core Income, Fall in Quarterly Revenue and Net Profit (YoY) and Companies with growing costs YoY for long term projects.
Entry can be taken after closing above 1609 Historical Resistance in the stock will be 1631, 1672 and 1710. PEAK Historic Resistance in the stock will be 1753 and 1801. Stop loss in the stock should be maintained at Closing below 1533 or 1489 depending upon your risk taking ability.
Disclaimer: The above information is provided for educational purpose, analysis and paper trading only. Please don't treat this as a buy or sell recommendation for the stock or index. The Techno-Funda analysis is based on data that is more than 3 months old. Supports and Resistances are determined by historic past peaks and Valley in the chart. Many other indicators and patterns like EMA, RSI, MACD, Volumes, Fibonacci, parallel channel etc. use historic data which is 3 months or older cyclical points. There is no guarantee they will work in future as markets are highly volatile and swings in prices are also due to macro and micro factors based on actions taken by the company as well as region and global events. Equity investment is subject to risks. I or my clients or family members might have positions in the stocks that we mention in our educational posts. We will not be responsible for any Profit or loss that may occur due to any financial decision taken based on any data provided in this message. Do consult your investment advisor before taking any financial decisions. Stop losses should be an important part of any investment in equity.
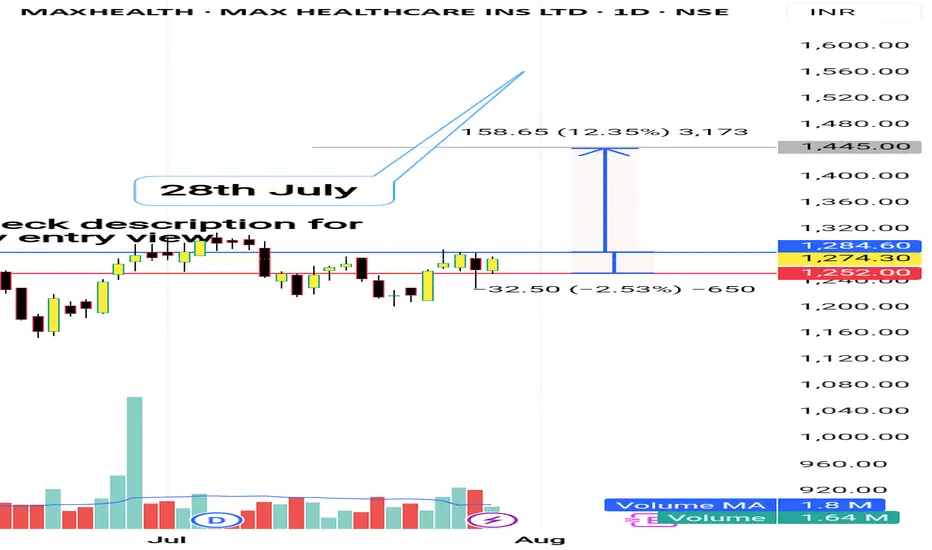
MAX HEALTH
I'm not a SEBI REGISTERED ANYLISIS
just for learning purpose
above the blue line close in D chart candle i will buy and put strictly SL to below red line...once candle close below Red line in D chart...i will close the Trade...
Note: 1
Breakout candle should close time..3.25pm..and 6 or below 6 points I will buy same day or I will wait for the blue line price to re-trace)
Note:2
If previous volume is buyers(for ex 10k) Breakout candle volume should be low in present day with buyers volume(below 10k for example 9k like this)
check the video for more details in playlist
target check the chart
WAIT FOR ENTRY......then after
WAIT FOR TARGET...... or
WAIT FOR STOPLOSS
educational purpose only
oits simple ORB WITH VOLUME BREAKOUT STRATEGY...with small condition apply for selecting the stocks
owt not response for your profit and loss
Under Article 19(1)(a) of the Indian Constitution, this content is an exercise of the fundamental right to freedom of speech and expression. It is for informational purposes only and should not be interpreted as professional financial advice or an endorsement of any strategy or approach.
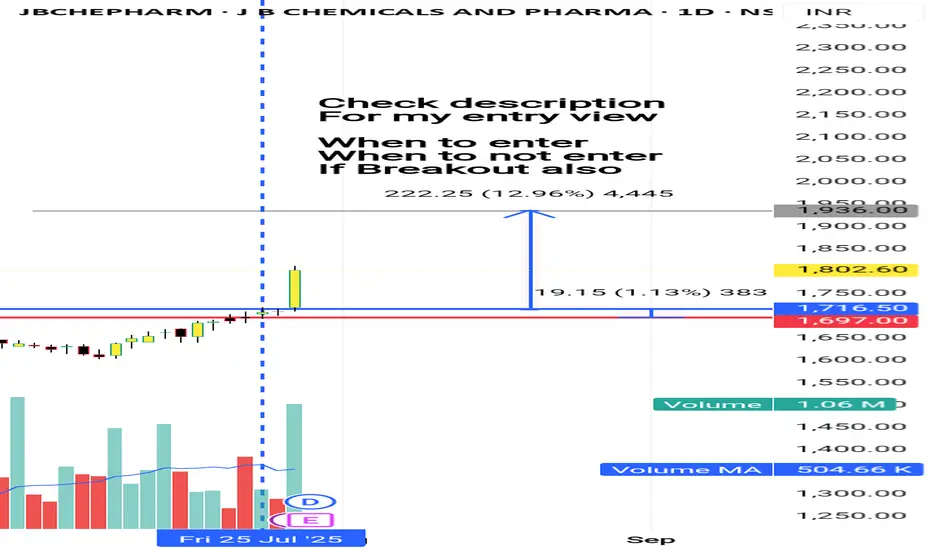
JBCHEMP AND PHARMA
I'm not a SEBI REGISTERED ANYLISIS
just for learning purpose
above the blue line close in D chart candle i will buy and put strictly SL to below red line...once candle close below Red line in D chart...i will close the Trade...
Note: 1
Breakout candle should close time..3.25pm..and 6 or below 6 points I will buy same day or I will wait for the blue line price to re-trace)
Note:2
If previous volume is buyers(for ex 10k) Breakout candle volume should be low in present day with buyers volume(below 10k for example 9k like this)
check the video for more details in playlist
target check the chart
WAIT FOR ENTRY......then after
WAIT FOR TARGET...... or
WAIT FOR STOPLOSS
educational purpose only
oits simple ORB WITH VOLUME BREAKOUT STRATEGY...with small condition apply for selecting the stocks
owt not response for your profit and loss
Under Article 19(1)(a) of the Indian Constitution, this content is an exercise of the fundamental right to freedom of speech and expression. It is for informational purposes only and should not be interpreted as professional financial advice or an endorsement of any strategy or approach.
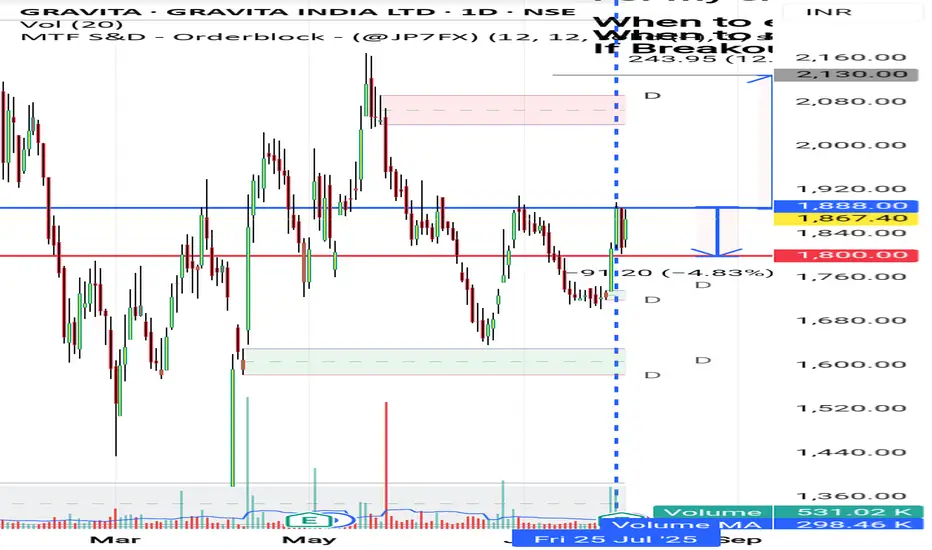
Gravita
I'm not a SEBI REGISTERED ANYLISIS
just for learning purpose
above the blue line close in D chart candle i will buy and put strictly SL to below red line...once candle close below Red line in D chart...i will close the Trade...
Note: 1
Breakout candle should close time..3.25pm..and 6 or below 6 points I will buy same day or I will wait for the blue line price to re-trace)
Note:2
If previous volume is buyers(for ex 10k) Breakout candle volume should be low in present day with buyers volume(below 10k for example 9k like this)
check the video for more details in playlist
target check the chart
WAIT FOR ENTRY......then after
WAIT FOR TARGET...... or
WAIT FOR STOPLOSS
educational purpose only
oits simple ORB WITH VOLUME BREAKOUT STRATEGY...with small condition apply for selecting the stocks
owt not response for your profit and loss
Under Article 19(1)(a) of the Indian Constitution, this content is an exercise of the fundamental right to freedom of speech and expression. It is for informational purposes only and should not be interpreted as professional financial advice or an endorsement of any strategy or approach.
prediction on VBL Strong support on right time with consolidation Long time but as per fundamental good pick

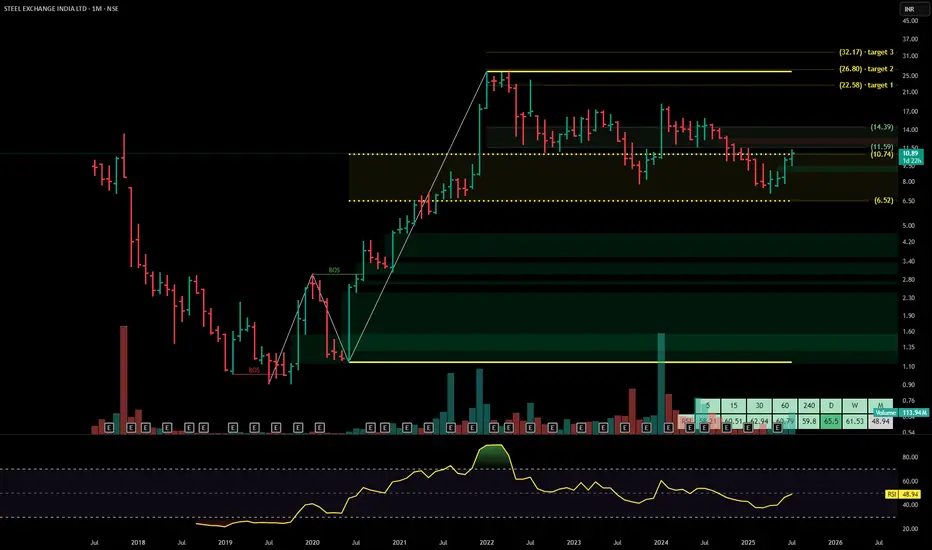
SSTEEL EXCHANGE INDIA Steel Exchange India Ltd. is a mid-sized integrated steel manufacturer, producing billets, TMT bars, and structural steel. The company operates across Andhra Pradesh with backward integration through captive power and sponge iron capacity. It serves construction, infrastructure, and industrial clients through its Vizag Steel vertical. The stock is currently trading at ₹10.89.
Steel Exchange India Ltd. – FY22–FY25 Snapshot
Sales – ₹814 Cr → ₹860 Cr → ₹918 Cr → ₹982 Cr – Gradual expansion driven by volume growth and demand
Net Profit – ₹39.6 Cr → ₹45.3 Cr → ₹50.6 Cr → ₹56.4 Cr – Steady earnings growth through efficiency and pricing Company Order Book – Moderate → Strong → Strong → Strong – Consistent inflow from infra-linked segments Dividend Yield (%) – 0.00% → 0.00% → 0.00% → 0.00% – No payouts, reinvestment-focused strategy
Operating Performance – Moderate → Strong → Strong → Strong – Margin stability supported by captive power Equity Capital – ₹53.68 Cr (constant) – No dilution, lean capital base
Total Debt – ₹190 Cr → ₹180 Cr → ₹168 Cr → ₹155 Cr – Controlled deleveraging from operational cash flows
Total Liabilities – ₹310 Cr → ₹325 Cr → ₹340 Cr → ₹356 Cr – Scaling modestly with demand
Fixed Assets – ₹145 Cr → ₹153 Cr → ₹160 Cr → ₹168 Cr – Capex directed toward plant modernization and efficiency upgrades
Latest Highlights FY25 net profit rose 11.5% YoY to ₹56.4 Cr; revenue increased 7.0% to ₹982 Cr EPS: ₹1.05 | EBITDA Margin: 14.9% | Net Margin: 5.74% Return on Equity: 12.34% | Return on Assets: 9.81% Promoter holding: 59.44% | Dividend Yield: 0.00% Operational efficiency gains from captive power and logistics optimization Rural infra and housing demand driving uptick in TMT segment volumes
Institutional Interest & Ownership Trends Promoter holding remains stable at 59.44% with no pledging or dilution. FII interest is minimal given the mid-cap profile, while HNI accumulation is visible across recent delivery spikes. Institutional exposure remains niche, centered around infra-allocation and value opportunities in commodity-linked verticals.
Business Growth Verdict Yes, Steel Exchange India is growing steadily across core product lines Margins supported by integration and volume expansion Debt is declining steadily with earnings momentum Capex remains efficient and supports operational improvement
Company Guidance Management projects single-digit revenue growth in FY26 driven by product mix enhancement and improved capacity utilization. Margin profile expected to remain consistent due to backward integration and demand visibility from infrastructure.
Final Investment Verdict Steel Exchange India Ltd. presents a modest yet efficient growth story in India’s steel sector. Its improving margin profile, steady earnings, and conservative capital structure make it suitable for gradual accumulation. The company’s core focus on integrated operations and infra-led volumes provides a base for value creation, appealing to investors seeking mid-cap manufacturing exposure in commodity-driven sectors.
Positional setup and tweet-ready summary for Pondy Oxides & Chem🧪 Technical Analysis (Daily & Weekly Setup)
Trend & Moving Averages: Price is trading above the 5‑, 9‑, and 13‑period EMAs, indicating a clear bullish momentum. EMAs are aligned upward, suggesting trend continuation.
Support & Resistance Zones: Immediate support lies around ₹1,100‑₹1,150 (recent consolidation). Strong resistance lies at ₹1,180‑₹1,190 (near 52-week high).
Supertrend: On a daily timeframe with default settings (10, 3), price is clearly above the indicator, showing robust bullish sentiment.
Entry Zone: ₹1,130‑₹1,150 is an optimal buy zone if price retraces to the EMA cluster or previous support.
Targets & Stop-loss: Target near ₹1,180‑₹1,190, stop-loss just below ₹1,100.
📊 Fundamental Snapshot
Sourced from Screener, Moneycontrol, Trendlyne, and other consolidated data:
Market Cap: ₹3,200–3,300 Crore
Revenue (TTM): ₹2,215 Cr | Net Profit: ₹70–78 Cr
Valuation:
P/E ratio around 45×–47×
P/B ~ 5.3×–5.4×
Screener
StockAnalysis
Margins & Returns:
ROE ~ 12–13%, ROCE ~ 15–16%
Net Profit Margin ~ 3.2%, Operating Margin ~ 5–6%
Solvency & Strength:
Debt-Equity ratio ~ 0.3 (consolidated) — low debt
Altman Z‑Score ~ 17–18, indicating strong financial health
Smart Investing
Growth Momentum:
Revenue growth ~33–36% YoY; Net profit jump ~82% YoY in recent quarter
Quarterly PAT up nearly 90%, revenue up 36% YoY in Q1 FY26
✅ Summary & Trade Plan
Aspect Insight
Technical Bias Bullish with strong EMA structure and Supertrend confirmation
Entry Zone ₹1,130–₹1,150
Target ₹1,180–₹1,190
Stop-Loss Below ₹1,100
Valuation Alert Stock trades expensive at 45×–47× P/E vs market average
Fundamental Strength Healthy margins, improving profits, low debt, strong solvency metrics
Overall, POCL exhibits robust technical momentum backed by fundamental growth, though valuation remains rich. Risk-reward is favorable within the ideal entry zone, with a tight stop-loss discipline.

Positional setup for Zuari Agro Chemicals Ltd (NSE: ZUARI)📈 Technical Analysis (Daily Chart)
Current Price: ~₹248
Resistance Zone: ₹238–248 (recent breakout with strong volume)
Support: ₹220 (recent consolidation zone)
EMA 5‑9‑20: Bullish alignment with price above all three
Trend: Price has broken out of sideways base on rising volume, showing renewed strength and momentum
🎯 Trade Plan:
Entry: ₹250–252 (above resistance)
Stop-Loss: ₹220 (below previous swing low)
Target: ₹270 → ₹290
Risk-Reward: ~1:2 to 1:3, favorable for positional trades
🧾 Fundamental Overview
(Source: Screener, StockAnalysis, Smart‑Investing, GuruFocus)
Market Cap: ₹1,044 Cr
P/E: ~6.3×
P/BV: ~0.56×
ROCE: ~10–13%
ROE: ~9%
Revenue (TTM): ₹4,436 Cr
Net Profit (TTM): ₹231 Cr
Growth (5‑yr sales CAGR): ~7.8% (slower growth)
Dividend Yield: ~0%
Key Points: Low valuation, good asset base, decent profitability, limited growth, and no dividend payout
Pros: Attractive valuation, steady profit, improving margins, strong parentage in Adventz group
Cons: Low dividend yield, modest growth, other income influenced profits
🧠 Summary
ZUARI has delivered a strong breakout from the ₹238–248 zone with volume spike and EMA support, paired with favorable fundamentals — low valuation and solid return ratios—positioning it well for a positional swing setup.

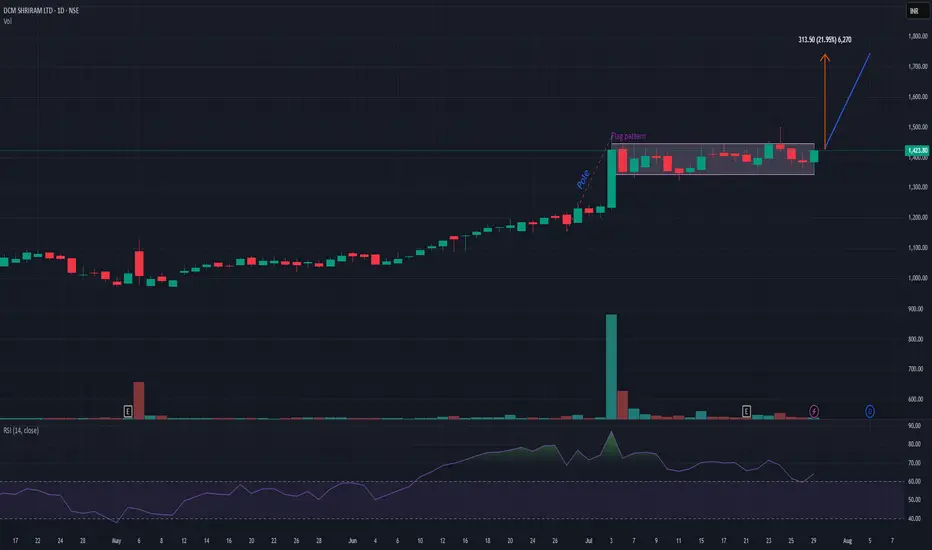
DCMSHRIRAMDCMSHRIRAM is on verge of flag pattern breakout provided that it closes above 1440 level. It has a potential to add up to 20-22% from this level. My view may change if it closes below 1350. Risk-reward is quite in favor. Keep it on radar.
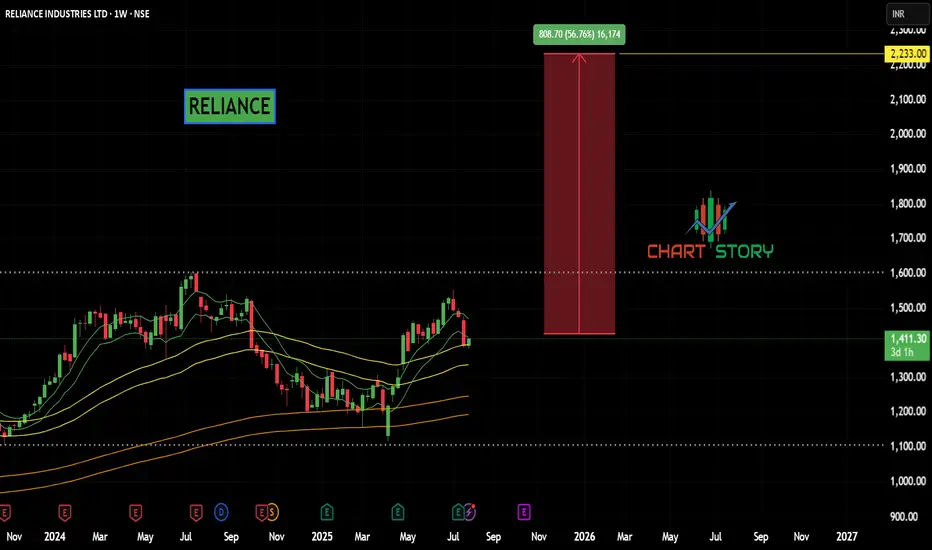
RELIANCE - PARABOLIC BUYNSE:RELIANCE Weekly parabolic formation may continue further upward trend for short to mid term.
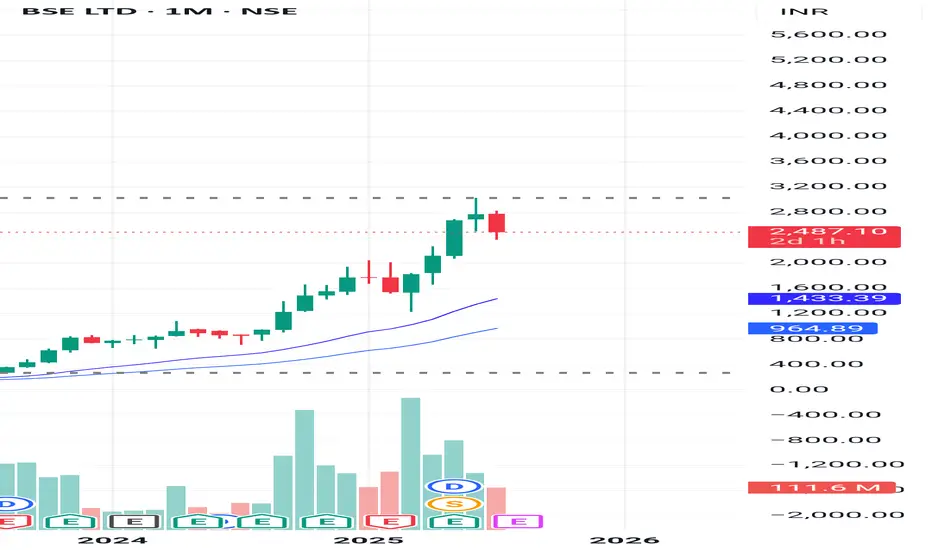
DCF VALUATION ANALYSIS OF BSEConclusion: OVERVALUED
:-OVERVIEW
BSE Limited has shown strong financial growth in recent years. Its revenue jumped from ₹924.84 crore in FY23 to ₹1,592.50 crore in FY24 (a 72% increase), and further surged to ₹3,212 crore in FY25, doubling year-on-year. EBITDA grew impressively to ₹1,779 crore in FY25 with a 60% increase, and EBIT reached ₹1,670 crore, up 56%. Net profit also rose significantly to ₹1,112 crore, with earnings per share increasing to ₹81. Dividend per share improved to ₹23, reflecting healthy returns
DCF:
-The valuation was performed using a Discounted Cash Flow (DCF) approach based purely on verified financial data and market risk parameters without relying on user-specific growth assumptions.
-The cost of equity was calculated using an adjusted risk-free rate plus equity risk premium multiplied by beta, resulting in a discount rate of approximately 13.58%. The terminal growth rate was conservatively taken as 4%. Using these reliable inputs and actual EBIT cash flows, the intrinsic enterprise value was estimated at around ₹36,839 crore, translating to an intrinsic value per share of approximately ₹1,364.
-Currently, BSE’s market price is around ₹2,480 per share, which is substantially higher than the intrinsic value derived from fundamentals, indicating the stock is trading at a significant premium. This valuation is grounded in audited company financials and globally accepted valuation methodologies, providing a trustworthy reference point for investors.
HIND RECTIFIERS LTD Support and Resistance Levels:
Support Levels: These are price points (green line/shade) where a downward trend may be halted due to a concentration of buying interest. Imagine them as a safety net where buyers step in, preventing further decline.
Resistance Levels: Conversely, resistance levels (red line/shade) are where upward trends might stall due to increased selling interest. They act like a ceiling where sellers come in to push prices down.
Breakouts:
Bullish Breakout: When the price moves above resistance, it often indicates strong buying interest and the potential for a continued uptrend. Traders may view this as a signal to buy or hold.
Bearish Breakout: When the price falls below support, it can signal strong selling interest and the potential for a continued downtrend. Traders might see this as a cue to sell or avoid buying.
MA Ribbon (EMA 20, EMA 50, EMA 100, EMA 200) :
Above EMA: If the stock price is above the EMA, it suggests a potential uptrend or bullish momentum.
Below EMA: If the stock price is below the EMA, it indicates a potential downtrend or bearish momentum.
Trendline: A trendline is a straight line drawn on a chart to represent the general direction of a data point set.
Uptrend Line: Drawn by connecting the lows in an upward trend. Indicates that the price is moving higher over time. Acts as a support level, where prices tend to bounce upward.
Downtrend Line: Drawn by connecting the highs in a downward trend. Indicates that the price is moving lower over time. It acts as a resistance level, where prices tend to drop.
Disclaimer:
I am not SEBI registered. The information provided here is for learning purposes only and should not be interpreted as financial advice. Consider the broader market context and consult with a qualified financial advisor before making investment decisions.

JAYASWAL NECO INDUSTR LTD S/RSupport and Resistance Levels:
Support Levels: These are price points (green line/shade) where a downward trend may be halted due to a concentration of buying interest. Imagine them as a safety net where buyers step in, preventing further decline.
Resistance Levels: Conversely, resistance levels (red line/shade) are where upward trends might stall due to increased selling interest. They act like a ceiling where sellers come in to push prices down.
Breakouts:
Bullish Breakout: When the price moves above resistance, it often indicates strong buying interest and the potential for a continued uptrend. Traders may view this as a signal to buy or hold.
Bearish Breakout: When the price falls below support, it can signal strong selling interest and the potential for a continued downtrend. Traders might see this as a cue to sell or avoid buying.
MA Ribbon (EMA 20, EMA 50, EMA 100, EMA 200) :
Above EMA: If the stock price is above the EMA, it suggests a potential uptrend or bullish momentum.
Below EMA: If the stock price is below the EMA, it indicates a potential downtrend or bearish momentum.
Trendline: A trendline is a straight line drawn on a chart to represent the general direction of a data point set.
Uptrend Line: Drawn by connecting the lows in an upward trend. Indicates that the price is moving higher over time. Acts as a support level, where prices tend to bounce upward.
Downtrend Line: Drawn by connecting the highs in a downward trend. Indicates that the price is moving lower over time. It acts as a resistance level, where prices tend to drop.
Disclaimer:
I am not SEBI registered. The information provided here is for learning purposes only and should not be interpreted as financial advice. Consider the broader market context and consult with a qualified financial advisor before making investment decisions.

OLA ELECTRIC Some buy pattern show in Ola Electric in weekly pattern.
So can be buy after close above 41.96 (W).
Try to exit, if close continues below 40.4 or 39.6 (W).


ZUARI AGRO CHEMICALS LTD S/RSupport and Resistance Levels:
Support Levels: These are price points (green line/shade) where a downward trend may be halted due to a concentration of buying interest. Imagine them as a safety net where buyers step in, preventing further decline.
Resistance Levels: Conversely, resistance levels (red line/shade) are where upward trends might stall due to increased selling interest. They act like a ceiling where sellers come in to push prices down.
Breakouts:
Bullish Breakout: When the price moves above resistance, it often indicates strong buying interest and the potential for a continued uptrend. Traders may view this as a signal to buy or hold.
Bearish Breakout: When the price falls below support, it can signal strong selling interest and the potential for a continued downtrend. Traders might see this as a cue to sell or avoid buying.
MA Ribbon (EMA 20, EMA 50, EMA 100, EMA 200) :
Above EMA: If the stock price is above the EMA, it suggests a potential uptrend or bullish momentum.
Below EMA: If the stock price is below the EMA, it indicates a potential downtrend or bearish momentum.
Trendline: A trendline is a straight line drawn on a chart to represent the general direction of a data point set.
Uptrend Line: Drawn by connecting the lows in an upward trend. Indicates that the price is moving higher over time. Acts as a support level, where prices tend to bounce upward.
Downtrend Line: Drawn by connecting the highs in a downward trend. Indicates that the price is moving lower over time. It acts as a resistance level, where prices tend to drop.
Disclaimer:
I am not SEBI registered. The information provided here is for learning purposes only and should not be interpreted as financial advice. Consider the broader market context and consult with a qualified financial advisor before making investment decisions.

Risk Management in Options TradingTrading options can be exciting and rewarding—but it's also full of risks. Without proper risk management, even the best strategies can lead to heavy losses. In this comprehensive guide, we'll dive deep into how to manage risk in options trading, covering everything from the basics to advanced techniques.
1. Understanding Risk in Options Trading
Before we dive into managing risk, it’s crucial to understand where risk comes from in options trading. Options are complex instruments that behave differently than stocks. The key sources of risk include:
A. Price Movement (Delta Risk)
When the price of the underlying stock moves up or down, the value of the option changes. This is known as Delta risk. A call option gains value when the stock goes up, and a put gains value when it goes down.
B. Time Decay (Theta Risk)
Options lose value over time. Even if the stock price doesn’t move, the option could still lose value as the expiration date approaches. This is known as Theta decay or time decay.
C. Volatility (Vega Risk)
Volatility reflects how much a stock moves. High volatility increases an option's premium. But if implied volatility falls, the value of your option might drop—even if your price prediction is correct.
D. Interest Rates and Dividends (Rho and Dividend Risk)
Although less impactful, interest rates and dividend changes can also influence option prices. These are more important for longer-dated options.
2. Why Is Risk Management Critical in Options?
Options give traders leverage—a small investment can control a large position. While this magnifies profits, it also increases losses. Many beginners fall into the trap of chasing big gains, only to blow up their accounts when trades go wrong.
Good risk management doesn’t eliminate risk—it helps you survive bad trades and stay in the game long enough for your edge to work.
3. Core Principles of Options Risk Management
Here are the foundational principles every options trader should follow:
A. Never Risk More Than You Can Afford to Lose
It sounds obvious, but many traders ignore this. Only use disposable capital, not money meant for rent, bills, or emergencies.
B. Position Sizing
This is one of the most powerful tools in risk management. Don’t bet your entire capital on a single trade. A common rule is to risk 1-2% of your capital on any trade. That way, even a string of losing trades won’t wipe you out.
C. Diversify Your Trades
Avoid putting all your trades on the same stock or sector. Diversification can reduce risk from unexpected news events or market shocks.
D. Know Your Maximum Loss
Before entering any trade, calculate your maximum potential loss. With long calls and puts, your loss is limited to the premium paid. But with short options or complex strategies like spreads, losses can be higher or even unlimited.
4. Practical Risk Management Techniques
A. Use Stop-Loss Orders (Where Applicable)
While options don’t always behave like stocks, you can still set a mental or physical stop-loss based on:
Percentage loss (e.g., exit if the option loses 50%)
Underlying price level (e.g., exit if stock breaks below a key level)
Time decay (e.g., exit 5 days before expiration to avoid Theta crush)
❗ Note: Stop-losses can be tricky with options because of wide bid-ask spreads. It’s important to use limit orders or mental stops to avoid slippage.
B. Avoid Naked Options (Especially Selling)
Selling naked calls or puts can expose you to unlimited risk. Unless you have a large account and full understanding, stick to defined-risk strategies like:
Spreads (credit/debit)
Iron condors
Butterflies
Covered calls
Protective puts
C. Hedge Your Positions
Hedging is like buying insurance. You can reduce risk by combining options in a way that limits losses.
Example:
If you sell a naked put, you can turn it into a bull put spread by buying a lower strike put. This limits your downside if the stock crashes.
D. Use Probability and Greeks
Understanding the "Greeks" can help you analyze risk exposure:
Greek What it Measures Risk Managed
Delta Price sensitivity Directional risk
Theta Time decay Time-related loss
Vega Volatility impact Volatility exposure
Gamma Delta’s change rate Acceleration of price impact
Rho Interest rate impact (minor risk)
Knowing your Greeks allows you to adjust trades when risks become too high.
5. Options Strategies for Risk Management
Some strategies are naturally more “risky,” while others are designed to limit downside. Let’s look at popular risk-managed strategies:
A. Covered Call
You own 100 shares of a stock and sell a call option. This gives you income (premium) and limits upside risk.
Risk: Stock falls
Reward: Premium + upside to strike price
B. Protective Put
You buy a put while holding the stock. It protects you from downside losses, like insurance.
Risk: Cost of put (premium)
Reward: Unlimited upside; limited downside
C. Vertical Spreads (Credit and Debit)
These involve buying and selling options at different strikes.
Bull Call Spread: Buy call + sell higher call
Bear Put Spread: Buy put + sell lower put
Both strategies have limited risk and reward, making them ideal for risk-conscious traders.
D. Iron Condor
You sell a call spread and a put spread on the same stock. Profitable when the stock stays in a defined range.
Risk: Limited to width of spread minus premium
Reward: Net credit received
This is a great strategy for sideways markets and offers good risk/reward if managed well.
6. Managing Risk Over Time
A. Adjusting Trades
If a trade moves against you, you don’t always have to take the loss. You can:
Roll the option to a later expiration
Adjust strikes to collect more credit or redefine risk
Convert to a spread or different strategy
However, be careful not to over-manage trades, which can lead to complex and risky positions.
B. Avoid Trading Around Events
Earnings announcements, Fed meetings, and budget declarations can cause huge volatility spikes. Option premiums are often inflated before such events. If you trade them, keep position size small and use defined-risk trades only.
ALKYLAMINE | Buy @2200 | Strict SL below 1900 | Target 4240Disclaimer:
This is not financial advice. Please do your own research or consult with a financial advisor before making any investment decisions. Investments in stocks can be risky and may result in loss of capital.

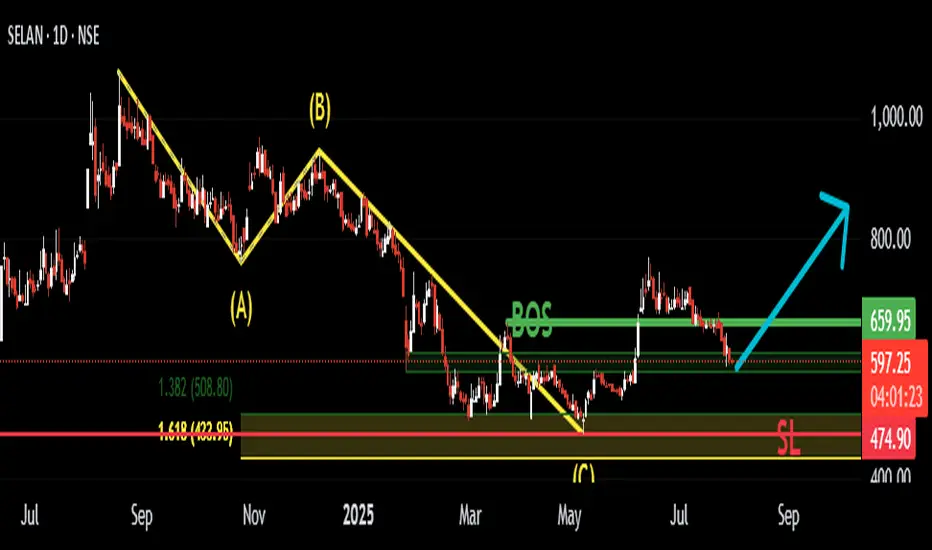
Petronet Long Setup: Wave C Ends at 1.382 of A–Breakout + RetestThis is a trend continuation setup on Petronet, based on Elliott Wave correction structure, Fibonacci confluence, and price action confirmation.
The stock recently completed a clean A-B-C corrective pattern, with Wave C terminating around the 1.382 extension of Wave A — a common Fibonacci exhaustion zone, often signaling the end of corrections.
Key factors supporting the long bias:
🌀 Wave C = 1.382 of Wave A, indicating potential completion of the correction.
🔍 A Break of Structure (BOS) was observed, confirming the shift in trend.
📈 Importantly, the BOS was marked by a strong bullish candle, adding conviction to the move.
🔁 Entry was planned on the retest of the broken resistance, which is now acting as support.
📊 Structure suggests we may now be entering a new impulse wave upward.
Risk Management Plan:
🛑 Stop-loss just below the Wave C low / support zone.
🎯 Targeting a minimum 1:2 Risk-to-Reward, aligned with the next impulse projection.
This trade favors confirmation over anticipation — by waiting for BOS + bullish candle + retest, the entry is more structurally reliable.
TIMES GUARANTY LTD S/RSupport and Resistance Levels:
Support Levels: These are price points (green line/shade) where a downward trend may be halted due to a concentration of buying interest. Imagine them as a safety net where buyers step in, preventing further decline.
Resistance Levels: Conversely, resistance levels (red line/shade) are where upward trends might stall due to increased selling interest. They act like a ceiling where sellers come in to push prices down.
Breakouts:
Bullish Breakout: When the price moves above resistance, it often indicates strong buying interest and the potential for a continued uptrend. Traders may view this as a signal to buy or hold.
Bearish Breakout: When the price falls below support, it can signal strong selling interest and the potential for a continued downtrend. Traders might see this as a cue to sell or avoid buying.
MA Ribbon (EMA 20, EMA 50, EMA 100, EMA 200) :
Above EMA: If the stock price is above the EMA, it suggests a potential uptrend or bullish momentum.
Below EMA: If the stock price is below the EMA, it indicates a potential downtrend or bearish momentum.
Trendline: A trendline is a straight line drawn on a chart to represent the general direction of a data point set.
Uptrend Line: Drawn by connecting the lows in an upward trend. Indicates that the price is moving higher over time. Acts as a support level, where prices tend to bounce upward.
Downtrend Line: Drawn by connecting the highs in a downward trend. Indicates that the price is moving lower over time. It acts as a resistance level, where prices tend to drop.
Disclaimer:
I am not SEBI registered. The information provided here is for learning purposes only and should not be interpreted as financial advice. Consider the broader market context and consult with a qualified financial advisor before making investment decisions.

PUNJAB CHEM & CROP PROT LTD S/RSupport and Resistance Levels:
Support Levels: These are price points (green line/shade) where a downward trend may be halted due to a concentration of buying interest. Imagine them as a safety net where buyers step in, preventing further decline.
Resistance Levels: Conversely, resistance levels (red line/shade) are where upward trends might stall due to increased selling interest. They act like a ceiling where sellers come in to push prices down.
Breakouts:
Bullish Breakout: When the price moves above resistance, it often indicates strong buying interest and the potential for a continued uptrend. Traders may view this as a signal to buy or hold.
Bearish Breakout: When the price falls below support, it can signal strong selling interest and the potential for a continued downtrend. Traders might see this as a cue to sell or avoid buying.
MA Ribbon (EMA 20, EMA 50, EMA 100, EMA 200) :
Above EMA: If the stock price is above the EMA, it suggests a potential uptrend or bullish momentum.
Below EMA: If the stock price is below the EMA, it indicates a potential downtrend or bearish momentum.
Trendline: A trendline is a straight line drawn on a chart to represent the general direction of a data point set.
Uptrend Line: Drawn by connecting the lows in an upward trend. Indicates that the price is moving higher over time. Acts as a support level, where prices tend to bounce upward.
Downtrend Line: Drawn by connecting the highs in a downward trend. Indicates that the price is moving lower over time. It acts as a resistance level, where prices tend to drop.
Disclaimer:
I am not SEBI registered. The information provided here is for learning purposes only and should not be interpreted as financial advice. Consider the broader market context and consult with a qualified financial advisor before making investment decisions.

#MphasisDate: 29-07-2025
#Mphasis - Current Price: 2690
Pivot Point: 2698.00 Support: 2590.98 Resistance: 2805.96
#Mphasis Upside Targets:
Target 1: 2939.98
Target 2: 3074.00
Target 3: 3215.00
Target 4: 3356.00
#Mphasis Downside Targets:
Target 1: 2456.49
Target 2: 2322.00
Target 3: 2181.00
Target 4: 2040.00
#TradingView #Stocks #Equities #StockMarket #Investing #Trading #Nifty
#TechnicalAnalysis #StockCharts #Finance
