KRN looks good after a pullbackKRN is showing classic uptrending price action. And is currently pulling back from a recent high. I feel, it might be ready to move up again.

Bluedart looking good among the many scrips in logisticsBluedart looking good among other logistics players.
Other interesting names are Gateway Distripacks, Zinka logistics

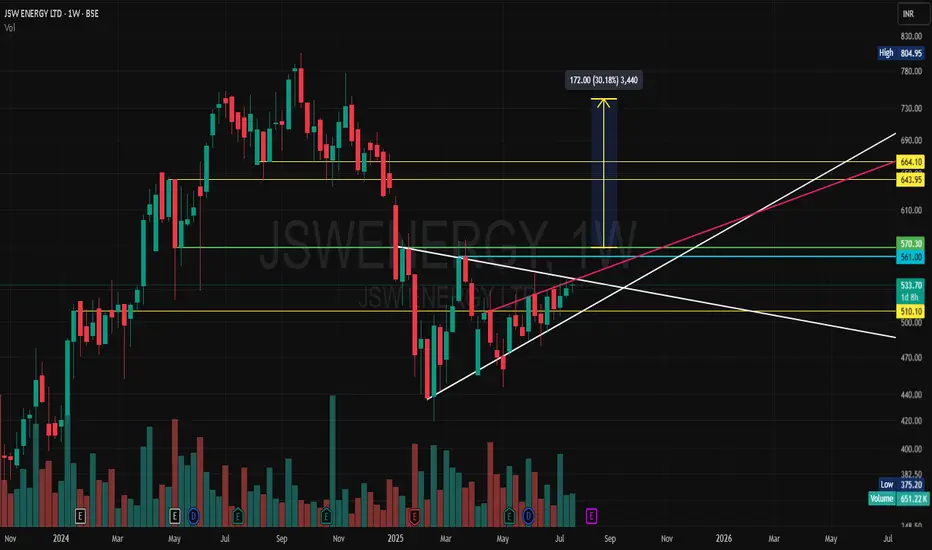
jsw energysymmertrical triangle (In white line)
Red Line inverse H&S Neckline
Blue Line Double bottom neckline.
Green line is also neckline can be resistance tgt above yellow lines and above
Will rate cut by rbi play out in auto sector???Recently RBI cuts rates by 50 basis points on 6th june
this will help auto sector in volume pickup by sales& and revenue
according to reports rbi will cut rate by 25 basis points if this happens
then surely its a good bet for auto sector. we can add autos in our portfolio
for next Q-2 and Q-3......
As of now inflation is in control and according to CPI inflation data inflation is around at
2% which is at four years low and if this is the case then surely rbi cut down rate for
an economy boost so called Dovish move
Thanks and Regards
Devansh sharma
(M.D & CIO Green Bull)

Ola looks to reverse from a long dry spellInterest in Ola seems to be gathering from bottom fishers. Is there something cooking?

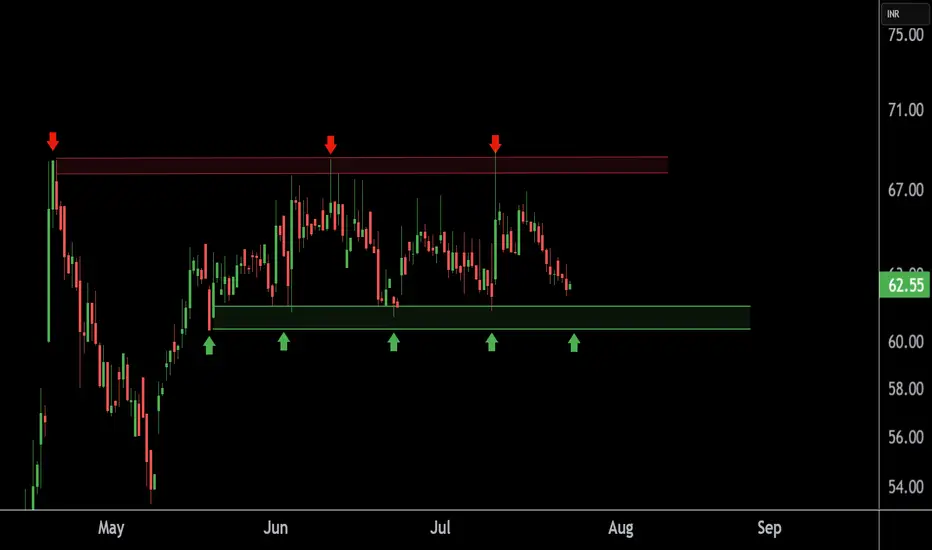
TEXMOPIPE Chart Speaks Strength – Buying Opportunity Near SupporThis is the 4 hour chart of TEXMOPIPES.
TEXMOPIPES having a good support zone near at 60 level.
If this level is sustain , then we may see higher prices in TEXMOPIPES.
Thank You !!
Paisalo Digital looking to break out. Ticker has been in long consolidation. Several high volume spikes, without corresponding price surges shows some large blocks changing hands before a significant move.

Apollo Hospital Long_Support @ 20 DEMAApollo Hospital Long:
- Price Takes support at 20 DEMA
- Earnings next week
- Enter long with tight SL
- SL - CLose below 20 DEMA

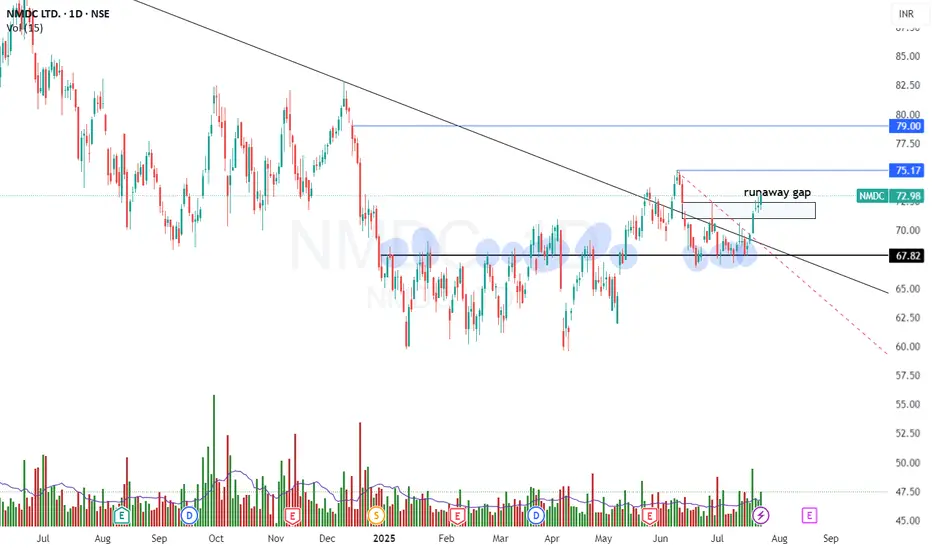
NMDC – Bullish Trend Reversal with Breakout Setup📈 NMDC – Bullish Trend Reversal with Breakout Setup (For Study Purpose Only)
NMDC has displayed a bullish trend reversal following a prolonged 6-month consolidation between ₹60–68. The stock broke out decisively above this range and has since retested the breakout zone successfully, confirming it as a strong support.
Subsequently, the stock entered a 1-month sideways consolidation between ₹67–73, forming a tight base—typically a sign of strength and potential continuation.
🔍 Technical Highlights:
✅ Breakout Zone: ₹68 (now acting as strong support)
🔁 Retest Completed: Post-breakout pullback respected support
🧱 Current Range: ₹70–73 (tight consolidation near highs)
📊 Volume: Gradual increase near resistance, indicating accumulation
📈 RSI & MACD: RSI climbing steadily; MACD shows bullish crossover
🎯 Trade Setup (for study purpose only):
Watch for strength above: ₹73
Stop-Loss (SL): ₹69
Targets: ₹75 (initial), ₹80–82 (extended)
📌 Note:
This analysis is intended for educational and study purposes only. Always conduct your own due diligence or consult a certified financial advisor before making any investment decisions.
Review and plan for 24th July 2025Nifty future and banknifty future analysis and intraday plan.
Quarterly results.
This video is for information/education purpose only. you are 100% responsible for any actions you take by reading/viewing this post.
please consult your financial advisor before taking any action.
----Vinaykumar hiremath, CMT

Pole and Flag The pole and flag pattern is a classic continuation pattern in technical analysis, often signaling that the current trend is likely to continue after a brief consolidation. The pattern consists of:
Pole: A sharp, nearly vertical movement in price reflecting strong market momentum.
Flag: A consolidation phase where price moves within parallel trendlines, usually sloping against the direction of the pole, indicating a pause before the next move.
In the provided chart of Muthoot Finance Ltd., the stock exhibits a textbook bullish pole and flag formation, suggesting potential for further upside if technical conditions are met.
How to Trade the Pole and Flag Pattern
1. Entry Point
Enter Long: When price closes above the flag’s upper trendline or resistance level on higher-than-average volume. This confirms the breakout and continuation of the uptrend.
2. Setting the Target
Target Calculation: Measure the distance from the lowest to the highest point of the pole. Add this value to the flag's breakout point to project the potential price target.
For example: If the pole is 400 points (from 2,300 to 2,700) and breakout occurs at 2,700, the target is 3,100.
3. Stop-Loss Placement
Set Stop-Loss: Just below the lower trendline of the flag or recent swing low. This minimizes risk in case of a failed breakout.
4. Volume Confirmation
Confirmation: A valid breakout should be accompanied by a spike in volume, reflecting renewed buying interest.

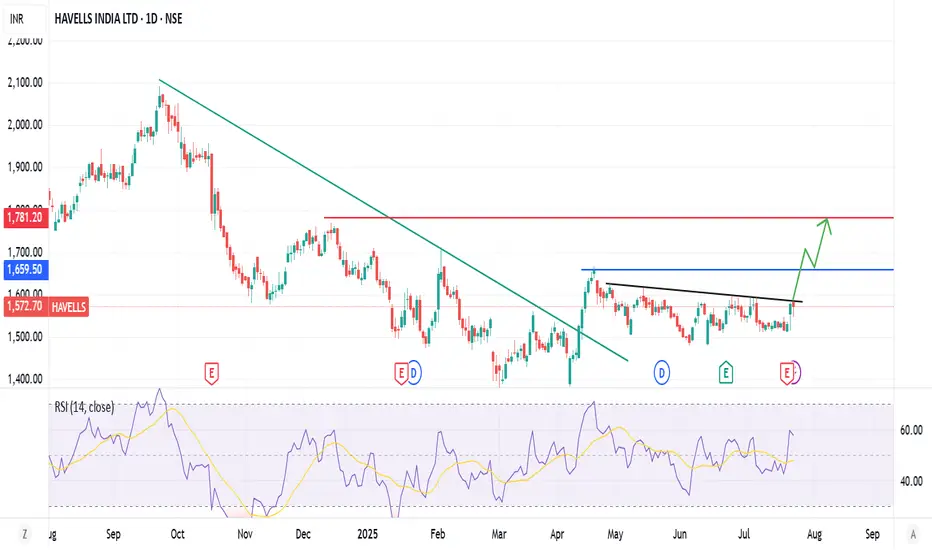
havells awaiting for break out havells making constant hitting on resistance, lets hope for good out come.
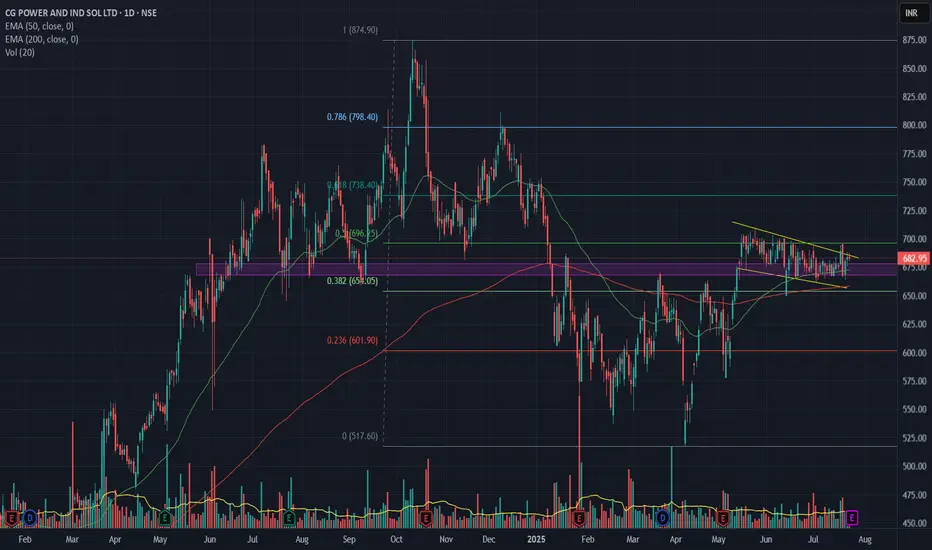
CGPower getting ready for big upside move.Two inside candles after big green candle. Pole & Flag pattern on weekly timeframe and getting ready to give break out with bullish engulfing. Day timeframe is also showing multiple positive reasons like golden crossover, channel breakout and spending time on higher levels. Also near 0.5 fib levels. If it crosses 695 then can see 740 level with 660 as SL.
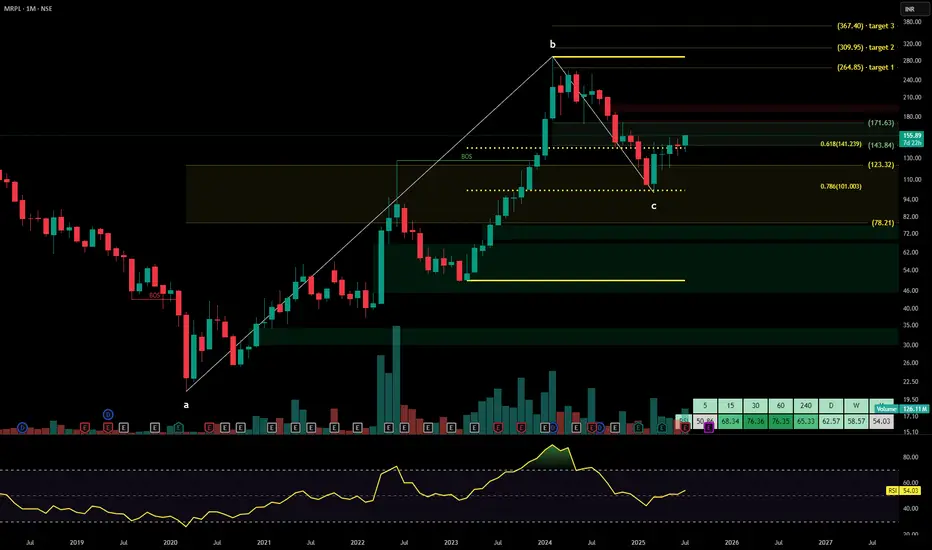
MRPLMangalore Refinery and Petrochemicals Ltd. is a subsidiary of ONGC and operates a state-of-the-art petroleum refinery in Karnataka, processing a wide range of crude grades to produce value-added petroleum products. It caters to domestic and export markets through refined fuels, petrochemicals, and specialty products. The stock is currently trading at ₹155.89.
Mangalore Refinery and Petrochemicals Ltd. – FY22–FY25 Snapshot
Sales – ₹83,556 Cr → ₹87,218 Cr → ₹89,744 Cr → ₹91,880 Cr – Topline remains stable with high crude volumes
Net Profit – ₹2,222 Cr → ₹2,068 Cr → ₹2,420 Cr → ₹2,655 Cr – Strong bottom-line driven by GRM and cost cuts
Company Order Book – Moderate → Strong → Strong → Strong – Sustained procurement cycle and export contracts
Dividend Yield (%) – 1.12% → 1.23% → 1.31% → 1.38% – Steady payouts supported by cash flow visibility
Operating Performance – Moderate → Strong → Strong → Strong – Higher capacity utilization and blended margins
Equity Capital – ₹1,752.68 Cr (constant) – No dilution
Total Debt – ₹10,222 Cr → ₹9,780 Cr → ₹9,340 Cr → ₹8,960 Cr – Deleveraging trend aligned to profitability
Total Liabilities – ₹18,400 Cr → ₹19,150 Cr → ₹19,850 Cr → ₹20,520 Cr – Stable liability expansion with crude cost
Fixed Assets – ₹5,980 Cr → ₹6,270 Cr → ₹6,560 Cr → ₹6,850 Cr – Gradual capex for emission norms and refining upgrades
Latest Highlights FY25 net profit grew 9.7% YoY to ₹2,655 Cr; revenue rose 2.4% to ₹91,880 Cr EPS: ₹15.15 | EBITDA Margin: 11.8% | Net Margin: 2.89% Return on Equity: 14.36% | Return on Assets: 9.63% Promoter holding: 88.58% | Dividend Yield: 1.38% Complex refinery product mix helped optimize GRMs during volatile crude cycles Strength in petrochemicals and export demand boosted margin stability
Institutional Interest & Ownership Trends Promoter holding remains dominant at 88.58% via ONGC, with no pledging or dilution. FII interest is muted given PSU profile, while domestic institutions maintain stable exposure. Volume data reflects rotational interest from value-oriented fund desks and government-linked mandates.
Business Growth Verdict Yes, MRPL is maintaining strong financial metrics despite macro volatility Margins supported by efficient refining and blended product strategy Debt trajectory is improving with strong operating cash flows Capex remains focused and strategically aligned to long-term energy goals
Company Guidance Management expects stable revenue and GRM levels in FY26, supported by improved plant utilization, export momentum, and diversification into petrochemical derivatives.
Final Investment Verdict Mangalore Refinery and Petrochemicals Ltd. offers a steady play in India’s refining and energy infrastructure vertical. As a PSU subsidiary with consistent cash flows, balanced profitability, and strategic expansion into petrochemicals, the company is positioned for long-term value delivery. Its operational discipline and blend of domestic and export markets make it suitable for accumulation by investors focused on energy-linked stability.
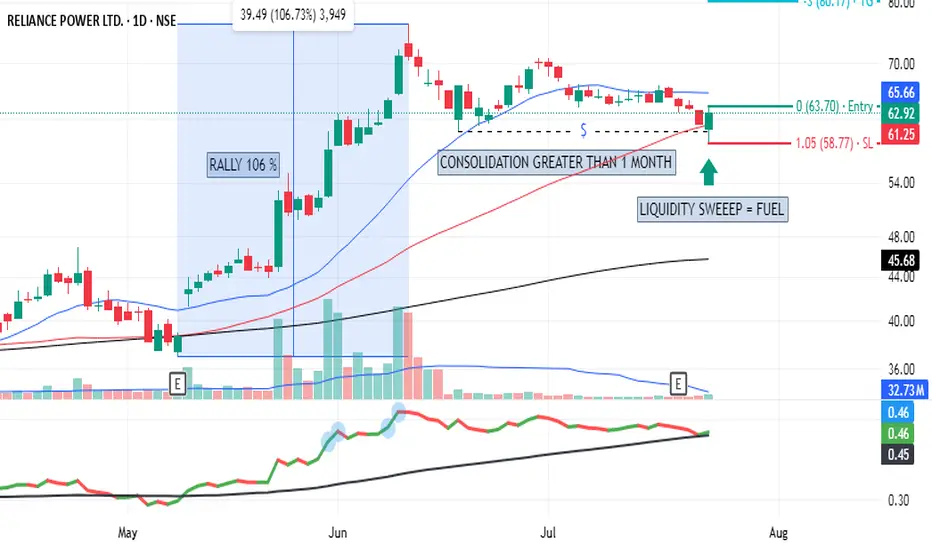
RPOWER - My Pick - No AdviceRally of 106% followed by consolidation of more than a month and fueled by liquidity today. Do I need to say more ? Chart says it all....
follow proper risk management. Investment in stock market is Risky.
Gvt&dGVTL&d ⚡ | Powering Up with Strong Structure
Stock moving with rising volume and steady momentum.
Technical setup looks favorable for positional hold!

Kpr millsKPR Mill 🧵 | Solid Base with upmove Potential!!
Volume and structure suggest accumulation — keeping it on radar for a potential breakout.

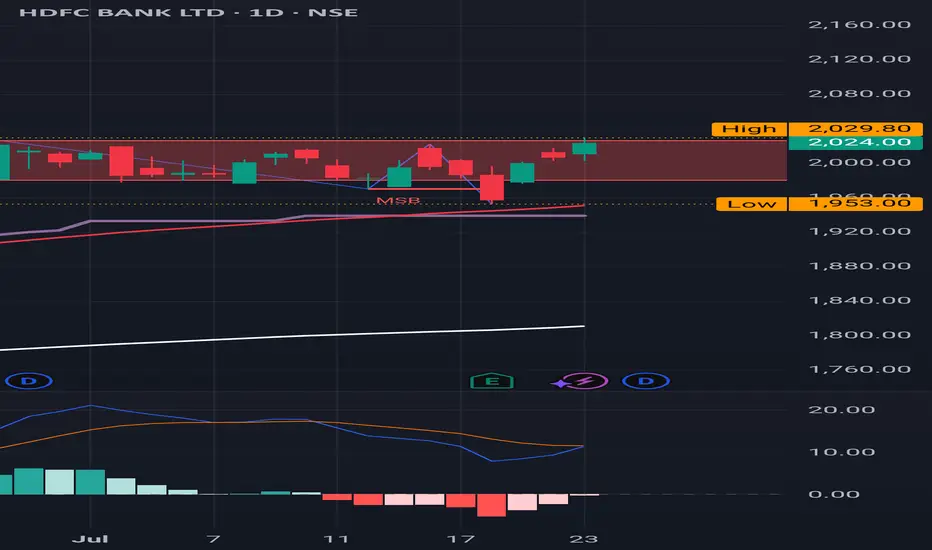
HDFC Bank : Sitting at a major Red Band Resistance
HDFC Bank : Sitting at a major Red Band Resistance
Daily Time Frame.
( Not a Buy / Sell Recommendation
Do your own due diligence ,Market is subject to risks, This is my own view and for learning only .)
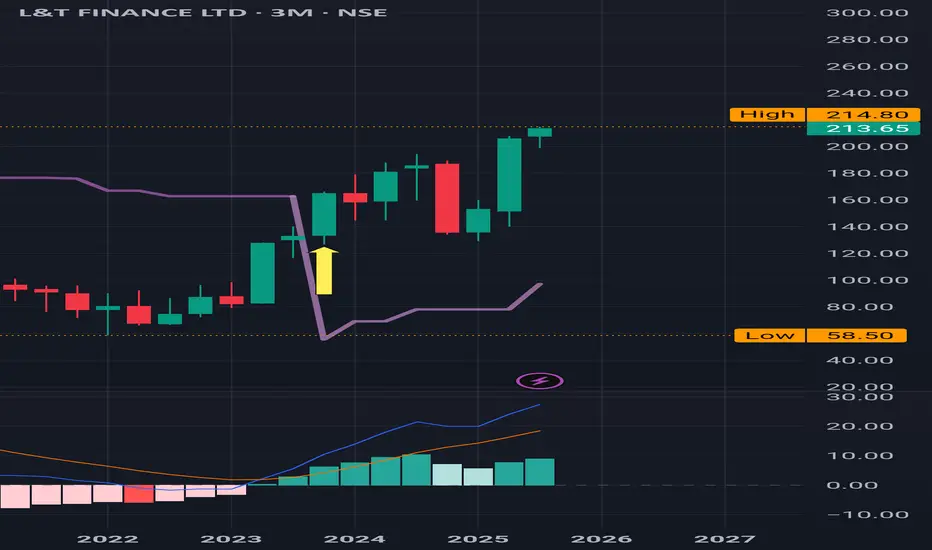
L&T Finance : Made a new High after a buy signal ,3 Months Time L&T Finance : Made a new High after a buy signal . Cleared the previous resistance of 198.90.
3 months Time Frame .
( Not a Buy / Sell Recommendation
Do your own due diligence ,Market is subject to risks, This is my own view and for learning only .)
Godrej agroGodrej Agrovet 🌿 | Structurally Strong, Poised for Upside
The stock is showing steady accumulation with a clean structure.

PAGE INDUSTRIES - ready to fly ?? looking strong on hourlyPAGE INDUSTRIES----HOURLY counts indicate Excellent bullish wave structure.
Both appear to be optimistic and this stock invalidation number (S L) wave 2 low
target short / long term are already shared as per charts
correction wave leg seems completed (C)
Investing in declines is a smart move for short/ long-term players.
Buy in DIPS recommended
Long-term investors prepare for strong returns over the next two to five years.
one of best counter
Every graphic used to comprehend & LEARN & understand the theory of Elliot waves, Harmonic waves, Gann Theory, and Time theory
Every chart is for educational purposes.
We have no accountability for your profit or loss.

