Bikaji Food Triangular Pattern, Long, 1DBikaji Food is following a triangular pattern. If it breaks the level of 780 with Bullish candlestick patterns like Bullish Engulfing, Hammer & Inverted Hammer, Piercing Line, Morning Star, Three White Soldiers, Tweezer Bottoms or Bullish Harami, then take a long trade on this stock with first target of 815 and second target of 851.
Entry: 780 (on Bullish candlestick pattern)
Target1: 815
Target2: 851

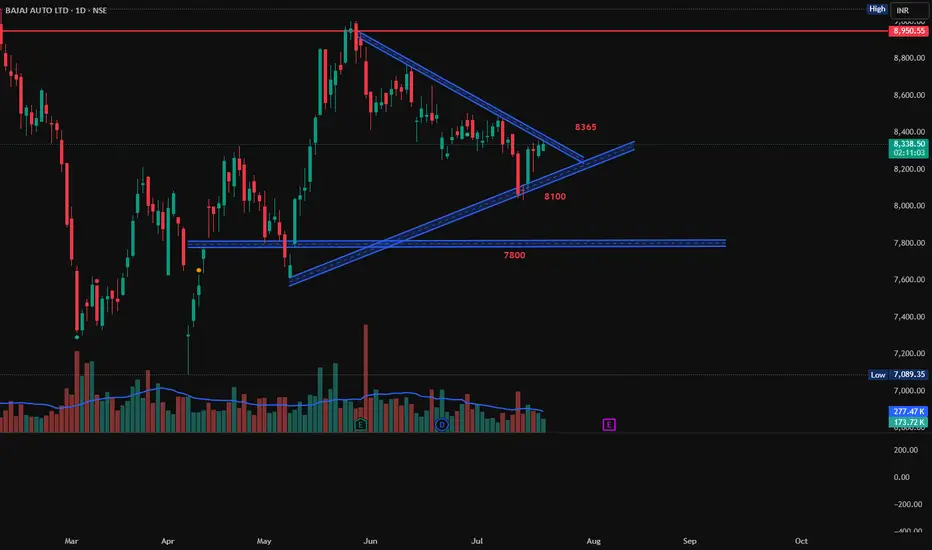
Bajaj Auto, Triangular PatternBajaj Auto is following a nice triangular pattern. Is both short and long side trade is possible on this stock. If it breaks above the pattern then enter on the breakout of 8365 with target 8950. If it break down below 8100 then target will be 7800.
Long
Entry: 8365
Target: 8950
Short
Entry: 8100
Target: 7800
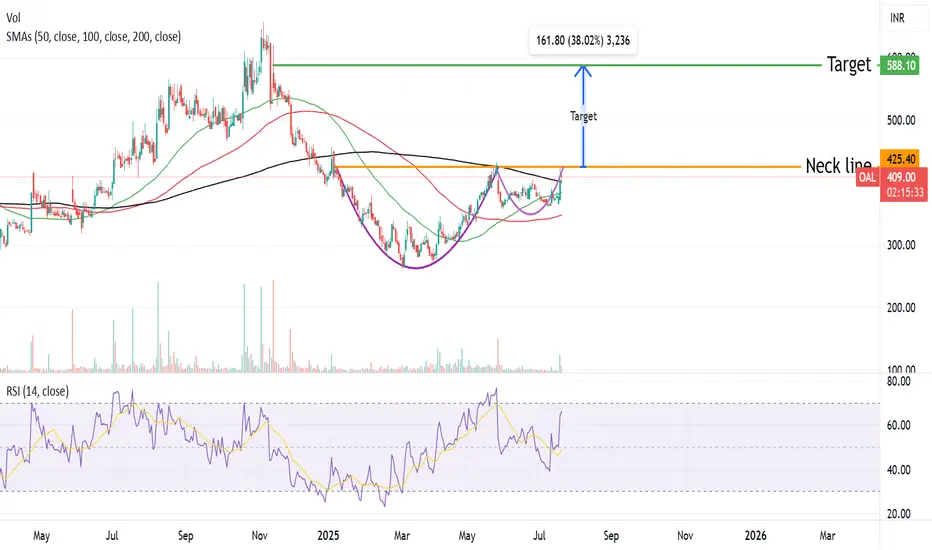
Oriental aromatic forming a CUP & HANDLE pattern Oriental aromatic forming a CUP & HANDLE pattern ,Breakout of this pattern will be above 425 level ,One can accumulate the stock with a stoploss of 360 for a Target of 580.
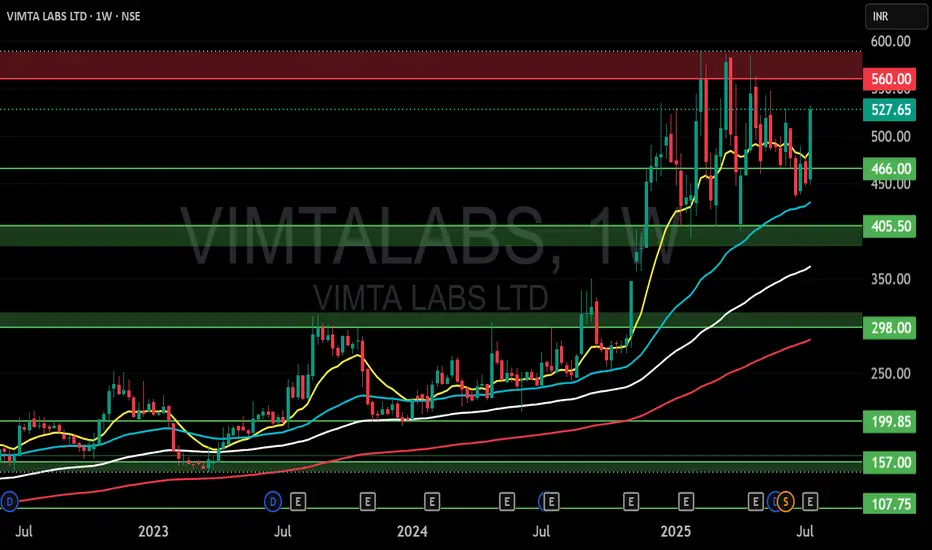
VIMTALAI (VIMTA LABS LTD) S/RSupport and Resistance Levels:
Support Levels: These are price points (green line/shade) where a downward trend may be halted due to a concentration of buying interest. Imagine them as a safety net where buyers step in, preventing further decline.
Resistance Levels: Conversely, resistance levels (red line/shade) are where upward trends might stall due to increased selling interest. They act like a ceiling where sellers come in to push prices down.
Breakouts:
Bullish Breakout: When the price moves above resistance, it often indicates strong buying interest and the potential for a continued uptrend. Traders may view this as a signal to buy or hold.
Bearish Breakout: When the price falls below support, it can signal strong selling interest and the potential for a continued downtrend. Traders might see this as a cue to sell or avoid buying.
MA Ribbon (EMA 20, EMA 50, EMA 100, EMA 200) :
Above EMA: If the stock price is above the EMA, it suggests a potential uptrend or bullish momentum.
Below EMA: If the stock price is below the EMA, it indicates a potential downtrend or bearish momentum.
Trendline: A trendline is a straight line drawn on a chart to represent the general direction of a data point set.
Uptrend Line: Drawn by connecting the lows in an upward trend. Indicates that the price is moving higher over time. Acts as a support level, where prices tend to bounce upward.
Downtrend Line: Drawn by connecting the highs in a downward trend. Indicates that the price is moving lower over time. It acts as a resistance level, where prices tend to drop.
Disclaimer:
I am not a SEBI registered. The information provided here is for learning purposes only and should not be interpreted as financial advice. Consider the broader market context and consult with a qualified financial advisor before making investment decisions.
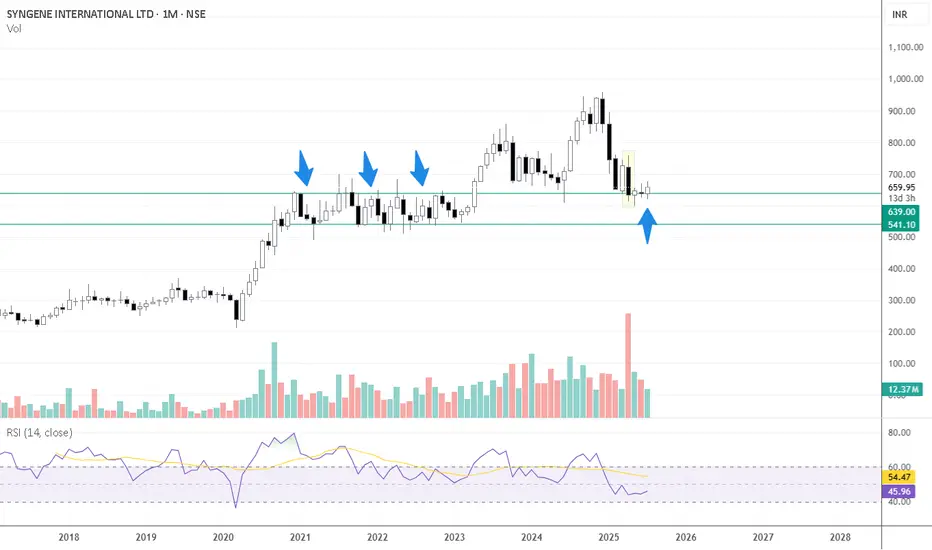
SYNGENE INTERNATIONAL LTD at Old Peaks Key Support 📈 Monthly Chart – Key Support at Old Peaks
The stock has recently revisited the ₹600–₹610 range, which corresponds to a previous consolidation and monthly swing-low zone (~₹607) from November 2020 to April 2023 on the monthly timeframe
This zone isn’t just another support level—it represents an area where price historically spent over 2.5 years, making multiple tests before breaking higher. Such zones often act as strong demand zones when revisited
A sustained hold above ₹607 would reinforce this support, signaling a potential base for a multi-month reversal or bounce
🕯️ April Monthly Candle – Selling Exhaustion?
Large bearish candle in April (FY25 Q4 results month).
High volume, which often signals capitulation or Selling climax.
Price has since stayed within the range of this candle-no breakout above or below.
Indicates a potential exhaustion of sellers if the stock holds above the low of that candle, this structure often represents a volatility compression after a sharp move-like a spring coiling.
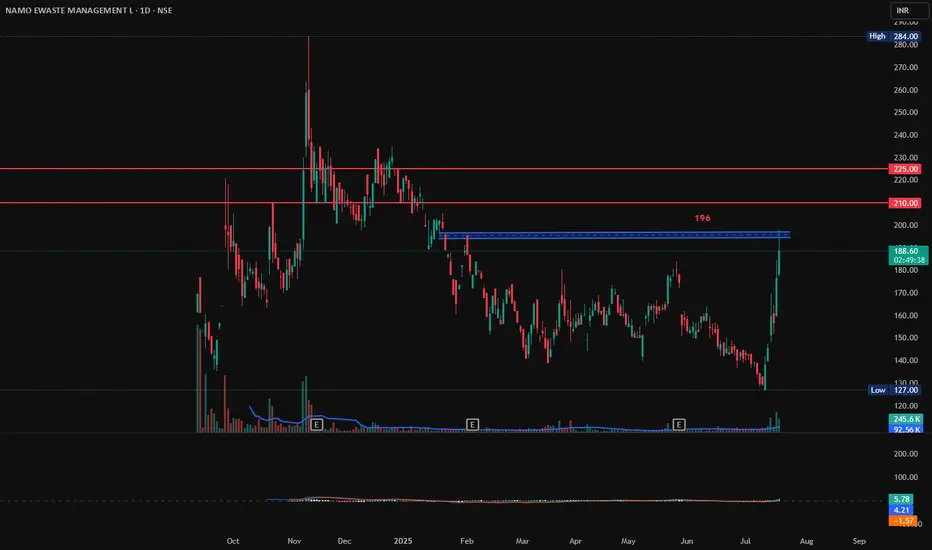
NAMO EWASTE MANAGEMENT, Long, Breakout, 1DNAMO EWASTE MANAGEMENT has gain 6% today with good volumes. If it breaks and sustains 196 with Bullish candlestick patterns like Bullish Engulfing, Hammer & Inverted Hammer, Piercing Line, Morning Star, Three White Soldiers, Tweezer Bottoms or Bullish Harami, then there are good chances for it to go further up from here. First target will be 210 and second target 225.
Entry: 196 (on Bullish candlestick pattern)
Target1: 210
Target2: 225.
SL: 185
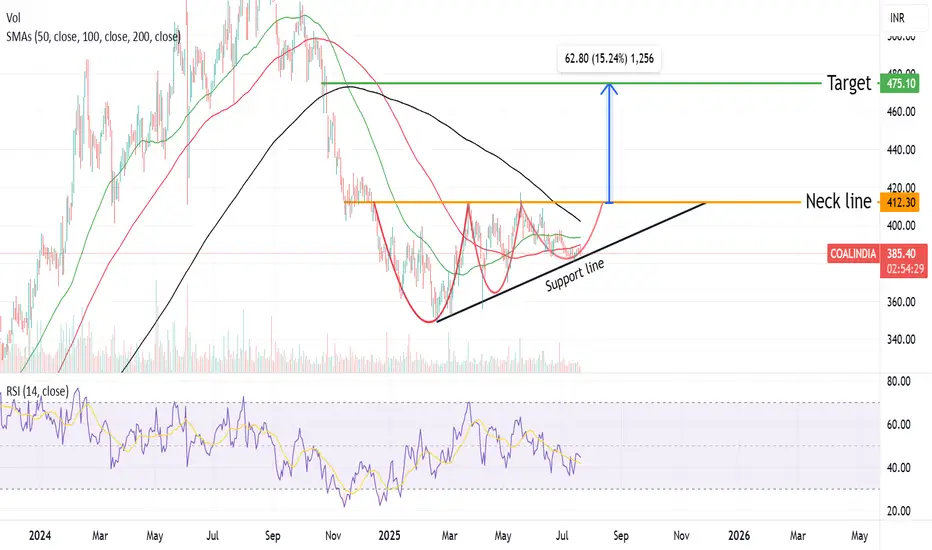
Coal India CUP & HANDLE Pattern formation going on Coal India currently forming a CUP & Handle pattern ,Breakout of this pattern will be above 410 level .Target price will be arround 470 level .One can start accumulation in Coal India .Stoploss will be arround 360 level
Investment cum Trading IdeaDELHIVERY LTP 330 Tgt:370/430/470 🤞🏻🤞🏻🤞🏻 Purely long-term investment may add on dips or hold calmly Will Review at price range of 480-500 for further move

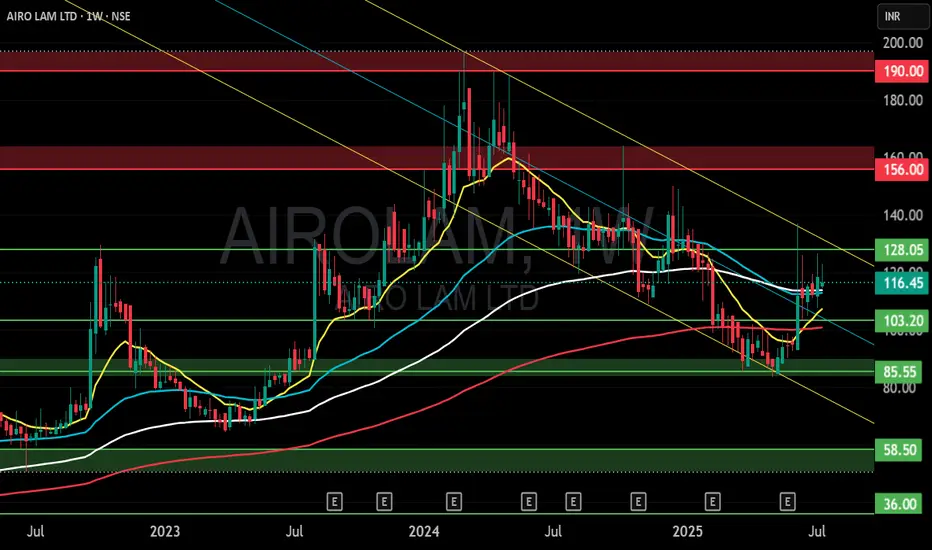
AIROLAM (AIRO LAM LTD) S/RSupport and Resistance Levels:
Support Levels: These are price points (green line/shade) where a downward trend may be halted due to a concentration of buying interest. Imagine them as a safety net where buyers step in, preventing further decline.
Resistance Levels: Conversely, resistance levels (red line/shade) are where upward trends might stall due to increased selling interest. They act like a ceiling where sellers come in to push prices down.
Breakouts:
Bullish Breakout: When the price moves above resistance, it often indicates strong buying interest and the potential for a continued uptrend. Traders may view this as a signal to buy or hold.
Bearish Breakout: When the price falls below support, it can signal strong selling interest and the potential for a continued downtrend. Traders might see this as a cue to sell or avoid buying.
MA Ribbon (EMA 20, EMA 50, EMA 100, EMA 200) :
Above EMA: If the stock price is above the EMA, it suggests a potential uptrend or bullish momentum.
Below EMA: If the stock price is below the EMA, it indicates a potential downtrend or bearish momentum.
Trendline: A trendline is a straight line drawn on a chart to represent the general direction of a data point set.
Uptrend Line: Drawn by connecting the lows in an upward trend. Indicates that the price is moving higher over time. Acts as a support level, where prices tend to bounce upward.
Downtrend Line: Drawn by connecting the highs in a downward trend. Indicates that the price is moving lower over time. It acts as a resistance level, where prices tend to drop.
Disclaimer:
I am not SEBI registered. The information provided here is for learning purposes only and should not be interpreted as financial advice. Consider the broader market context and consult with a qualified financial advisor before making investment decisions.
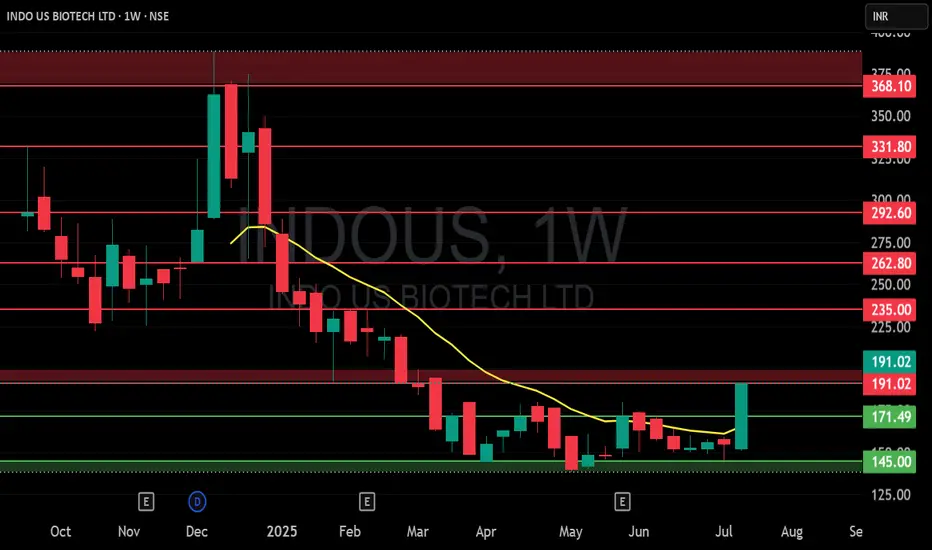
INDOUS (INDO US BIOTECH LTD) S/RSupport and Resistance Levels:
Support Levels: These are price points (green line/shade) where a downward trend may be halted due to a concentration of buying interest. Imagine them as a safety net where buyers step in, preventing further decline.
Resistance Levels: Conversely, resistance levels (red line/shade) are where upward trends might stall due to increased selling interest. They act like a ceiling where sellers come in to push prices down.
Breakouts:
Bullish Breakout: When the price moves above resistance, it often indicates strong buying interest and the potential for a continued uptrend. Traders may view this as a signal to buy or hold.
Bearish Breakout: When the price falls below support, it can signal strong selling interest and the potential for a continued downtrend. Traders might see this as a cue to sell or avoid buying.
MA Ribbon (EMA 20, EMA 50, EMA 100, EMA 200) :
Above EMA: If the stock price is above the EMA, it suggests a potential uptrend or bullish momentum.
Below EMA: If the stock price is below the EMA, it indicates a potential downtrend or bearish momentum.
Trendline: A trendline is a straight line drawn on a chart to represent the general direction of a data point set.
Uptrend Line: Drawn by connecting the lows in an upward trend. Indicates that the price is moving higher over time. Acts as a support level, where prices tend to bounce upward.
Downtrend Line: Drawn by connecting the highs in a downward trend. Indicates that the price is moving lower over time. It acts as a resistance level, where prices tend to drop.
Disclaimer:
I am not a SEBI registered. The information provided here is for learning purposes only and should not be interpreted as financial advice. Consider the broader market context and consult with a qualified financial advisor before making investment decisions.
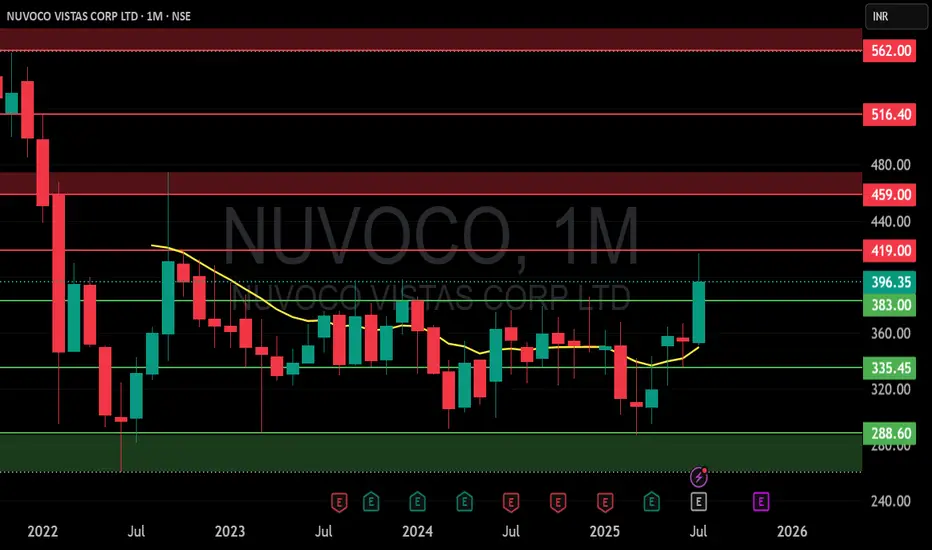
NUVOCO (NUVOCO VISTAS CORP LTD) S/RSupport and Resistance Levels:
Support Levels: These are price points (green line/shade) where a downward trend may be halted due to a concentration of buying interest. Imagine them as a safety net where buyers step in, preventing further decline.
Resistance Levels: Conversely, resistance levels (red line/shade) are where upward trends might stall due to increased selling interest. They act like a ceiling where sellers come in to push prices down.
Breakouts:
Bullish Breakout: When the price moves above resistance, it often indicates strong buying interest and the potential for a continued uptrend. Traders may view this as a signal to buy or hold.
Bearish Breakout: When the price falls below support, it can signal strong selling interest and the potential for a continued downtrend. Traders might see this as a cue to sell or avoid buying.
MA Ribbon (EMA 20, EMA 50, EMA 100, EMA 200) :
Above EMA: If the stock price is above the EMA, it suggests a potential uptrend or bullish momentum.
Below EMA: If the stock price is below the EMA, it indicates a potential downtrend or bearish momentum.
Trendline: A trendline is a straight line drawn on a chart to represent the general direction of a data point set.
Uptrend Line: Drawn by connecting the lows in an upward trend. Indicates that the price is moving higher over time. Acts as a support level, where prices tend to bounce upward.
Downtrend Line: Drawn by connecting the highs in a downward trend. Indicates that the price is moving lower over time. It acts as a resistance level, where prices tend to drop.
Disclaimer:
I am not a SEBI registered. The information provided here is for learning purposes only and should not be interpreted as financial advice. Consider the broader market context and consult with a qualified financial advisor before making investment decisions.
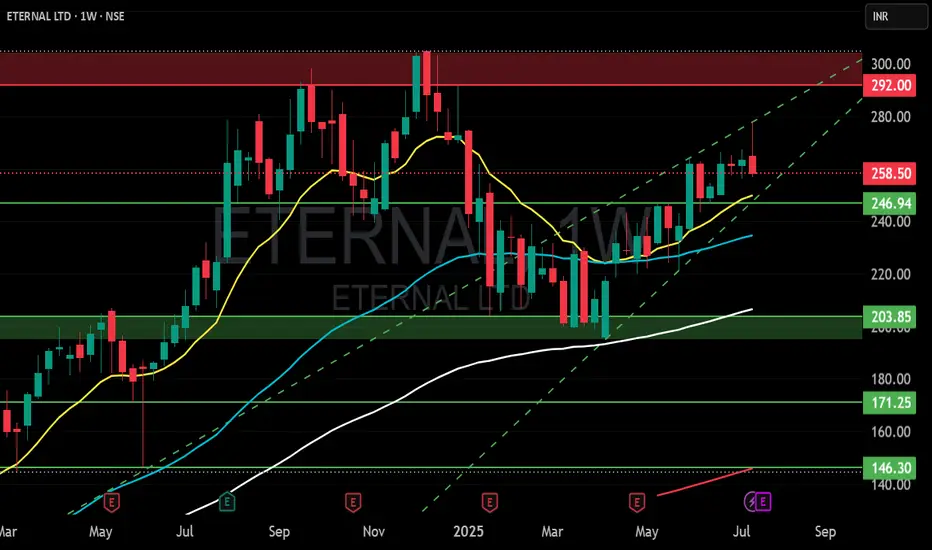
ETERNAL LTD S/RSupport and Resistance Levels:
Support Levels: These are price points (green line/shade) where a downward trend may be halted due to a concentration of buying interest. Imagine them as a safety net where buyers step in, preventing further decline.
Resistance Levels: Conversely, resistance levels (red line/shade) are where upward trends might stall due to increased selling interest. They act like a ceiling where sellers come in to push prices down.
Breakouts:
Bullish Breakout: When the price moves above resistance, it often indicates strong buying interest and the potential for a continued uptrend. Traders may view this as a signal to buy or hold.
Bearish Breakout: When the price falls below support, it can signal strong selling interest and the potential for a continued downtrend. Traders might see this as a cue to sell or avoid buying.
MA Ribbon (EMA 20, EMA 50, EMA 100, EMA 200) :
Above EMA: If the stock price is above the EMA, it suggests a potential uptrend or bullish momentum.
Below EMA: If the stock price is below the EMA, it indicates a potential downtrend or bearish momentum.
Trendline: A trendline is a straight line drawn on a chart to represent the general direction of a data point set.
Uptrend Line: Drawn by connecting the lows in an upward trend. Indicates that the price is moving higher over time. Acts as a support level, where prices tend to bounce upward.
Downtrend Line: Drawn by connecting the highs in a downward trend. Indicates that the price is moving lower over time. It acts as a resistance level, where prices tend to drop.
Disclaimer:
I am not a SEBI registered. The information provided here is for learning purposes only and should not be interpreted as financial advice. Consider the broader market context and consult with a qualified financial advisor before making investment decisions.
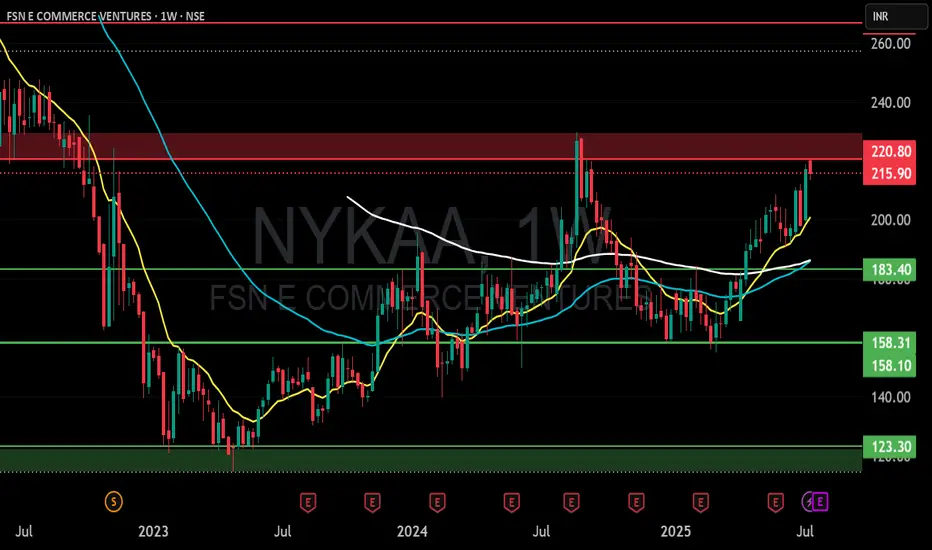
NYKAA (FSN COMMERCE VENTURES) S/RSupport and Resistance Levels:
Support Levels: These are price points (green line/shade) where a downward trend may be halted due to a concentration of buying interest. Imagine them as a safety net where buyers step in, preventing further decline.
Resistance Levels: Conversely, resistance levels (red line/shade) are where upward trends might stall due to increased selling interest. They act like a ceiling where sellers come in to push prices down.
Breakouts:
Bullish Breakout: When the price moves above resistance, it often indicates strong buying interest and the potential for a continued uptrend. Traders may view this as a signal to buy or hold.
Bearish Breakout: When the price falls below support, it can signal strong selling interest and the potential for a continued downtrend. Traders might see this as a cue to sell or avoid buying.
MA Ribbon (EMA 20, EMA 50, EMA 100, EMA 200) :
Above EMA: If the stock price is above the EMA, it suggests a potential uptrend or bullish momentum.
Below EMA: If the stock price is below the EMA, it indicates a potential downtrend or bearish momentum.
Trendline: A trendline is a straight line drawn on a chart to represent the general direction of a data point set.
Uptrend Line: Drawn by connecting the lows in an upward trend. Indicates that the price is moving higher over time. Acts as a support level, where prices tend to bounce upward.
Downtrend Line: Drawn by connecting the highs in a downward trend. Indicates that the price is moving lower over time. It acts as a resistance level, where prices tend to drop.
Disclaimer:
I am not a SEBI registered. The information provided here is for learning purposes only and should not be interpreted as financial advice. Consider the broader market context and consult with a qualified financial advisor before making investment decisions.
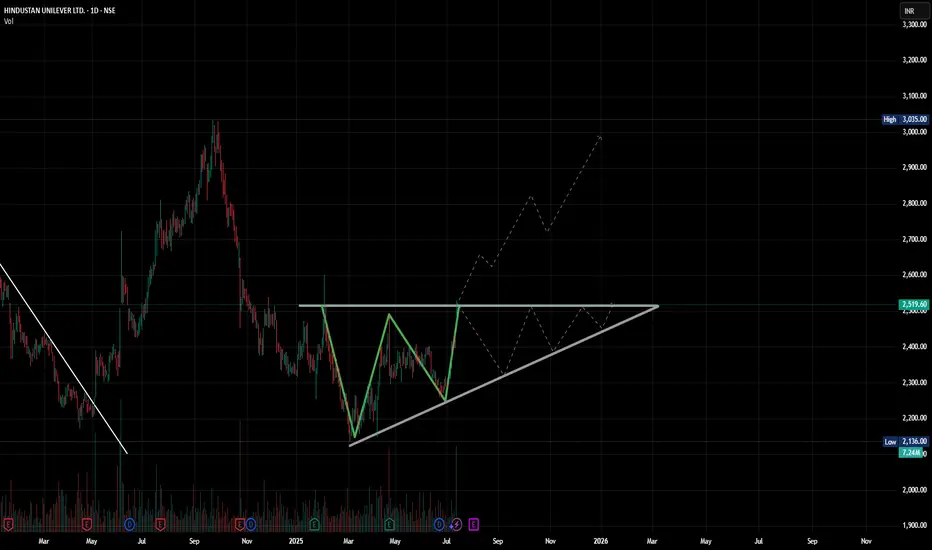
W For Win? HUL Pulls Up with a Perfect Double BottomPrice showing up to resistance like it forgot the last time it got slapped here. But this time it brought volume. Respect?
(Or the probable ascending triangle.. u know?)
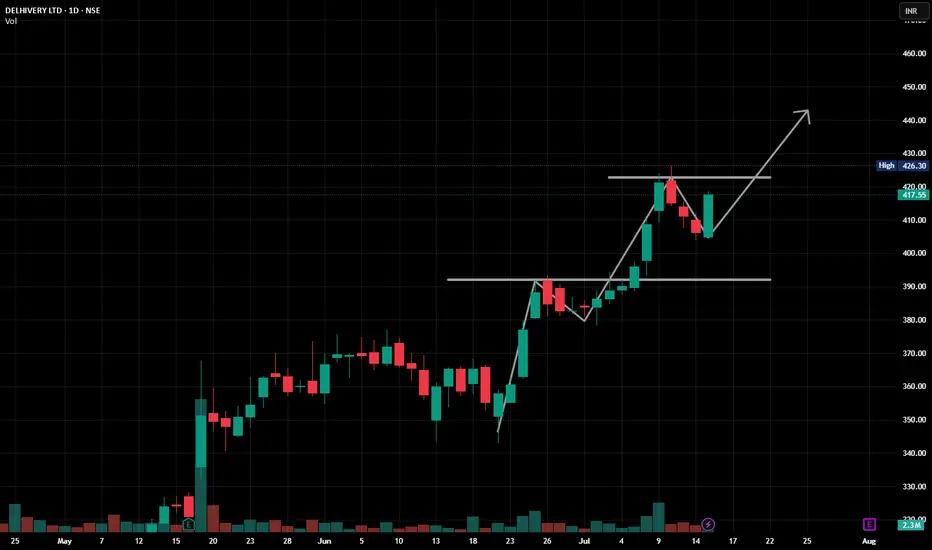
Bullish structure in play!NSE:DELHIVERY
Bullish structure in play!
Forming higher highs & higher lows
Strong bounce from ₹405 support
Eyes on breakout above ₹426.30
Volume confirms buying interest again
More importantly, during this time, NSE:DELHIVERY usually goes to ₹450 as shown here:
https: //www.
Next target? Possibly ₹440–450+ if momentum holds 💪
Let’s see if this delivery gets shipped 🚚📦
Anand Rathi in BULLISH FLAG What more to explain about the beauty of the Ch(art)
- P Senthil Kumar
Chart Lover

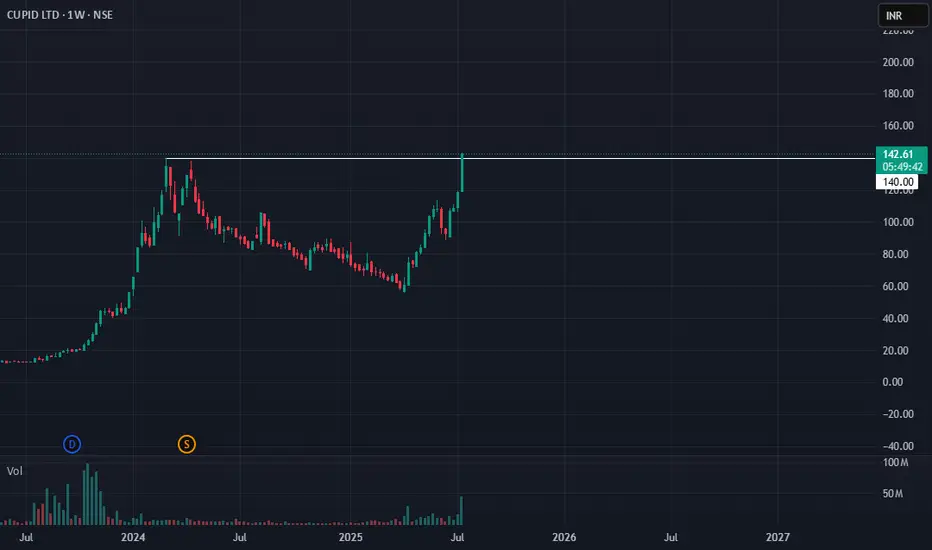
Cupid Ltd: Strong Weekly Volume Breakout!🚀 Cupid Ltd: Strong Weekly Volume Breakout! 🚀
📉 CMP: ₹141
🔒 Stop Loss: ₹88
🎯 Target: ₹220
🔍 Why Cupid Looks Promising?
✅ Rounding Bottom Breakout: Clear breakout on the weekly chart with strong volume support
✅ Volume Confirmation: High volumes indicate genuine buying interest and strength behind the move
✅ Big Stop Loss Strategy: Due to the nature of such breakouts, stocks often show large squats before continuing upward. Maintaining a big stop loss with controlled position sizing is critical to ride the trend.
💡 Strategy & Risk Management:
📈 Staggered Entry: Accumulate in phases to manage volatility
🔒 Strict SL: Keep stop loss at ₹88 and adjust position size to protect capital effectively
📍 Outlook: Cupid Ltd's technical setup suggests potential for significant upside, aligning with strong volume breakout patterns.
📉 Disclaimer: Not SEBI-registered. Please do your own research or consult a financial advisor before investing.
#CupidLtd #BreakoutTrade #VolumeBreakout #TechnicalAnalysis #SwingTrading #MarketInsights #InvestSmart
Let me know if you want breakout educational templates prepared for your upcoming weekend LinkedIn content plan.
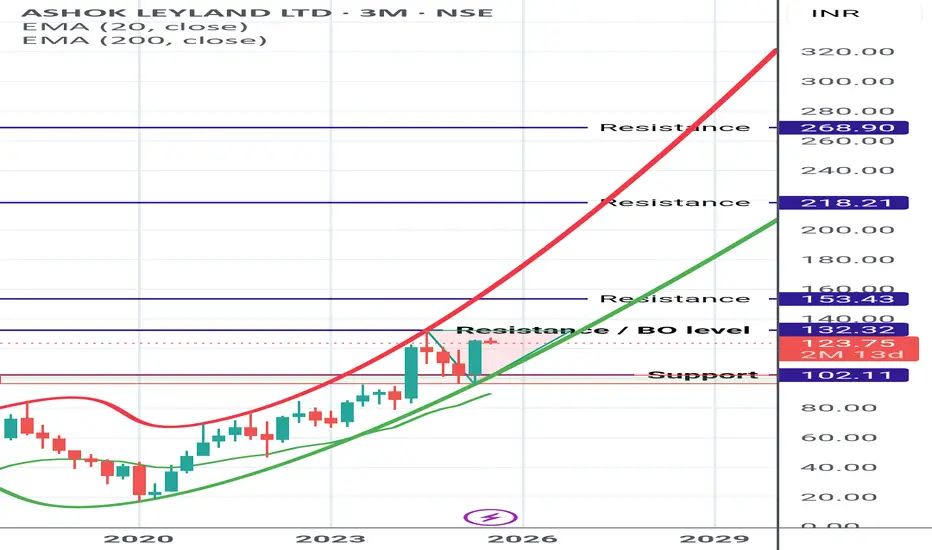
Ashok Ley land updated view Ashok ley land chart updated after price adjustment of bonus.
Currently trading in Parabolic uptrend pattern and inside Triangular zone.
On closing above the triangular marked zone (Breakout level) rest of the marked Resistance can be expected

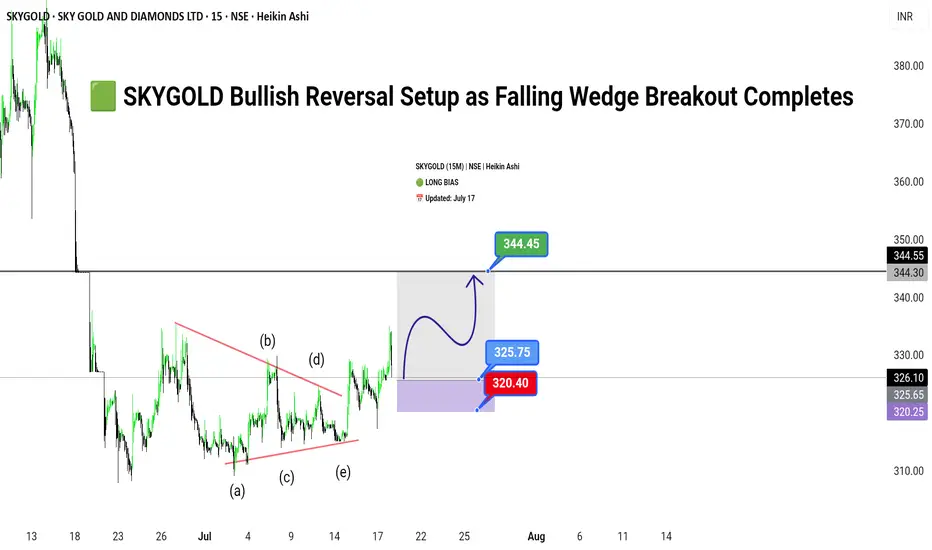
SKYGOLD Bullish Reversal Setup as Falling Wedge Breakout Complet🟩
SKYGOLD (15M) | NSE | Heikin Ashi
🟢 LONG BIAS
📅 Updated: July 17
---
🔍 Description
SKYGOLD has emerged from a prolonged corrective phase, breaking out of a well-defined falling wedge pattern on the 15-minute chart. The price action has respected a clean Elliott Wave ABCDE structure within the wedge, suggesting a completed consolidation cycle. With bullish momentum building above ₹325, the stock now appears poised for a breakout rally towards ₹344.45.
This setup reflects both a technical breakout and possible short-covering rally, making it an attractive opportunity for short-term swing traders. However, risk remains below the ₹320.40 zone, which invalidates the breakout structure if breached.
---
📊 Technical Structure (15M)
✅ Breakout above wedge resistance
✅ ABCDE wave structure complete (classic consolidation)
✅ Impulse targets in sight
📌 Upside Targets
First: ₹325.75
Final: ₹344.45
🔻 Risk Zone
Below: ₹320.40 (Breakdown invalidates setup)
---
📈 Fundamental/Flow Highlights
Sector Sentiment: Positive traction in mid-cap jewellery and gems segment.
Volume Spike: Notable rise in volume on breakout candle.
Short-Covering Potential: Highly likely due to prolonged consolidation.
---
⚠️ Risks to Watch
Sudden broad market correction in Nifty Midcap segment.
Lack of follow-through volume post-breakout.
Intraday rejection near ₹344 zone (previous supply).
---
🧭 Summary: Bias and Watchpoints
SKYGOLD is bullish above ₹325 with a breakout structure favoring continued upside toward ₹344.45. As long as the price holds above ₹320.40, the long thesis remains valid. Watch volume confirmation, and use trailing SL to lock gains.
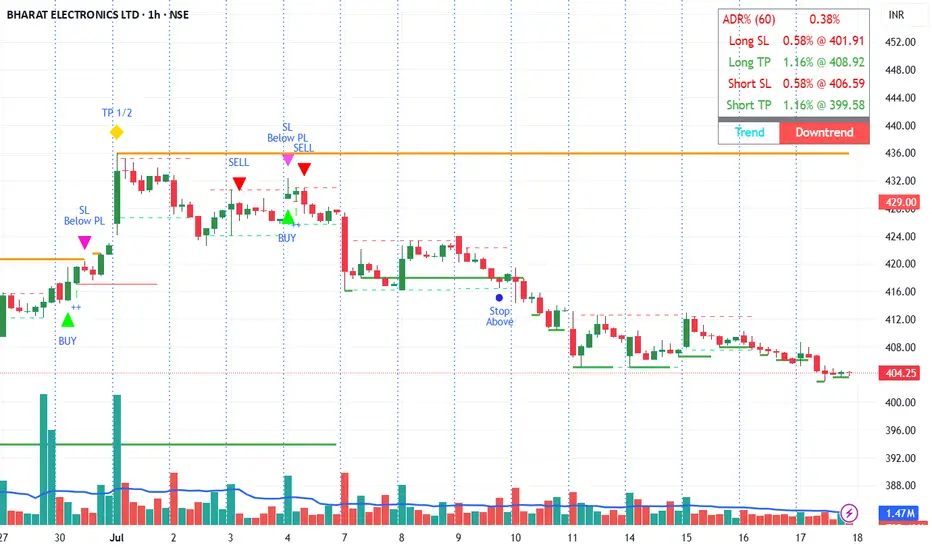
Recent trades on BHARAT ELECTRONICS LTDBHARAT ELECTRONICS LTD, Signal auto-generated by our Private Indicator, Serious traders can contact us for information.
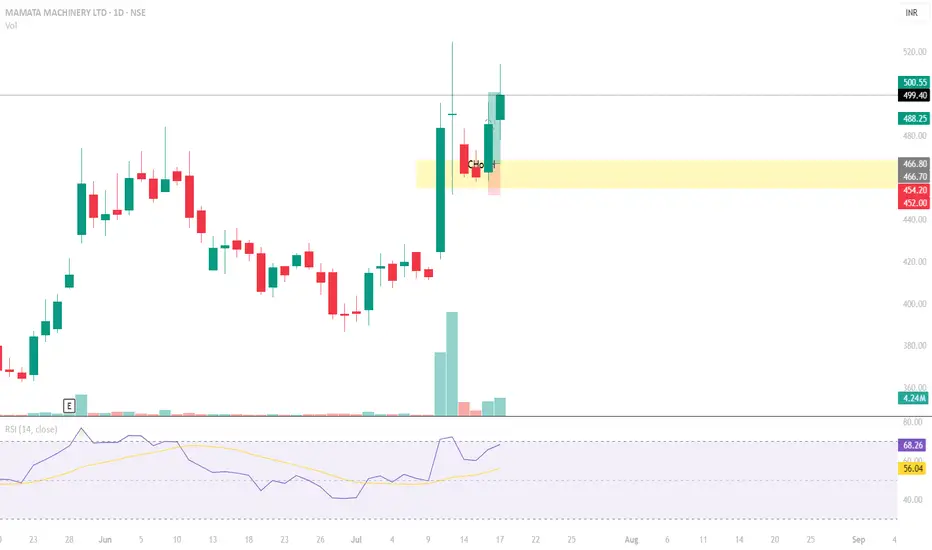
MAMATA MACHINERYTP HIT !!!
Had taken this stock at golden zone of fibnoacci retracement and had targeted the last high.
Although i closed all my positions at 1st TGT, the stock did hit my TP
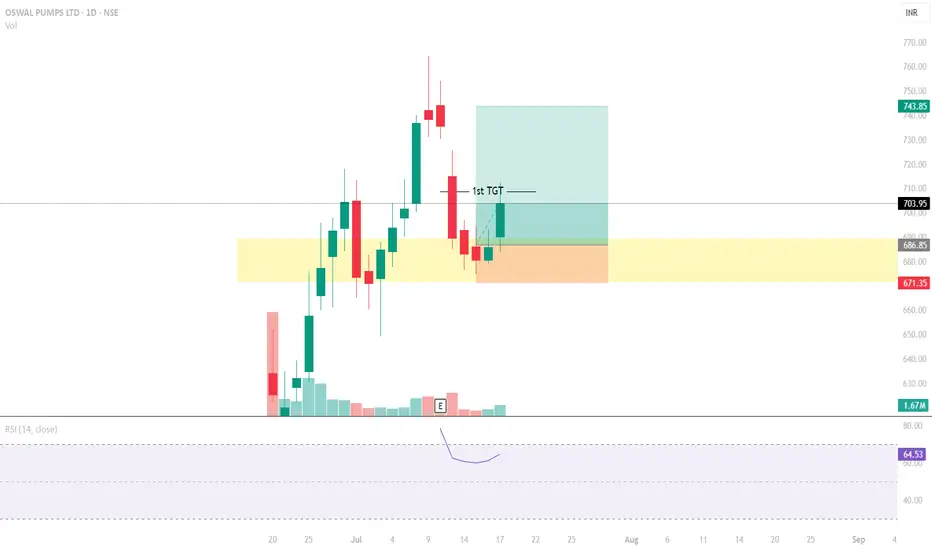
OSWAL PUMPSBased on my earlier prediction, the stock moved in my favour.
Also, i have exited all my positions at 1st TGT level