PANI - POWER PLAYI bought my positions today
September 25, 2023
The reasons:
1. Low-risk entry point
2. The stock is up >100% in less than 8 weeks
3. Corrected the least during the pause, less than 25% correction
4. Volume dries up as a sign of less supply coming to the market
5. High alpha stock with a low standard deviation
6. Good close on the breakout
The flaw:
The market is still in a hard-penny environment with only 36.7% of total stocks above the 200-day MA.
I'm still trading small with a pilot position until I see some trades work out fine.

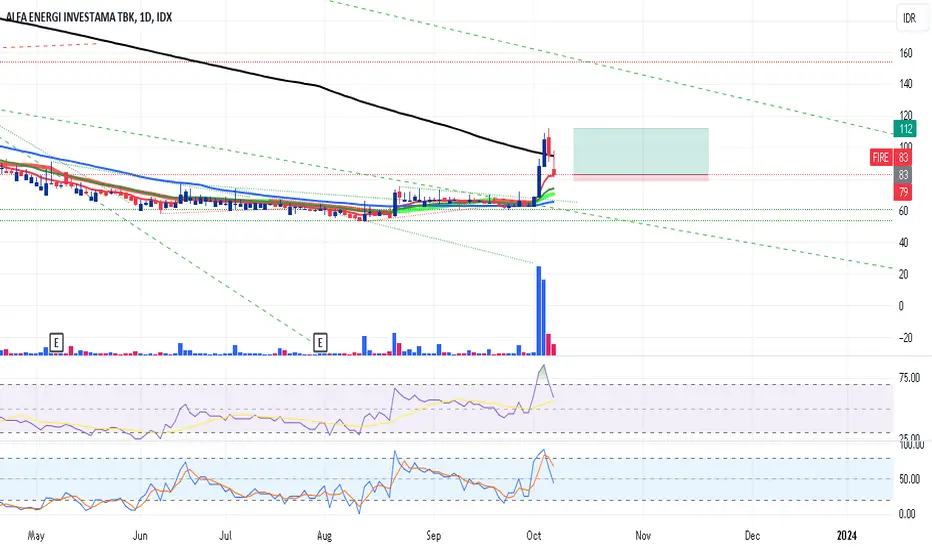


KAYU - POWER PLAYI bought my positions today
October 6, 2023
The reasons:
1. Low-risk entry with a crisp pivot point
2. The stock went up >100% in less than 8 weeks
3. VCP characteristics during the pause
4. The pause has less than 25% correction
4. Volume dries up as a sign of less supply coming to the market
5. Good close and Huge volume on the breakout
6. A high alpha stock with a low standard deviation
7. One of the leaders in this market environment
The flaw:
The market is still in a hard-penny environment with only 31% of total stocks above the 200-day MA.
This stock is so strong, a Power Play on top of a Power Play. I like to see some follow-throughs in the upcoming days.

Elnusa TBK, week#40We get a volume confirmation from Elnusa TBK, so we add some of it's shares
Our target is IDR.428,
support at IDR.410

BBCA: Navigating Correction with Strategic Entry Points for PoteIn this analysis, we delve into the recent movement of BBCA stock, particularly observing a noticeable gap around the 8500 level on September 22-23. The common market tendency to fill such gaps implies a potential downturn for BBCA shares.
Navigating the potential downturn, Fibonacci retracement analysis identifies 8525 or the 0.618 level as a strategic point for considering purchases. This zone often becomes a focal point for traders seeking buying momentum, especially in proximity to the golden ratio.
Risk management takes center stage in this context. By setting a stop-loss at 7975, traders can shield themselves from significant potential losses. This restriction is designed to ensure that losses do not exceed predetermined limits, aligning with individual risk tolerance.
As the journey unfolds, bullish confirmation around 8525 becomes pivotal for making buying decisions. This may involve technical signals indicating potential reversals, validating the purchasing strategy at predetermined levels.
Looking ahead, the target price of 10900 or the 1.618 Fibonacci retracement level provides perspective on potential upswings after a corrective phase. This becomes a focal point where traders may contemplate taking profits or adjusting their trading strategies.
In conclusion, this approach reflects a profound understanding of market dynamics and wise risk management practices. Professional traders remain vigilant to changes in market conditions, basing their decisions on in-depth analyses and carefully formulated plans.

Adaro Energy Indonesia TBK, week#39Adaro has reached it's value (IDR.2900-3100)
Potentially it can breaks IDR.3230
Support at IDR.2770

Pembangunan Perumahan TBK, week#39To the moon!
Our next target for PTPP is IDR.855
Support at IDR.720


STAA break bearish trendlinesimply bearish trend has been breakout by the closing price, indicate reversal of bullish momentum will be come soon


Coal Mining Stocks: Trend Reversal into Bullish Again!Hello Fellow Stock Traders, Here's a Technical Analysis of HRUM!
HRUM has successfully surged beyond the confines of its previous bearish trendline, a development that augurs a compelling potential for a trend reversal on the horizon. This optimistic momentum is further underscored by the notable ascent above the EMA200 line, a key technical indicator. Notably, this ascent is accompanied by the emergence of a distinct bullish flag pattern, which is often perceived as a harbinger of positive price action.
The recent breakout not only substantiates the newfound upward trajectory but also lends credence to the notion of a promising advancement toward the target zone. Moreover, the analysis of the oscillator reveals a particularly intriguing development - a golden cross formation within the oversold realm. This phenomenon significantly bolsters the case for a sustained bullish trend continuation.
In light of these intricate technical indicators aligning cohesively, market participants could find themselves well-positioned to anticipate a potentially favorable market ascent in the sessions ahead.
It is essential to note that the analysis will no longer hold validity once the target/support area is reached.
Please support the channel by engaging with the content, using the rocket button, and sharing your opinions in the comments below!
Disclaimer:
Please note that this analysis is solely for educational purposes and should not be considered as a recommendation to take a long or short position on IDX:HRUM ".

UNTR for Long Position while wait for the dividend?- Closing price as per Sept 15th, 2023 UNTR Rp 28.425 (+3.74%) with a full body candle and prevail above EMA 200. At the same above 61.8% (Rp 27900) Fibonacci level.
- There is still a GAP after Dividend cum date last April 2023.
- Pay attention whether there is a correction on Monday September 18th, 2023, could be a good deal to open position for swing and wait for the dividend + capital gain
DISCLAIMER ON
