BBRI Potential Drop to 3090 Before a ReboundI'm forecasting that BBRI may decline further to the 3090-2930 demand zone, where an unfilled order block exists. There's a potential bounce in the 3750-3690 area, but if selling pressure continues, the price could reach the lower support before reversing. Watching for confirmation at these key levels before taking action.
What do you think? let discuss below? 😊

Forecasting BBRI1. Key Support & Resistance Levels
Strong support: 3,620 – 3,500
Nearest resistance: 4,040 – 4,250
Major resistance: 4,800 – 5,025
Minor support: 3,810 (current price area)
2. Potential Price Movement
If the price holds at 3,810 and doesn’t break down to 3,620, there is a potential technical rebound toward 4,040 – 4,250.
If the price breaks down from 3,810 and breaches 3,620, there is a risk of further decline to 3,500 or even lower.
If the price rebounds from 3,810 and breaks through 4,040, there is potential for an upswing toward 4,250 – 4,510.
Entry Ideas & Reasons
📌 Buy Entry
Entry Level: 3,620 – 3,810 (strong support area)
Stop Loss: 3,500 (in case the price falls further)
Take Profit Target: 4,040 – 4,250 (nearest resistance)
Reason: The price is already at a historical support area. If there’s a bullish confirmation (reversal candle such as a hammer, doji, or bullish engulfing) in this zone, it can serve as a buy signal.

Analysis of BBRITechnical Analysis of BBRI
Price Level Analysis
Strong Support 3,800 - 3,900
Short-Term Resistance 4,100 - 4,300
Long-Term Resistance 4,600 - 4,800
Cut Loss Level 3,700 (if a deeper breakdown occurs)
📉 Current Situation: The price is approaching strong support at 3,900.
If a rebound occurs, the first target is 4,100 - 4,300.
If 4,300 resistance breaks, the price may rise to 4,600 - 4,800.
If it drops below 3,800, there is a risk of further decline.
❌ BBRI Risks
🔸 Economic Pressure & Inflation
If the economy slows down, non-performing loans (NPLs) could rise, affecting BBRI's profits.
Risks from MSMEs, which are more vulnerable to economic downturns.
High-interest rates could hamper credit growth.
🔸 High Interest Rates Policy
Bank Indonesia maintains high interest rates to control inflation, which could slow down new credit growth.
🔸 Competition from Fintech & Digital Banking
BBRI faces competition from digital banks like Bank Jago (ARTO), Bank Neo (BBYB), and others that are aggressively expanding digital services.

WIRG - VCP (18W 45/6/3T)IDX:WIRG
(+):
1. Very Low risk entry point on pivot level
2. Volume dries up
3. Price above MA 50 > 150 > 200 over 10 weeks
4. Price is within 25% of 52 weeks high
6. Price is over 30% of 52 weeks low
7. 200 day MA trending up over 1 month
8. RS Rating is over 70 (84)
9. Additional aspect about AI sentiment
10. Price breakout with huge volume
(-)
1. I am not sure about Volume from 15 January until today, i think it is a sign of taking profit action of big institute. Let see what's going on with this stock after i bought it
2. There is gap below on 17 january 2025, i am not a big fan of gap
Try to Adding with some basic fundamental about EPS growth:
a. Quarterly QoQ: −32.06%
b. Quarterly YoY: −14.26%
c. Annual YoY: +77.44%
d. TTM YoY: +46.99%
About fundamental aspect, maybe the stock is time to turn around

ELIT - LOW CHEATELIT - LOW CHEAT
(+):
1. Low risk entry point
2. Volume dries up
3. Price above MA 50 > 150 > 200 over 10 weeks
4. Price is within 25% of 52 weeks high
6. Price is over 30% of 52 weeks low
7. 200 day MA trending up over 1 month
8. RS Rating is over 70 (82)
9. Stock build VCP Characteristic
Try to Adding with some basic fundamental about EPS growth:
a. Quarterly QoQ: +31.29%
b. Quarterly YoY: 653.96%
c. Annual YoY: +75.48%
d. TTM YoY: +220.19%
(-):
1. Stock not confirm on stage 2 uptrend if not break the blue line
Note:
- Consider to add some position if break the blue line
- Market look bottoming, just wait this stock to breakout with high volume

BBRI My Personal Investment LevelThis is my view for BBRI. For me ideally I will only start to look for accumulating this share while price breaks below 3500 level. 3210-3490 would be very ideal scenario if it comes.

BBCA My Personal Investment LevelIndonesan BBCA share, personally I'll only start to look for buy while price below 8775. Below 8775 would be ideal for investment.

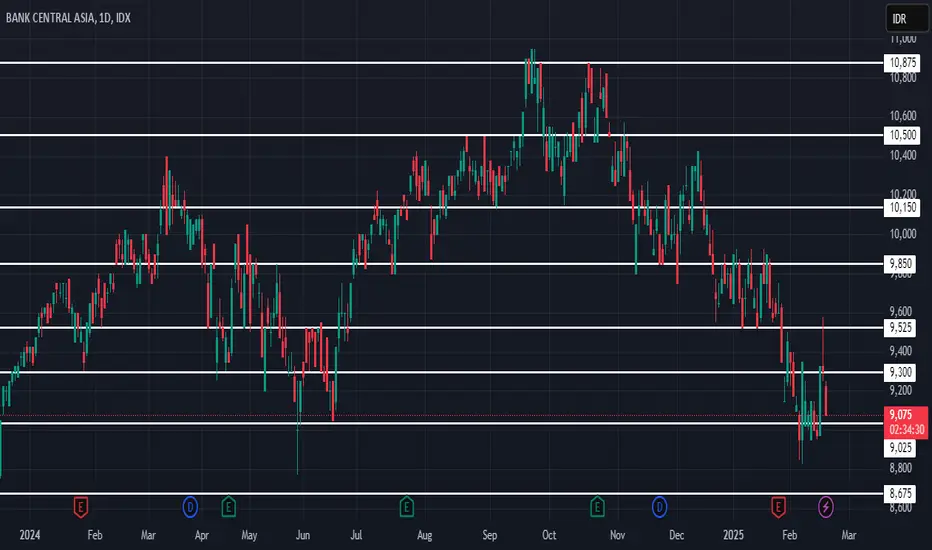
Technical Analysis BBCASupport Levels:
8,675 (Major Support)
9,025 (Minor Support, currently being tested)
Resistance Levels:
9,300 (Nearest Resistance)
9,525 (Next Resistance)
9,850 (Main Resistance in the Short Term)
Trading Plan
1. Buy Area (Entry Point):
Aggressive Buy: 9,025 – 9,100 with a target of 9,300 – 9,525.
Conservative Buy: 8,675 if the price breaks down from 9,025.
2. Sell Area (Take Profit):
TP1: 9,300 (first resistance)
TP2: 9,525 (second resistance)
TP3: 9,850 (if the trend starts turning bullish)
3. Stop Loss (SL):
If the price drops below 8,900, exit to minimize risk.
CPO Malaysia Finishing Pullback Phase. Back To DowntrendCPO Malaysia ( MYX:FCPO1! ) is about to fall to MYR3,900 as it finishes Pullback phase

AADI AnalysisAADI interesting to note. There is still a bullish opportunity, wait for the retracement moment.
Buy AADI in range price 7700
Target price 9500

BBRI why not?I am aggresively buying BBRI with SL on 3700 and TP 5150.
Who's with me?
CHEEERRRSSS...!!!


BBRI AnalysisIn the monthly basis, BBRI is very clear in accordance with the trendline and price action analysis with order block

Prediction About Mandiri Bank BMRIBank Mandiri IDX:BMRI is currently trading at 5,050, showing signs of weakness as it struggles to hold key support levels. If the stock fails to maintain support, we could see further downside movement, potentially testing levels around 4,500. This scenario aligns with the broader market sentiment and recent technical patterns.
Investors should closely monitor price action near the support zone, as a decisive breakdown may trigger increased selling pressure. However, if BMRI manages to hold above support and gains bullish momentum, a rebound could be in play. Keep an eye on volume and market conditions for confirmation before making any trading decisions.

NEST - CUP WITH HANDLEPosition Update: February 6, 2025
Key factors :
1. Low-risk entry point.
2. Very clear bases with VCP characteristics.
3. Has gone through its majority line of supply.
4. Moving on its own drummer, the stock price increased while the market crashing down.
5. High relative strength stock.
6. Volume dries up as less supply coming to the market.
7. The breakout was confirmed with a huge surge in volume.
Considerations : The current market environment remains challenging, with broader indices showing uncertain and inconsistent behavior. It is very few stocks that setting up decent bases.
I’d like to see if it can hold up and follow through from here.

ADRO faces decline to 2000-1900 areaOur technical rating for ADRO is sell, according to our 1 week rating the strong sell trend is prevailing, and 1 month rating shows the sell signal. We expected that price would be going to 2000-1900 area before bullish.

Telkom Indonesia (TLKM): A Technical Setup You Can't Miss!Telkom Indonesia (TLKM) Stock Analysis
Date: January 22, 2025
________________________________________
1. Technical Analysis
A. Support and Resistance:
• Strong support is observed at the 2,490 level (lower red line), which has been tested multiple times.
• Nearest resistance is at 2,870, with the next target resistance at 3,250.
B. Indicators:
• The 200-day SMA is at 2,955, indicating a long-term bearish trend as the current price remains below the SMA 200.
• RSI (14) stands at 54.42, suggesting moderate bullish momentum but not yet in the overbought area (>70).
• A rising RSI also indicates a bullish divergence, signaling a potential trend reversal.
C. Volume and Price Patterns:
• The price is moving sideways within a consolidation range of 2,490–2,870, with potential for a breakout if the 2,870 level is breached.
• A valid breakout could push the price towards 3,250.
________________________________________
2. Recommendations
A. Daily Time Frame Supports Swing Trading:
• Analysis on the daily time frame is often utilized by swing traders to project price movements over weeks rather than days, especially when support and resistance levels are identified over a broad range (here: 2,490 to 3,250).
B. 3,250 Target as Major Resistance:
• Resistance at 3,250 is significant in the context of the chart. As a strong level, the price might take several weeks to reach it, especially if volume does not support an aggressive breakout.
C. RSI Divergence Requires Time:
• Bullish divergence on RSI typically indicates a larger trend reversal rather than minor movements. This suggests that a rise towards 3,250 is better viewed as a medium-term target, especially since TLKM remains below the 200-day SMA, meaning a new trend might take time to form.
D. Stop Loss:
• Set a tight stop loss below the support level of 2,490 to minimize potential losses.
Notes:
• Considering the above factors, the 3,250 target is more suitable for a medium-term swing trade rather than a short-term play:
1. The daily time frame supports multi-week price movement analysis.
2. The 3,250 target is a significant resistance level, likely requiring more than a few days to be reached.
3. The stock is still in a consolidation phase, requiring validation of a new trend for consistent upward movement.
4. For swing traders, use this analysis for a medium-term target (2-4 weeks).
5. For short-term traders, a target between 2,950 and 3,000 may be more realistic, taking quicker profits before reaching the major resistance at 3,250.
________________________________________
3. Risk Management
A. Stop Loss:
• Set a stop loss at 2,490 to limit losses.
B. Risk-to-Reward Ratio (RRR):
• With a target of 3,250 and a stop loss at 2,490, the RRR is 1:1.
• This setup is suitable for traders willing to accept risk with equal potential rewards. Traders seeking higher RRR may consider raising the target price or narrowing the stop loss.
________________________________________
4. Capital Management
• In the cash market, capital allocation should remain disciplined to manage risks effectively. Allocate 5-10% of the total portfolio for this position.
• For investors with higher confidence and risk tolerance, allocation may increase to 10-15%, given the clear support and resistance levels to guide disciplined execution.
• Avoid allocating more than 15% of the portfolio to a single stock to maintain diversification and mitigate adverse market impacts.
________________________________________
Conclusion
Telkom Indonesia (TLKM) shows potential for a trend reversal, supported by bullish RSI divergence. A breakout above the 2,870 resistance level will confirm an entry point. However, investors should remain cautious about potential price retracements to the support area at 2,490, which could negate this bullish trend.

Posting for FUNSince I am in my free time, .. I'm checking on some local stock market..
This time is BBCA,
The long term idea on the trend might rest for a while around 8200-8500, before continuing it s uptrend. Since nothing go up forever.
Well, not a trading advise though, as me myself is not holding on this stock (because running tooo slooow xD)
IF im right, it will be a great timing for long term investors to add more investment in it..
Thank you and have a happy trading day!

Bearish Divergence IndicationCUAN has been experiencing significant trading volume, particularly after its inclusion in the FTSE index. Given its strong uptrend, it is important to be cautious of potential reversals, especially since the current price is near its all-time high. A bearish divergence is observed on the 1-hour chart using the MACD indicator, as the candlestick pattern shows an upward trend while the MACD line indicates a downward trend. This divergence could signal a minor correction within the major uptrend, with a potential price pullback to the first support level (13,675 - 13,500). This potential correction presents an opportunity to enter new positions at a more attractive price, considering the average market price of big funds at 12,138, based on accumulation since December 12, 2024. However, this bearish signal would be more confirmed if the MACD line crosses below the signal line.
Disclaimer: This analysis is for general information purposes only and does not constitute financial advice. Investment decisions should be made based on an individual's specific financial situation and after consulting with a qualified financial advisor. The author is not responsible for any investment losses

On the way to Devidend MomentumThe historical track record indicates that the final dividend share for BBRI typically occurs in March. This presents an opportunity to strategically position our portfolio. We can either aim to capture the dividend payout or capitalize on the potential price pullback that often follows the dividend distribution (At ex-date candle gap). To maximize our entry point, we can wait for BBRI to reach its nearest weekly support level, as it is currently trading close to it and being strong support. This approach allows us to potentially acquire shares at a discounted price, especially considering the current downtrend.

Buy BBRI at monthly areaBBRI is currently standing at 4090 and still in its strong downtrend. We have to wait what this January 25 monthly candle tells and if there is some kind of reversal we can start to buy.
For the more aggressive one, we can start to buy at 3600-3700 level.

BBNI Complex Correction?The banking rally at the start of December turns out to be a fakeout after all. Today BBNI gapped down and closed just 1 tick above today's low, with HEAVY volume. This shows that BBNI, and most probably other banking stocks haven't found their bottom yet.
If this scenario were to succed, then we will see a rally to welcome the dividend season.

ALDO - CUP WITH HANDLEIDX:ALDO (CUP WITH HANDLE)
28-10-2024
(+):
1. Low risk entry point, first time the stock showing it’s buying point
2. Volume dries up on handle
3. Stock showing it’s strength while market is corrected
4. Price above MA 50 > 150 > 200 over 10 weeks
5. Price is within 25% of 52 weeks high
6. Price is over 30% of 52 weeks low
7. 200 day MA trending up over 1 month
8. RS Rating is over 70 (82)
(-):
1. Not really confirmed Stage 2, there is high that need to break out at price 520
