
Most of Construction Stocks still SidewaysMost of these Construction Sectors are still Sideways. However, there is one stocks that has the best signs of ending its Sideways and that stock is ADHI. Another promising stocks is PTPP then WSKT. WIKA is the least favourite.
ADHI has broken up its Resistance at IDR790. Though it is now below that level, ADHI still maintain Up Trendline from end of May 2022. I see an Uptrend based on Peak and Trough Analysis.
PTPP and WSKT shows the same signs but PTPP has more promising feature of an Uptrend (PTPP once broken up its Resistance at IDR990) while WSKT never break up its Resistance.
WIKA also once broken up its Resistance at IDR1,005 but I don't see Higher Low from end of May 2022 (which I believe is the strong sign of Uptrend).


GOTO - POWER PLAYI secured my position today, a pilot buys right from a low cheat level in a power play.

BBCA will go to demand area and retest trendlineBBCA will go to the demand area since the prices formed a rising wedge chart pattern.


LPPF start to reversalanother oppportunity in LPPF on inverted H&S pattern.
buy on weakness area : 4920-4840
Target Price 1 : 5400
Target Price 2 : 5850
Stoploss : when closing price under 4730

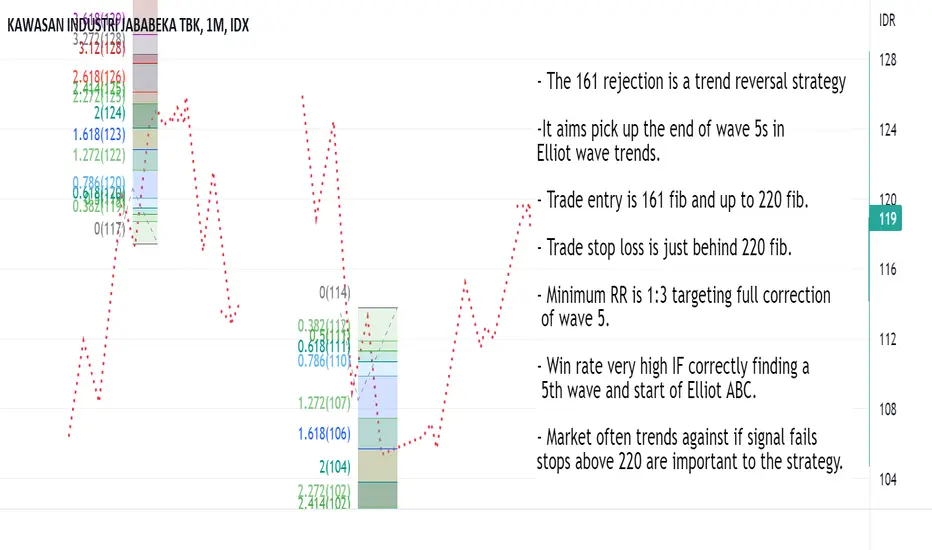
161 Rejection Strategy Strategy Name: 161 Rejection
Type of strategy: A reversal strategy.
Conditions for use: This strategy is used if there are valid Elliot wave trend legs. It is used to attempt to trade the reversal of wave 5 into the ABC correction.
Drawing the fib swing:
In Elliot wave, there should be a consistent trend and then this starting to get a bit more messy. The messy stuff will usually have a false reversal. A range and breakout of the range making it look like the trend has ended. From this there will come another big trend leg (Wave 5).
We are able to draw our swing when we have seen:
A steady trend with few dips. Starting to pick up pace.
The trend getting choppy and probably false reversals.
A new high/low being made in the trend.
Once we have these, we can fib the range and the 161 - 220 of this is our intended zone of entry for reversals. Also where we want to be protective of any profits we have from trading the trend. Even if not betting on reversal, it’s wise to trail stops tight into these levels. 161s can create reversals.
When a strong wave 3 has transitioned into a range and a pullback in the trend, this is when we can draw fibs on the pullback and look for this trade.
Basic strategy theory:
In the guidelines for Elliot wave 161 extensions are mentioned as a common ending point. And if you go through lots of examples of reversals you’ll probably come to see that has a point. Strategy is based loosely on that Elliot wave guideline. That it should be obvious seeing the hyper strong wave 5 into 161 extensions if you draw them.
To make a guideline into a practical strategy we need to work out entry and exit criteria. In testing I’ve found the reversal usually will come from the 161 or close to the 220. Sometimes just kissing the 220 fib. In most instances price is able to break the 220 the planned trade will fail. That’s why the stop is there.
Things we usually see before the strategy trades:
An early spot to notice this setting up is late into wave 3. Late into wave 3 the trend in question will be getting a lot of attention. You should look for strong trends that seem to be getting stronger and if it’s a big move there should be a lot of public chatter about it and forecasts getting increasingly more optimistic.
This obviously strong trend should transition into a messy range and/or sharp pullback. Then there should be the fastest move of the trend so far when this pullback reverses. Confidence in the trend should be ultra high and price should be consistently trending up to the 161.
Thing we usually see when strategy is not working (Stop loss conditions):
This is a great strategy when it works but it fails when used in the wrong part of a move in a big way. The rules for this strategy are price reverses at or before 220 fib. When it fails we either break the 220 and head into a strong trend or we go a bit over, make pullback smaller than we were targeting and the 220 make big break next time.
It’s best to stop out over the 220 in case a big trend move comes. Unfortunately, it’s also the case that a lot of time price will go just over the 220 and then pullback. It won’t be the target swing the trade was taking, but it would have put the trade in profit. Which means you can stop out at the worst time.
After a 220 break the probability of a bigger pullback decrease. It’s usually better to switch to following the trend and enter into any big pullbacks retesting previous support/resistance levels. Which is worth noting, it’s tempting to enter again if stopped out and it looks like it’s working. Often a trap.
Strategy strengths: Can be very high risk:reward. Helps a lot with protecting profits in a running trend trade. When this is working once the swings targeted start they are often strong and smooth and easy to take close to the full value of the move. Trailing stops do not hit and big profit targets can.
Strategy weaknesses: When used in a move that is not forming a wave 5 (For example using it through wave 3) this strategy generates false signals that price will usually trend against. Losses not cut can be devastating. Entries can sometimes be spiked out at the end of a move just over the 220 fib.
IDX: SMGR Reverse Head n ShoulderTime to wait n see to buy $SMGR on Jakarta Composite Index. $SMGR is a State-Owned Enterprises, bluechip, with a good financial report and it possible to BOOM! in 2022. Lets to tracking on the news and flow of big capital by foreign or domestic.
#DYOR
*not financial advice

Pick your Indonesia CPO StocksThe charts above are Ratio Charts among CPO Stocks such as : AALI, LSIP, SSMS, DSNG and TAPG.
If the chart is rising, it means that the stock is Outperform compare to other CPO Stocks.
If the chart is falling, it means that the stock is Underperform compare to other CPO Stocks.
Trend Analysis and Peak Analysis can be applied here.

MCOL - POWER PLAYI've secured my positions incrementally from 16th June coming from a sound power play setup.

MTMH - FLAT BASEI secured my position back today.
The stock broke out of a flat base with VCP characteristics.

ZONE - POWER PLAYI got my position earlier on 19th May at its Low Cheat level.
This is a strong Power Play setup with huge volume on the breakout. It even has a fractal, a small cup with handle on its tight right side.

WIKA potential reversal on weekly time frameWIKA on double bottom pattern, try to reversal. good opportunity.
buy area 975-1020
Target price 1 : 1115
Target Price 2 : 1180
Stoploss : when closing price under 920

ENAK - CUP WITH HANDLEI secured a position on the breakout that I bought incrementally.
The stock has VCP characteristics, it breaks its pivot with pretty good volume today.


BSDETechnical Analysis is the forecasting of future financial price movements based on an examination of past price movements. Like weather forecasting, technical analysis does not result in absolute predictions about the future.

ADMRTechnical Analysis is the forecasting of future financial price movements based on an examination of past price movements. Like weather forecasting, technical analysis does not result in absolute predictions about the future.

SMGR WEEKLY FALLING WEDGE PATTERNThere is Falling Wedge Pattern in both Daily and Weekly chart on this stock.
And the Weekly Stochastic already in oversold area + Bullish Divergence detected too.
Wait until the price breakout the falling wedge pattern to entry.
For me, i will wait until the price breakout the falling wedge and wait the retest or correction done.
Disclaimer ON

PNBN - POWER PLAYI got my position today from a power-play setup.
Then, I also have reduced some positions when it squats, but the stock comes back and closes good.

ASSA PredictionDuring this stock market correction era, i analyzed ASSA using Elliot Wave and it's principles. I found ASSA's current wave is on its correction phase. My suggestion is to short or make an entry on its support (1170-1255)
*huge disclaimer

ANTMTechnical Analysis is the forecasting of future financial price movements based on an examination of past price movements. Like weather forecasting, technical analysis does not result in absolute predictions about the future.

BBCATechnical Analysis is the forecasting of future financial price movements based on an examination of past price movements. Like weather forecasting, technical analysis does not result in absolute predictions about the future.
