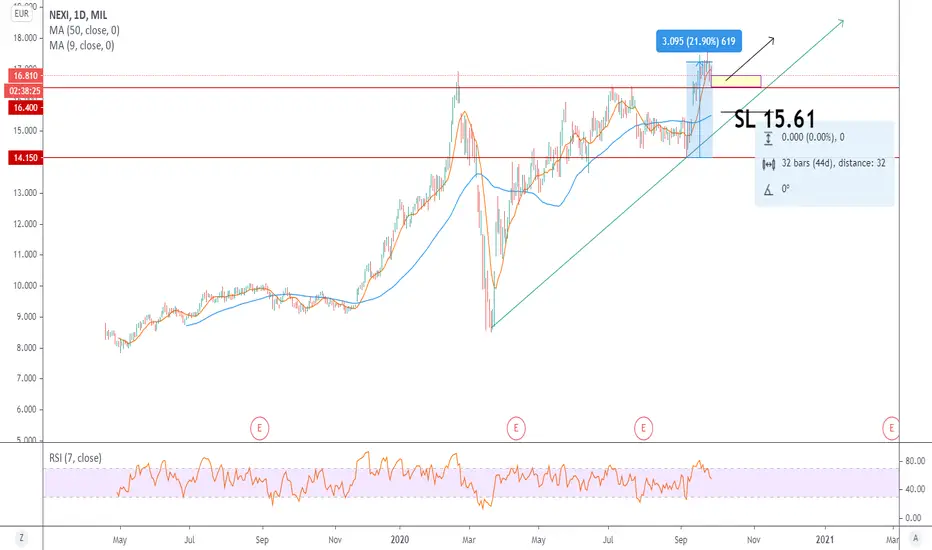
Medium-Long Term NEXIA few lines and indicators to explain the potential of this asset.
The stock of the company that manages electronic payments and credit cards, has returned to the attention of investors due to rumors about a possible merger with Sia, the Milanese group of services for the banking system controlled by Cassa Depositi e Prestiti (the major Italian promotional institution for economic development through long-term investments at local, regional and national level). The Cassa Depositi e Prestiti could also play a role in the operation.
Despite the bearish market period and the uncertainties due to the covid pandemic, the technology sector, and specifically smart payments, remains a reference point for long-term investments.
A good medium-long term strategy would be to open a long position with SL at €15,61 and first TP at €20,00 (20%). A buy the deep strategy for daily and weekly traders could be an equally profitable opportunity.

Short Position (Ferrari MIL)The Market is start going Down from now, I do recommend to Sell now.
it's a short Position.

🎾 Deal 151 ATP Djokovic – Nadal. +750,000 rubles on the victoryToday, in the final match of the French open tennis championship, two of the best rackets in the world meet — Novak Djokovic (1st place in the ATP ranking) and Rafael Nadal (2nd place in the ATP). At Roland Garros, the Spaniard has an absolute superiority of victories (6-1) and we believe that this time he will also win (as they say in the powerful practice of "trading Tribe" ed Seikota — "just embrace the trend"). We will bet on his victory with the opportunity to earn +75% and as always explain why we do it!
Warning! Any bet can lose, so it is important to remember about money management and invest no more than 2% in one transaction! We not only describe our own opinion, but also put the funds of
the
Description Fund on it before the match
Let's start as always with the most important thing – statistics. So, this will be the 57th match between Djokovic and Nadal (the most intense confrontation in the history of men's tennis). In General, Djokovic currently leads the competition — 29:26. in the finals, he is ahead 15:11, but in the Grand slam finals, the score is equal — 4:4. on the ground, Nadal leads 17:7, and in the clay finals — 7:4. at Roland Garros, the Spaniard won six of the seven previous meetings. Rafael Nadal is a 12-time Roland Garros champion. Novak Djokovic has won the French slam only once.
On the way to the final, both tennis players showed good statistics, but Nadal's performances were more confident — not a single set lost, Novak Djokovic lost 3 sets! By the way, if you have noticed, we can often observe interesting coincidences that help us win more often and earn more – for example, yesterday in the women's final, Shventek beat the American Kenin 2-0 (according to the Fund, we earned on this deal in life +42% putting Shventek on victory, there are proofs ) and the passage to the final of the pole was as confident as Rafael Nadal! A coincidence? We don't think.
Did not lose a single final to Roland Garros»
Rafael Nadal is the "king of the ground", no one plays on this surface as well as he does. The most interesting thing is that at the moment Rafa has not lost a single final "Roland Garros" and it will happen this time is not known. Some experts say that he will win without losing a single set (by the way, we conducted an interesting study of how much you could earn by betting on a dry victory in all Raphael's matches, if you remember the same study was with the undefeated Khabib in the UFC), others say that it will be a hard fight and he will lose, others say ... in General, we believe that until you put your money As they say in the book "Memoirs of a stock speculator" by Edwin Lefevre — "nothing is known until you make a bet!".
PS: in any case, put no more than what you are ready to lose, remember about managing emotions, capital and the system, and know that absolutely any idea and deal can lose!


Possible head and shoulders on BAYER?The price cannot go below 52.20€. If the price goes below, the forming head and shoulders pattern fails. If the price bounces and goes to the point A, breaks the neckline, then we can see a upside trend inversion. What do you think about?

NeutraKeep an eye on the global situation. This title is everithing about the global pandemic situation. FCT has outstanding fundamental, their current investment take FCT to lead its sector, if the global situation will overcome, on the chart will be reflected all the positive externalitive that are not be view on chart till now.

Market analysis of DANIELI & CThis analysis based on the breakout of the trending range.
Once the Market break this triangle, We can make a profit at 18.52


ADIDAS : Swing, 100% Price ActionADIDAS : Follow the uptrend. Look at my other analyzes, great profit :)
Feel free to like❤, comment📝, share👫 and follow me for other analyzes🌍
I predict with the best probability the future trends, my ideas are reserved for the experienced trader. #UniversTrader

TSLA is showing a big momentum, defenitly in a buy positionTSLA is showing a big momentum defenitly in a buy position


Dont be fomo! UNISWAP ABOUT TO BREAKDOWN 2-3 usd area!Depending on my chart study Uniswap will get a recovery at back trend.
In the picture you see about breakout - but means breakdown.
I will add later more details about the expecting.
This are not an advice, take your own plan/and study to trade.
Have good time all (:


Possible bearish week for UNICREDIT Possible bearish week once the price tests the upper line of the triangular formation. Risky trade given that we are almost at the end of the formation, it could be unstable so I recommend using a very tight stop loss

TESLA We can see that the market still going up
and the volume rises up too which means we should buy


LVMHHello everyone,
A good opportunity has been detected on the LVMH stock.
After strong upward movement on the LVMH stock, the price
found resistance on a strong resistance level, pulled back and
is currently correcting to the downside.
We are expecting the price to reach approximately the 390.500 price
area, where we have a 50.0% Fibonacci retracement level, a support
point, as well as the 100 Moving Average and the 200 Moving Average.

What is a pennant?A pennant is a continuation pattern.
Statistics of pennant patterns
- In 75% of cases: a pennant’s continues in the same direction.
- In 15% of cases: a pennant’s continues tries to continue in the same direction but pulls back.
- In 55% of cases, a pennant continues in the same direction and reaches his target.
Notes on pennant patterns
- pennants with a narrow base perform better
- A pennant is stronger if there are no false breaks (false pattern exits).
- If their are pullbacks after exit from the pennant: its bad for its performance.


LONG LDOGood structore here. The title is recharging, it seems to be ready to the pull-back. Target price on the medium term 7,5. A retest on the support line at 5 is likely. Due to fundamental analysis, LDO have bright prospective on the long run, now, we are in a very low price zone: best moment to buy for a long term portfolio. LDO has low variance: the risk is very low. Perfect moment and perfect stock to buy.
