BANK OF KIGALIThe Bank of Kigali has strong fundamentals that can go unnoticed to most. It is a strong Bank serving one of the fastest growing economies in Africa, with about a 30% holding of Rwanda's Banking sector.
Fundamentally, the Bank of Kigali is undervalued. We will be looking at accumulating the Bank of Kigali in the coming months..

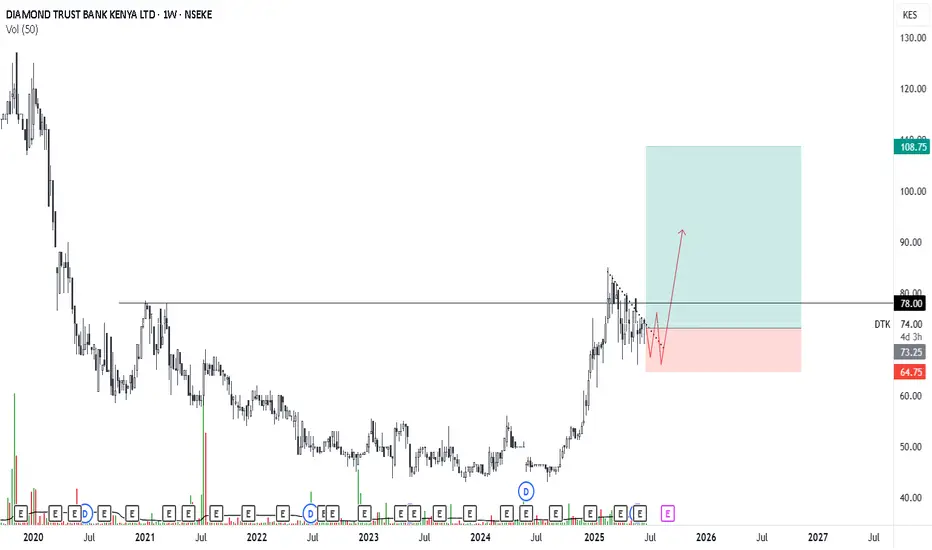
Diamond Trust BankDespite a strong stock price recovery of Kenyan banks since Covid-19, DTK has not been part of the party. This gives us a good opportunity to accumulate DTK at a discounted price between Kes 60.00 and 80.00.
There is a low probability for the stock price to fall and stay below Kes 60.00 unless political or social risks escalate in the country or globally.

DTK LONG some fundamental analysts have chalked DTK as a stock to buy with significant upside potential.
we like to focus more on the technicals. price is currently digesting the recent run-in price. the wicks on the above timeframe indicate that the bulls are still in the game. the support region is quite visible on the daily timeframe.
entry triggers include:
1. breach of downward sloping trendline.
2. breakout through most recent high.
stop loss:
a strong close below support region.
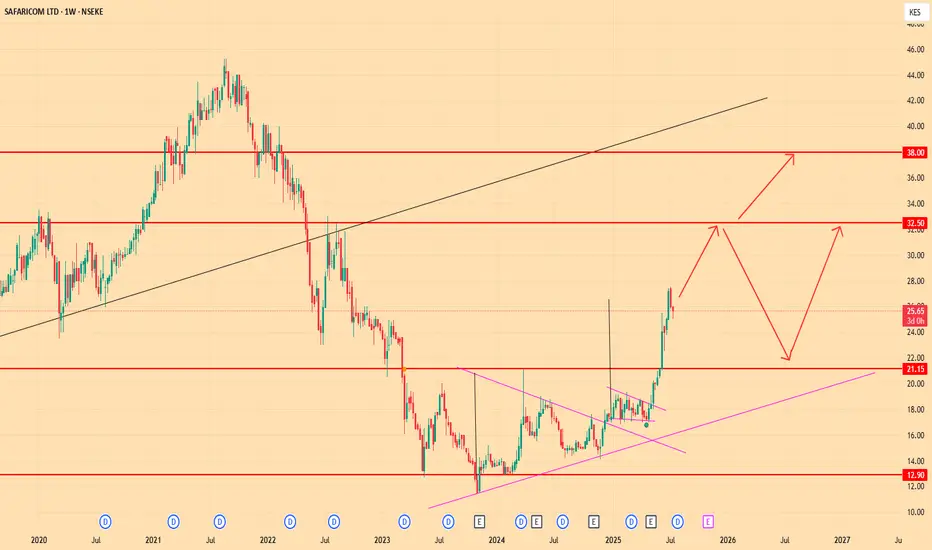
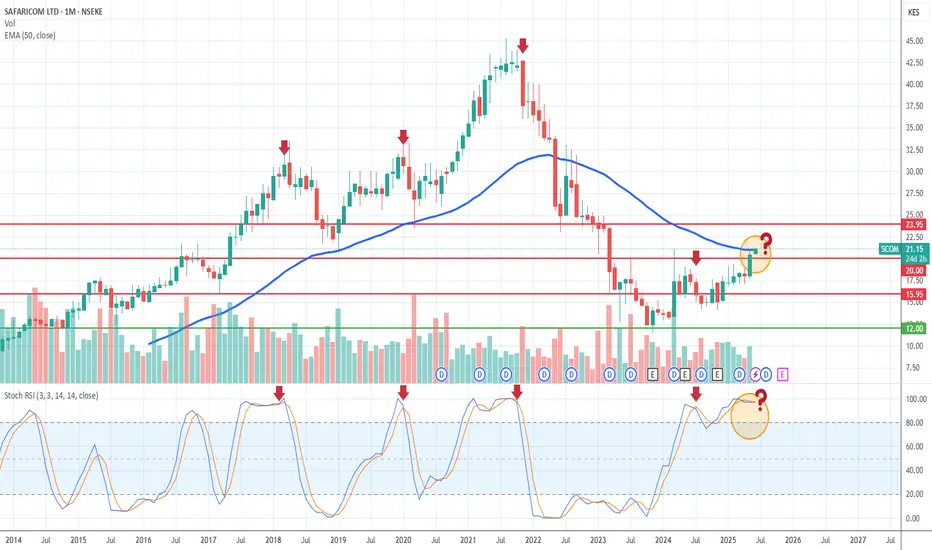
SAFARICOMOn the monthly chart, the Safaricom stock price is facing multiple technical resistance. Kes 20.00 is a critical psychological number to Kenyan traders, and this is evident with the convergence of technical indicators around this price.
If the stock price trades above Kes 22 on the weekly chart, the stock price will confirm a long-term breakout. If not, technical resistance will keep the price below Kes 20.00 in the short term.
STANDARD CHARTERED BANK KENYA1. SCBK 2025 Q1 profits fell by 13%.
2. Falling interest rates will put more pressure on the banks' Q2 earnings expectations.
3. Legal gremlins to settle.
4. A slowing local and global economy.
Fundamentally, the stock price is trading at a premium.

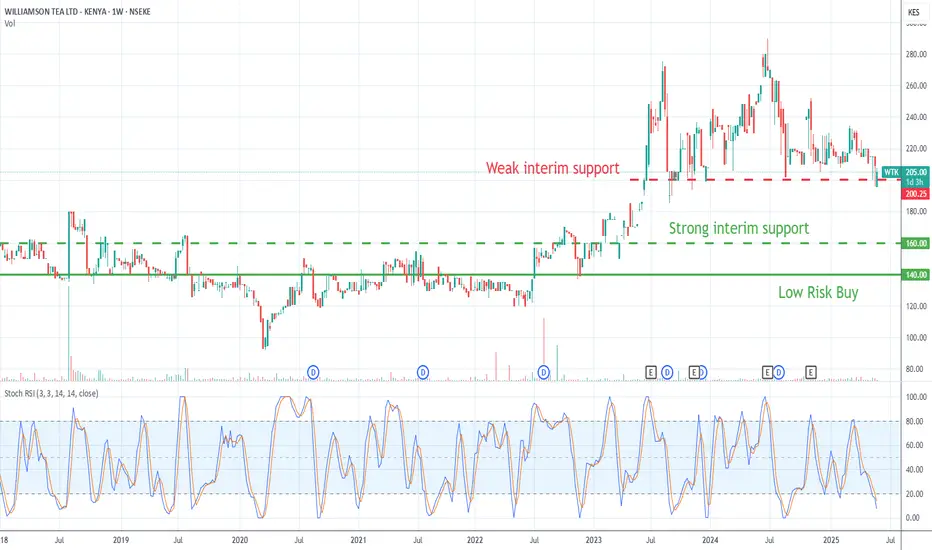
WILLIAMSON TEA KENYAStaying on the sidelines on Williamson Tea Kenya.
Fundamentally, the tea industry will be a victim of climate change, which has already proven to have a negative impact on tea quality and yield. Plus, we have seen an increase in exports from other tea-producing countries, which has reduced the demand for Kenyan tea.
Technically, the stock price has weak support at the dotted levels. The order book shows signs of weak demand and a whale exit will push the price lower.
BATBAT was a bit unpredictable after such a huge GAP DOWN but it presented an opportunity to buy the stock at a discounted price for a medium-term position.
Most of the time, a GAP DOWN has to be filled before the stock price resumes its' downward trajectory. The stock price will recover to its previous support, in this case Kes 400, which will be the new resistance and the stock will settle at a new support price, or obey historical support levels.
This analysis is in line with the upcoming book closure. The stock price will not hold above Kes 400.

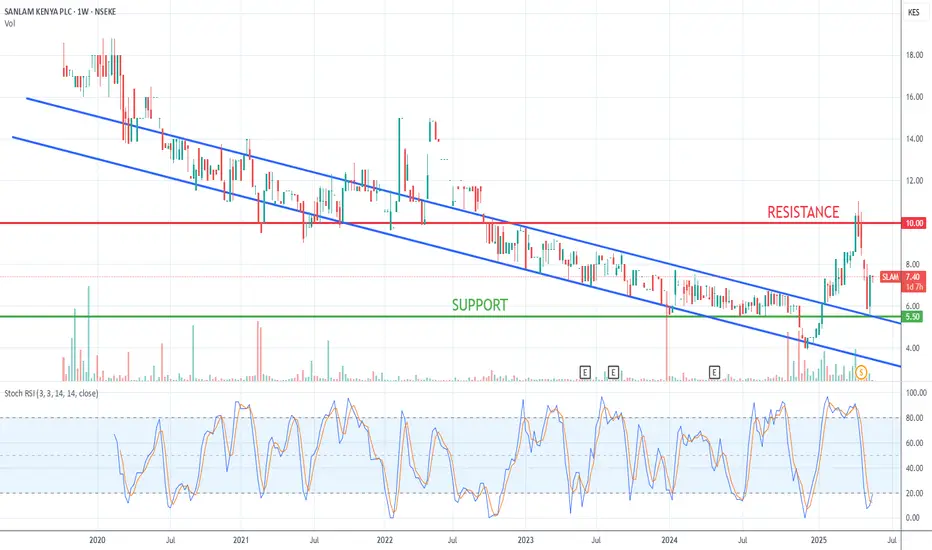
SANLAM KENYASanlam has a predictable price action that I have been using to day trade or weekly trade the stock. This is the chart I have used this year to look for entries and exits.
For long-term investors, look at the Stochastic, RSI chart.
Sanlam has the potential for a profitable short-term trade or a promising long-term accumulative stock.

ABSA BANK KENYAABSA Bank and Co-operative Bank Kenya have a strong positive correlation. In 2025, we have seen the correlation drop with a small margin, and Co-operative Bank stock price did not move higher as much as ABSA did.
Both bank dividend payouts have a difference of .05, which is negligible. Fundamentally, Co-operative Bank has stronger fundamentals than ABSA Bank Kenya. From a risk-reward perspective (stock price & dividends), Co-operative Bank is more attractive than ABSA Bank.
However, I am anticipating this to change in the future. ABSA Bank Kenya has the probability of becoming a bigger and more attractive bank than Co-operative Bank.
Based on the Chart, the share price of ABSA bank is worth looking at post-book closure on the 30th of April, 2025. If it is a dividend drive, Co-operative Bank is a better alternative.

Co-operative Bank KenyaKeeping it simple......
The dotted lines show high-risk price to buy Co-operative bank. The stock price has a high probability of trading below these price levels. If you are considering buying, purchase small volumes at these prices.
The solid lines are strong support levels. They provide medium-risk entry prices to accumulate the stock. Kes 13.00 and 12.00 are strong support prices.
At Kes 10.50 and below, the risk is low, and provides the best opportunities to accumulate the stock in bigger volumes.
If the price breaks below each price level (green dots or solid lines), the support prices will turn to resistance, putting downward pressure on the stock.

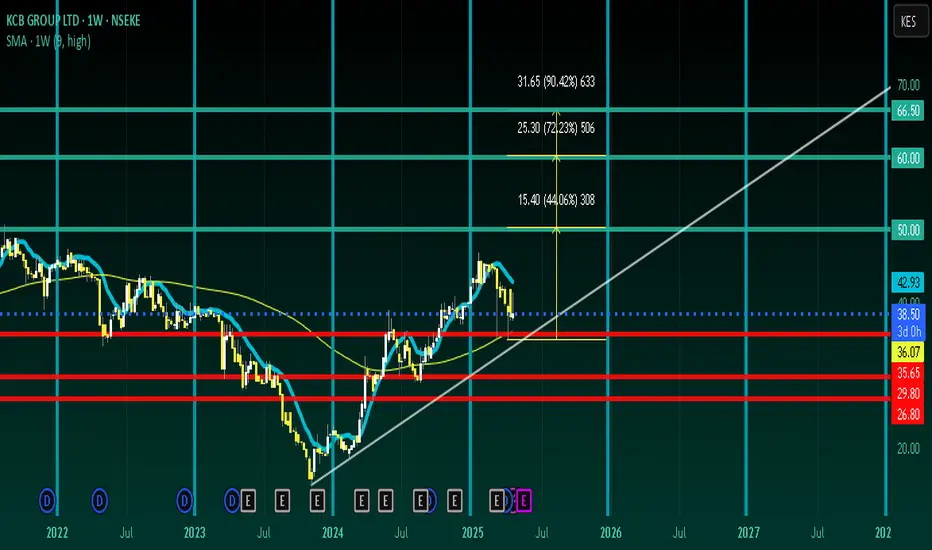
KCB LONGS : OUTSIDE NEW YORK SERIES EP2Inside nairobi
we looking for alternatives as trumpville puts the hurts n the fed aint coming to save
so he claims so we tryna see if its gonna be a global domino or if there will be an unexpected reaction pushing emerging economies
banking always know where the money be so im betting on them betting on the right moves
plus they been making waves when i was researching them
this bank will be mine someday

KPLC Chart obeying Elliott WaveAll of the market obeys Elliott principles by design. At the core of the market is psychology(human nature and logic) and numbers. Psychology is catered for by Elliott Wave and the numbers are catered for by Fibonacci Sequencing. On this chart, you can see Elliott principles being respected. This to me is more than just a theory and should be studied in-depth. I post daily charts on X and you could share your thoughts, queries and ideas @victorkmacharia.
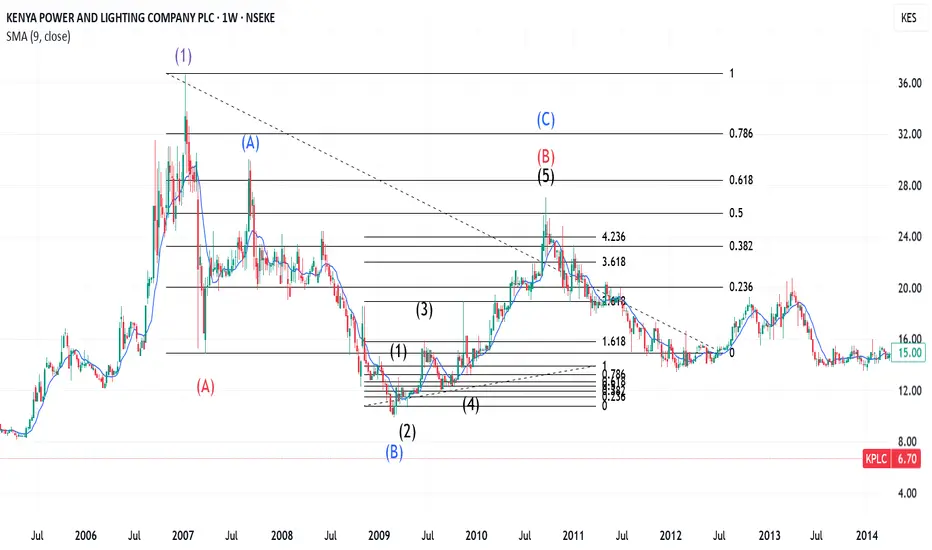
ELLIOTT WAVE(BANKS)In the image, a clear 5 Wave move can be seen, obeying both the Elliott Wave Principle and Fibonacci Sequence. Elliott Wave represents the Psychological aspect of the market as it is itself A Law of Nature while Fibonacci Sequence is the Mathematical Aspect. Since the Market deals in numbers, we need a little Math. Makes sense right?

EQUITY gROUP HOLDINGThe stock has been posting good returns, post covid markets have been working well for this institution.
it makes sense that it is expected to make positive returns on March 24th regards
its an early indication that the price is try to push past the resistance line
but i'm expecting it to hit a wall at the rectangle region so it a slight increase in value if you wanna gamble at this region
the positive regression of the banks environment with SME's places it ina position to rise pat its limitation.
long term strategy is to hold this stock for long run, atleast to run through the expected earnings through out the year, in relation to Dividends pay out that is seemlingly going to happen around November.
recommendation HOLD it for the entire year

inflection point?EABL has been in a decade-long downtrend. however, we appear to on the cusp of a change in trend.
the next few days will prove pivotal. in the event of a breakout, we forecast a 20% upside to the 180-190 KES region - resistance level. we are of the view that the sky is the limit, though we expect sizable pullbacks at various key resistance areas.
this will take some time to play out.

CIC INSURANCEWe are keeping it simple. Technicals will always guide price action. Let us wait and see if resistance will be the new support.
We already bought the stock

the bigger the base, the higher in spacethe chart says it all. Carbacid is a phenomenal company with a leading market position in the East African region. this moat is reflected in the company's stable financial metrics.
Mr Patel, a prominent investor on the NSE has increased his stake from approx. 25% to 49.9% over the past decade. One would be hard-pressed to find a company with a much stronger balance sheet.
wrt technicals, we'd need a much cleaner breakout to trigger an entry.

Second Bite At The Cherry?the market may have gotten ahead of itself after the CMA gave CARB clearance to acquire BOC. we still remain bullish and maintain our price target.
we could get a second bite at the cherry as price nears the "golden zone" (50%-61.8%) of the fibonacci retracement.

KENYA RE-INSURANCEWhen a stock price has hit rock bottom but fundamentals are still healthy. This will be a patience game to realize good capital gains. The Order Book is showing BIG VOLUME bids.
Let the accumulation game begin.

Crown Paints ($CRWN) LONG #NSECrown Paints hit the 61.8 retracement level in the long term. Expect a bounce of this support level with a PT of Kes. 73
