Safaricom setting up for reversalHello,
Divergence clear on this stock signalling we might be close to the bottom. Divergence in stocks refers to a situation where the price of a particular stock or index moves in a different direction than an indicator or another related stock or index. It indicates a potential shift in market sentiment or investor behavior, creating a disparity between the expected and observed trends. Divergence can occur in various forms, such as price-oscillator divergence or intermarket divergence, and is often considered a signal of a possible reversal or correction in the stock's price trajectory. Traders and investors closely monitor divergence patterns as they can provide valuable insights into market dynamics and aid in making informed decisions.

Using price action & tradingview tools to trade betterHello,
Price action is a vital aspect of trading, and analyzing candlestick patterns is key to understanding market dynamics. The size of candles, representing the range between opening and closing prices, is crucial for traders. Large candles signal strong momentum and potential trends, while smaller candles suggest indecision or lack of clear direction. Traders use candle size to identify entry and exit points, manage risk, and gauge market sentiment. By examining the relationship between candle sizes and volume, traders can make informed decisions based on visual representations of price movements. In summary, candle size is a valuable tool in price action analysis, helping traders interpret market behavior for better decision-making.
A key tool you can use to measure the momentum of an asset is the Date & price range tool . This tool allows users to place points vertically on two different prices. A Text appears along the box displaying the total size of the price moving in terms of actual share price, percentage and time the move took. E.g the chart below shows the move took 3234 days and was +1024.43% in terms of increase.
Once you've got the hang of price action and figured out which way the trend is going, the next big thing is spotting patterns that tell you when to jump in. We focus on two things: motive moves, which show the trend, and corrections, which give us good entry points . Motive moves are like the big, important moves we want to trade, and corrections are where we can get in on the action. Recognizing these patterns helps us know when it's smart to join the market and increases our chances of making successful trades. a good example of these can be identified below
Once you've identified patterns, the next step is deciding when to get in. There are two main types: risk entries and risk-averse entries. Risk entries often align with motive moves, indicating a trader's willingness to take on more risk for potentially higher rewards. Below is a great way of looking at both of this
Risk taking entry
Risk averse entry
This is where the correction has already been broken and a trend determined. The Risk to reward ratio is lower and therefore less profit can be achieved here.
Next we shall be looking at how to look at the indicators to support your trading hypothesis and make better trades.
Good luck and all the best.

Is Kes 8 a possibility? Safaricom had the worst two years in its history but there are opportunities for a long-term investor. We did not have Safaricom in our portfolio because it was too expensive from our point of view. And the dividend growth was not attractive to us.
From a capital gains perspective, the stock has a lot of potential and we are anticipating that it will drop to Kes 13 in December/Jan/Feb due to fundamental factors. And maybe break lower into the accumulation zone.
We will wait and see how the stock plays out.


Jubilee insuranceWaiting to see if Jubilee Insurance will drop to Kes 120 in the coming months. It may sound far-fetched but we are anticipating the share price to continue dipping if the general market does not start recovering in the coming months.
The company has strong fundamentals but supply overwhelms demand as investors close their positions in fear of further realized losses.

EQUITY BANK IN A CHANNEL Looking at two entries at Kes 30 and Kes 25. At these price points, the RSI should give us a sign that a reversal is imminent. The first partial exit will be at Kes 40.
Let us wait and monitor the stock price.

Sasini in Bear teritotryIn the past 1 year, Sasini stock price has dipped 30%. This provides investors with a good opportunity to look into the stock at a significant discount. The stock has strong fundamentals and will be one of the biggest beneficiaries of a depreciating shilling.
The company has a healthy dividend yield of about 11%, low debt-to-equity ratio, and a p/e of 4.8%. In the past 5 years, their earnings have grown 49.4% over the past 5 years.
Despite the dip in their share price, Sasini will be added to our portfolio if it dips between kes 14.00 -14.50 if fundamentals hold and hopefully, this will align with a double bottom on the RSI. An exit strategy will be adjusted if our analysis holds.

EABL looking attractiveDouble bottom entry at kes 110.00. Let us wait and see. The current price is still discounted. Let us buy our first lot.

Bamburi Cement in the limelight Is this the moment for Bamburi to cement its foundation and scale??
nation.africa
Let us buy some Bamburi cement shares. If this transaction goes through, a bright future lays ahead for the company.

KCB bounceInvestors have seen significant paper loss holding KCB shares. The problem is that most Kenyan investors are herd investors. And the herd always gets slaughtered. In an analysis presented to a local investor early this year, this is part of the analysis presented and we had our first buy orders filled between Kes 15.00 and Kes 15.25.
The trade played out according to the analysis and in case this trade breaks lower, we have our orders in place. If not, KCB bank might have bottomed out if fundamentals don't trigger another sell-off.

NSE OBEYING TECHNICALSThe Nairobi Securities Exchange share price has been on a bearish trend but there is a bullish divergence on the RSI. The stock has provided multiple entry and exit opportunities that have proven to be quite profitable on a predictable trend. We are looking at another hodl entry at Kes 5.50, and sticking to our long-term target of Kes 8.00. However, there is strong support at around Kes 6.00.
The Green Arrows are our entry and the Red arrows are our exits. However, we only liquidate 75% of our holdings on exits and retain 25% as our long-term position.

AFRICAS ENERGY KINGKenGen, Kenya Electricity Generating Company PLC, plays a significant role in the global energy sector, particularly in promoting renewable energy sources and supporting sustainable development initiatives. Here are some key facts about KenGen's global impact:
1. Leading Geothermal Energy Producer: KenGen is among the world's top 10 geothermal energy producers, harnessing the power of Earth's heat to generate clean and sustainable electricity. With a geothermal capacity of over 799 MW, KenGen contributes significantly to reducing greenhouse gas emissions and promoting environmentally friendly energy solutions.
2. Pioneering Geothermal Development in Africa: KenGen has extensive expertise in geothermal exploration, drilling, and power plant development. The company actively shares its knowledge and expertise with other African countries, providing geothermal drilling consultancy services in Ethiopia and Djibouti, and conducting geoscientific feasibility studies for Rwanda, Comoros, and Malawi.
3. Enhancing Renewable Energy Access: KenGen actively collaborates with international partners to expand renewable energy access across the African continent. The company participates in initiatives such as the Africa Renewable Energy Initiative (AREI) and the Geothermal Risk Mitigation Facility (GRMF) to promote the adoption of renewable energy sources and reduce reliance on fossil fuels.
4. Contributing to Global Energy Transition: KenGen's commitment to renewable energy and sustainable development aligns with the global shift towards a low-carbon economy. The company's efforts to increase its renewable energy capacity and support the development of geothermal projects in Africa contribute to reducing the impact of climate change and promoting a cleaner energy future.
5. Sharing Expertise and Innovation: KenGen actively participates in international conferences and forums, sharing its expertise and experiences in geothermal energy development and renewable energy integration. The company also collaborates with research institutions and universities to promote innovation and technological advancements in the renewable energy sector.
6. KenGen has an installed generation capacity of 1,904 megawatts (MW) and supplies 66% of the East African country's power.
7. KenGen earnings per share rose to 0.76 shillings from 0.51 shillings and recommended a dividend payment of 0.30 shillings a share, from 0.20 shillings in the previous financial year.
8. KenGen share price is heavily undervalued and it is one of the stocks in our portfolio.
The Green Arrows show the days we accumulated KenGen shares.
In summary, KenGen plays a crucial role in the global energy sector by promoting renewable energy sources, supporting sustainable development initiatives, and sharing its expertise with other countries. The company's contributions are essential for a cleaner and more sustainable energy future.

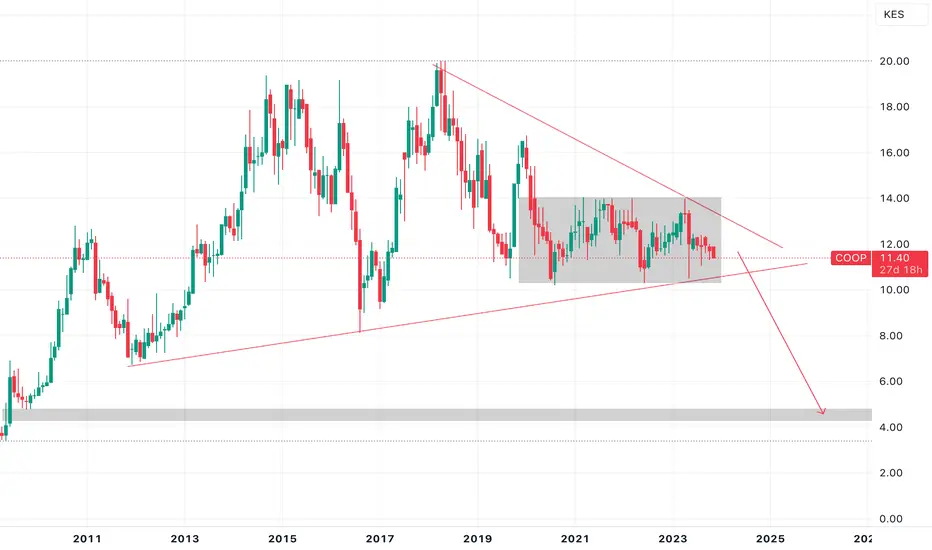
Co-operative Bank Kenya technicalsCo-operative bank has been a favourite for the past few years. Not only are the dividends lucrative, but the price action is more stable and predictable. Looking at accumulating the next cycle when prices hit Kes 10.50.
The green arrows show all my entry prices.

A simple way of looking at stocksHello,
A simple way of looking at companies is by looking at their charts. The chart tells you a story the balance sheet might never communicate. It gives a story of who between the sellers & buyers is in control. First, let us understand what the candlesticks are and how they can be used
Candlestick Charts:
Candlestick charts are widely used in technical analysis to represent price movements in financial markets. Each candlestick typically shows the open, high, low, and closing prices for a specific time period (such as a day, week, or month). The body of the candlestick represents the price range between the opening and closing prices, while the wicks (or shadows) indicate the high and low prices during the period.
Green (Bullish) : The close is higher than the open. It suggests buyers are in control.
Red (Bearish) : The close is lower than the open. It suggests sellers are in control.
As per our chart this two candles are very key in completing the whole story. From The chart you will notice that the red candles are more than the Green candle while also being bigger. This already tells us that the trend is a Downtrend .
Conclusion :
We can only buy the stocks when the buyers begin to come into the market and the Green candles begin getting bigger & More aggressive. That way we are able to take advantage of the prices at the bottom and manage our Risk to reward ratios. Please keep in mind that the Fundamentals of the company are very important to understand before buying
Good Luck!

EABL LONGEABL is a prime example of a company which formed a rally and caused an imbalance only for price to come and fill it later on. As a result, the excess demand for EABL price was balanced out and now price has caused an imbalance on the supply side. This is seen as price is forming a trendline to the downside, which is waiting for it to be broken so that demand can go fill out the excess supply and reach equilibrium before making a pullback to the other direction. Beneath the chart, there is a liquidity hunt for price to indicate that price was seeking final liquidity before it goes up. Usually, this would be your ideal stop loss level if you are looking to go long.


EQTY SHORTEquity is showing the same direction bias as KCB. tHe only difference is it is bouncing along the trendline, waiting for the break of trend to initiate the sell off. Most times this could be couple with a series of fundamentals which fuels the sell off. My guess is during the next earnings report, it will miss the earnings. This comes after a recent interview by the company CEO who highlighted the dire economic situation and how the disposable income is shrinking among his customers. This could spark a sell off which might take equity down the spiral.

KCB SHORTKCB has had a very impressive run over the years. But fundamentals state that demand must meet supply at equilibrium. After its long rally, price is finally starting to ‘balance out’ in the chart as we saw price break out of the triangular wedge and did a huge sell off to the downside as it tries to reach equilibrium (green zone). As price comes down, it will also take out the consolidation zone highlighted in red.
This won’t be a quick process. I anticipate this to go on for the subsequent months. It could go for as low as 5Ksh if the sell off persists. This is also catalyses by the prevailing market conditions which isn’t favoring any buys for now, the market sentiment has shifter to a bear market as it is already evident in the chart.
Considering the company has a solid asset base and financial muscle to manage its operations, coupled with its expansion outside Kenya, it still has a chance to regain its lost glory but first, we need to consider the matter in hand, which is market balancing out before we think about buying and holding in the long term.

How to begin investing in KenyaHello,
Owning shares in the Kenyan stock market can be an exciting and potentially lucrative investment opportunity. The following steps outline the process of owning shares in the Kenyan stock market:
Open a CDS Account:
The first step is to open a Central Depository System (CDS) account. If you are in Kenya, most banks offer CDS account services. If you are located outside Kenya, you can find a list of authorized brokers on the Nairobi Securities Exchange (NSE) website at www.nse.co.ke (www.nse.co.ke). These brokers can help you open a CDS account remotely.
Deposit Funds:
Once you have opened a CDS account, you need to deposit funds into it. The minimum number of shares you can purchase in the Kenyan stock market is 100. Therefore, you need to deposit an amount that allows you to buy at least 100 shares. You can transfer funds from your bank account to your CDS account through the banking channels provided by your broker or bank.
Purchase Shares:
With funds in your CDS account, you are ready to buy shares. To purchase shares, you need to work with a stockbroker. If you opened a CDS account through your bank, they may provide stockbroker services. Otherwise, you can reach out to the list of authorized brokers provided on the NSE website. Contact the broker of your choice and inform them about your intention to buy shares. They will guide you through the process, including selecting the stocks you wish to purchase, determining the quantity, and placing the order on your behalf.
Seek Assistance:
Investing in the stock market can be complex, especially for beginners. If you encounter any difficulties or have questions during the process, it is important to seek assistance. Your stockbroker is there to help you and provide guidance. Don't hesitate to reach out to them if you are stuck or need clarification on any aspect of the stock market investment process. They can explain market dynamics, assist with trade execution, and provide advice based on their expertise.
Monitor and Manage Your Portfolio:
After you have successfully purchased shares, it is important to regularly monitor and manage your portfolio. Keep an eye on the performance of the stocks you own, as well as overall market trends. Stay informed about company news, economic indicators, and any other relevant information that may affect your investment. Consider diversifying your portfolio to reduce risk by investing in different sectors or asset classes. Review your investment strategy periodically and make adjustments as needed.
Feel free to reach out to me should you get stuck on the way.

SAFARICOM ANALYSISThe Kenyan based company has fallen from grace in just 22 Months, wiping out almost 80% of its 10 year bull run. The market is approaching previous support, where it reversed before. The giant Telco enjoys monopoly in the country, with a huge customer base, mainly attributed to its money transfer service, MPESA. Recently, the company launched operations in Ethiopia. More downside for Safaricom may be limited for now, and what we are most likely to see is a extended period of consolidation as the market absorbs the recent selling pressure before we see the next bull run.

Unlock the Secrets of Doji, Hammer and Dragonfly DojiHello,
Candlesticks have been there longer than most of us can imagine. They are a unique way of looking at things because they normally have four price points. Candlestick patterns are formed by the combination of one or more candlesticks, which are graphical representations of the price action of a financial asset during a particular time period.
Doji, hammer, and dragonfly doji are three common candlestick patterns that traders use to identify potential trend reversals or continuation.
A doji is a candlestick pattern that forms when the opening and closing prices of an asset are nearly identical. This results in a candlestick with a very small body and long wicks on both ends. A doji indicates indecision in the market and suggests that buyers and sellers are evenly matched, which can lead to a potential reversal in trend.
A hammer is a bullish reversal pattern that forms at the bottom of a downtrend. It consists of a small body with a long lower wick and little to no upper wick. A hammer indicates that sellers have pushed the price down but buyers have stepped in and pushed the price back up, suggesting a potential reversal in trend.
A dragonfly doji is a candlestick pattern that forms when the opening and closing prices are at or near the high of the day, with a long lower wick and no upper wick. It resembles a hanging man pattern but is considered bullish rather than bearish. A dragonfly doji indicates that sellers have pushed the price down but buyers have stepped in and pushed it back up, suggesting a potential reversal in trend.
When looking at the doji, hammer, and dragonfly doji candlesticks, traders often analyze the price action surrounding these patterns. For example, if a doji forms after a strong uptrend, it may indicate that the buyers are losing momentum and a reversal could be imminent. Conversely, a hammer or dragonfly doji forming at the bottom of a downtrend may suggest that buyers are stepping in and a trend reversal could be on the horizon. Traders use these patterns in combination with other technical indicators to gain insight into the market and make informed trading decisions.
These key candles will be very key in determining the direction of our next move on any asset class analysis.

KENYA POWER AND LIGHTING COMPANYNairobi security exchange
KENYA POWER AND LIGHTING COMPANY
NEWS Kenya Power to Convert Its 2,000 Vehicles to Electric Over 4 Years
Stock looks in demande
stop loss 1.18
How much is HKEX:1 US in Kenya?
133.935384 KES
A high-risk investment is therefore one where the chances of underperformance, or of some or all of the investment being lost, are higher than average. These investment opportunities often offer investors the potential for larger returns in exchange for accepting the associated level of risk.
