Bullish Divergence on Daily as well as Weekly TF.Bullish Divergence on Daily as well as
Weekly TF.
Currently at Channel Bottom with
Immediate Resistance around 119.
However, it should not break 108
& 103 in worst case.

Bullish Divergence on Daily TF.Bullish Divergence on Daily TF.
Immediate Support is around 23.70;
however, sustaining 23.70 is Important.
Next Very Important Support is around 18 - 19.
On the flip side, 26 is the Immediate Resistance
then comes 27.50

SABIC FOR NOVMBER 2024 (TASI)Hello everyone,
A look at SABIC in the Saudi market (TASI)
It is possible for SABIC's stock to rise despite the TASI index being negative this month.

Bullish...As mentioned on 13-10-2024, Crossing 102.50 lead
it towards 112.
Now Sustaining 112 may lead it towards 125 - 127
However, it should not break 104 on Closing basis.

Saudi electricity Sparks Bullish Momentum 📈 Saudi Electricity Sparks a Bullish Momentum! ⚡🚀🔞
Weekly Analysis
The Saudi Electricity stock has initiated a strong bullish momentum, creating a Fair Value Gap (FVG) on the weekly timeframe, along with a significant Market Structure Shift (MSS).
H4 Insight 🔍
Zooming into the H4 timeframe, the price is currently positioned just above the Breaker Block, even slightly touching it. This presents a promising scenario for a bullish continuation.
Bullish Outlook 🎯
I'm expecting a bullish run from here, targeting Buy Side Liquidity and the Equal Highs at 18.88. This move aligns with the structural and liquidity dynamics seen in the market.
What’s Next? 🚀
If the price respects the Breaker Block and maintains its bullish drive, this could lead to a significant rally toward the target, rewarding those aligned with the trend.
⚠️ Always trade responsibly and manage risk effectively.

ARAMCO to the moonto the moon Aramco from 24 riyal to 52 riyal
to the moon Aramco from 24 riyal to 52 riyal
to the moon Aramco from 24 riyal to 52 riyal
to the moon Aramco from 24 riyal to 52 riyal
to the moon Aramco from 24 riyal to 52 riyal
to the moon Aramco from 24 riyal to 52 riyal
to the moon Aramco from 24 riyal to 52 riyal

DON'T BUY 1150You can notice on the chart that the market been pushing downwards since the beginning of the year, in the chat groups people are saying that you can buy... But the chart is saying the opposite of what you see in the groups.
You can notice that it just broke a level that gave it a push towards the Price Gap we have at 25.85-25.50 to fill it then we'll see how the next move will be.
Please if you already have shares on 1150 sell them, and if you're welling to buy don't do it and check on the posts I have on my account for the stocks you can buy!
Follow for more!

BUY 2040Saw on a group people wondering if it's still time to buy on 2040 and I wanted to share with you this entry you still can take.
Wait for the market to come back to Fill the Gap and Grab the Liquidity at the same time so you can have a clean entry.
Entry at 33.60, Target at 37.20 and Stop at 31.80.
Follow for more!

BUY 7010You can BUY on 7010 at 39.35 in a level where the market is done with filling the Gaps we have in the movement and done with grabbing the Liquidities we have on the past movement.
You can BUY with the target at 44.10 and the stop at 37.85.
Follow for more!

2222 WILL MAKE A CORRECTION BEFORE GOING HIGHEROn 2222 as you can see on the chart, the market just filled the price gap we have in the levels 27.95-28.10 and now it will come lower for a liquidity grab. If you're welling to buy now please don't so you don't lose your money in the correction movement.
Follow for more!

NOT A GOOD TIME TO BUY 1120Dear Saudi Traders, been a while since I last posted on Saudi markets.
As usual I'll be posting on the stocks most of you are buying, on 1120 as you can see, the market reversed after pulling back on the 93.6 level, now it is heading towards the 86.8 level to grab the Liquidity and fill the gap to go higher.
For now don't buy on 1120!
Follow for more!

Bullish..Beautifully making HH HL on Weekly TF.
9.50 seems to be an important support
on weekly basis.
Entry can be taken with a Stoploss of 7.50
on Closing basis.

Favoring BullsBullish Points:
Bullish Divergence on Weekly TF.
Inverted H&S Pattern.
Slightly Bullish on Daily TF.
No Bearish Divergence.

Making HH HL on Weekly TF
Bullish on all Time Frames
However, Slight Bearish Divergence on
Weekly TF is also observed

$1213 - Naseej International Trading // CUP & HANDLE $1213 - Naseej International Trading
Seems to have a good Cup & Handle Formation
Good Luck !

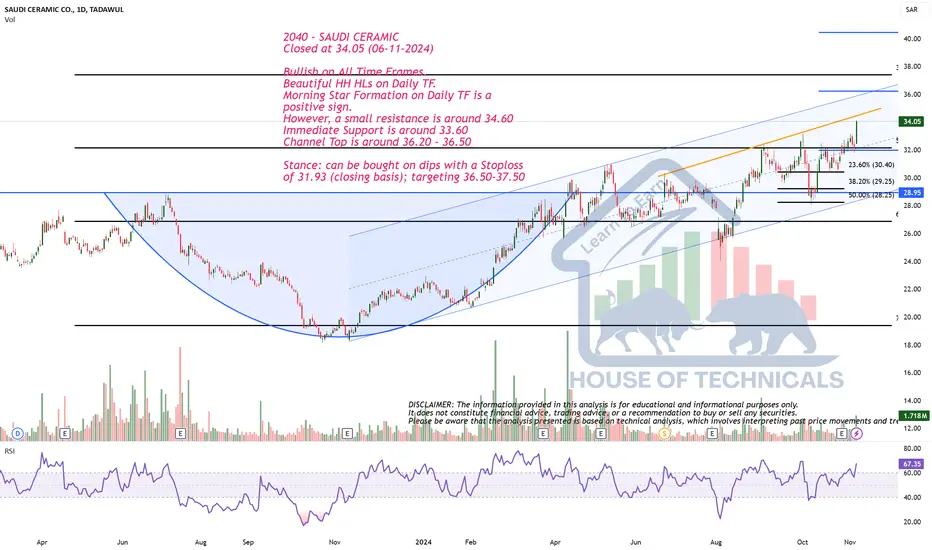
Bullish on All Time Frames.
Bullish on All Time Frames.
Beautiful HH HLs on Daily TF.
Morning Star Formation on Daily TF is a
positive sign.
However, a small resistance is around 34.60
Immediate Support is around 33.60
Channel Top is around 36.20 - 36.50
Stance: can be bought on dips with a Stoploss
of 31.93 (closing basis); targeting 36.50-37.50
4017-BullishThe company recently posted Good result, Already price in Good buying range after small breakout from the range.
Buy Range :- 59-61
With SL -55 DCB
1St Tgt :- 65.9
2nd Tgt-:66.7
3rd Tgt After Breakout:-79.2
Disclaimer:
The information posted on Trading View is for informative purposes and is not intended to constitute advice in any form, including but not limited to investment, accounting, tax, legal or regulatory advice. The information therefore has no regard to the specific investment objectives, financial situation or particular needs of any specific recipient. Opinions expressed are our current opinions as of the date appearing on Trading View only. All illustrations, forecasts or hypothetical data are for illustrative purposes only. The Society of Technical Analysts Ltd does not make representation that the information provided is appropriate for use in all jurisdictions or by all Investors or other potential Investors. Parties are therefore responsible for compliance with applicable local laws and regulations. The Society of Technical Analysts will not be held liable for any loss or damage resulting directly or indirectly from the use of any information on this site.

Double BottomDouble Bottom around 168 -168.50; a bounce
is expected.
Tomorrow's Closing is Important.
Sustaining 168 , may lead it towards 190 - 193.
On the flip side, if 168 is broken, we may
witness further downside; but it should touch
180 - 181 once before going down.
However, for a Trend Reversal, it is important
to cross 201 - 202.

SAUDI ARAMCO : sell or take your profits but do not buy nowWe will see an important correction on Saudi Aramco TADAWUL:2222 very soon .
Sell or consider taking some of your profits or most of them to buy at cheaper price .
We will very likely drop to around 22 on this stock very soon .

Still Bullish....?Bullish on Bigger TF.
However, there is a Bearish Divergence
on Weekly TF.
43 is an important Support level; if it is sustained,
we may witness 45 - 46.
Stoploss in this case should be around 40.

4072an upward trend in the prices of an industry's stocks or the overall rise in broad market indices, characterized by high investor confidence

4007an upward trend in the prices of an industry's stocks or the overall rise in broad market indices, characterized by high investor confidence

4071above 214 heading to 240 above 214 heading to 240 above 214 heading to 240 above 214 heading to 240 above 214 heading to 240 above 214 heading to 240 above 214 heading to 240
