BANQUE SAUDI FRANSI 1050 - Bullish Signs
1- Bounce from demand level at 33.5
2- Break VWAP
3- Bullish candles
Price Target
TP1: red box (GAP)
TP2: red line Monthly Open (37.25)

AYYAN Investment - TADAWUL: 2140 - KSAThe stock is currently trading near the resistance level of SAR 17.40. If this level is breached, the stock is expected to target prices of SAR 18.50, followed by SAR 21. The stock has become suitable for trading after recent transactions in the last financial period, due to the anticipated financial adjustments that will be reflected in the company's upcoming Q3 financial statements.


* Morning Star Formation on Daily TF.
* Bullish Divergence on Hourly TF.
* Huge Volume witnessed in Last Trading Day.
* Can be a Good Buy with a Stoploss below
29.20 on Closing Basis.

Play wiselyImmediate Support seems to be around 284 - 286.
Important Resistance seems to be around 297 - 299.
Breaking 275 would make it Bearish.

2110Saudi Cable's current trading position below the 200-day Exponential Moving Average (EMA) suggests a bearish trend. A potential shift to a bullish outlook could occur upon maintaining levels above the 200-day EMA. There are indications of an Adam & Eve formation forming in its price action, with the neckline of this pattern situated around 81. Price action has shown rejection from this level after forming the Adam, with a potential formation of the Eve anticipated. Completion of the Eve could lead to a bullish sentiment following a breakout.
A support zone is identified approximately between 56-57, from which a rebound is anticipated. Two plausible scenarios could invalidate this analysis: firstly, if the price fails to decline further and breaks out above 81, maintaining levels above, thereby shifting sentiment from bearish to bullish. Secondly, if the price drops below the support level of 56, a more bearish price movement could be expected.
It's important to note that these observations are speculative and not financial advice. It's recommended to conduct thorough research before making any trading decisions, whether long or short positions.

4163 • TADAWUL - Al-Dawaa Medical ServicesThe stock presents an investment opportunity. The optimal buying zones are around the 90-88 level, targeting the areas mentioned on the chart. Growth opportunities in the sector across various regions in the Kingdom remain promising.

Bullish on All Time Frames.
74.50 was a Very Important Resistance
that it has Crossed; & it may act as Support Now.
Now that if this level is Sustained on Monthly
Basis, we may witness 89 & then 93.

4011an upward trend in the prices of an industry's stocks or the overall rise in broad market indices, characterized by high investor confidence

2180an upward trend in the prices of an industry's stocks or the overall rise in broad market indices, characterized by high investor confidence

2050an upward trend in the prices of an industry's stocks or the overall rise in broad market indices, characterized by high investor confidence

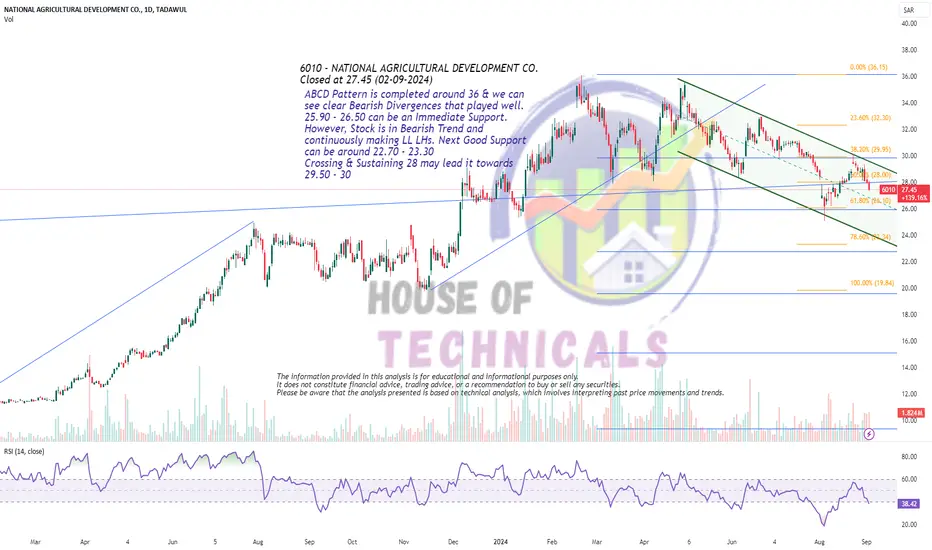
ABCD Pattern is completed around 36ABCD Pattern is completed around 36 & we can
see clear Bearish Divergences that played well.
25.90 - 26.50 can be an Immediate Support.
However, Stock is in Bearish Trend and
continuously making LL LHs. Next Good Support
can be around 22.70 - 23.30
Crossing & Sustaining 28 may lead it towards
29.50 - 30
Saudi Marketing Company (Frm Suprs) - 4006"The stock has formed a positive double-bottom pattern and is moving towards its target. Additionally, we see the potential to reach the peak in the medium term, making the current levels a buying opportunity to move towards the indicated targets on the chart."

Last Month's Candle: DojiLast Month's Candle: Doji
Cup & Handle Formation Expected.
Important Resistance: around 50
Important Zone: around 35 - 36

United Electronics - 4003"The stock is considered an investment and is trading within an ascending price channel. Upon breaking the 94 SAR level, it targets 105 SAR, then 120 SAR. The fair value of the stock is estimated at around 120 SAR, with growth opportunities through the IPO of Tasheel Company."

Saudi Steel Pipes - 1320The stock is in an accumulation phase. Upon breaking through the 70 level, the stock is expected to target the 75 area, followed by 86.

2281: Watchout for SupportPrice is moving within Ascending Parallel Channel after breakout
Last corrective movement is after double top formation
Price is at POC (Volume Profile) which is another support level
if it breaks, price may fall to channel bottom
Watchout for entry after confirmation

1322 TASIBullish on weekly TF
Moving in a bullish channel and taking the support of channel
Trading above the moving averages
Volumes are also pertty goods support the price

Bullish on Daily as well as Weekly TF
65.60 - 66 is an Important Resistance Level.
If this level is Crossed & sustained, we may
witness 68.
On the flip side, 63.50 is an Important Support
level that should be sustained on Monthly Basis.

LongSustaining 60.70 will lead it
towards 64 & then 66 initially.
Positive momentum is about to build.

3004an upward trend in the prices of an industry's stocks or the overall rise in broad market indices, characterized by high investor confidence

4015: Breakout and Retest Parallel ChannelPrice moving in uptrend; HH, HL formation
Parallel Channel breakout and retest is observed
Watchout for double top formation
beating ATH will take the price to Bullish Flag Target.
