4002: Support from Channel BottomPrice is moving within an ascending parallel channel on weekly TF.
Bottom Support line was retested recently.
Formation of HL is in progress.
(Aggressive) entry can be taken now or
(conservative) entry can be taken after formation of green candle
Ride the trend until channel top.
Manage your risk accordingly.

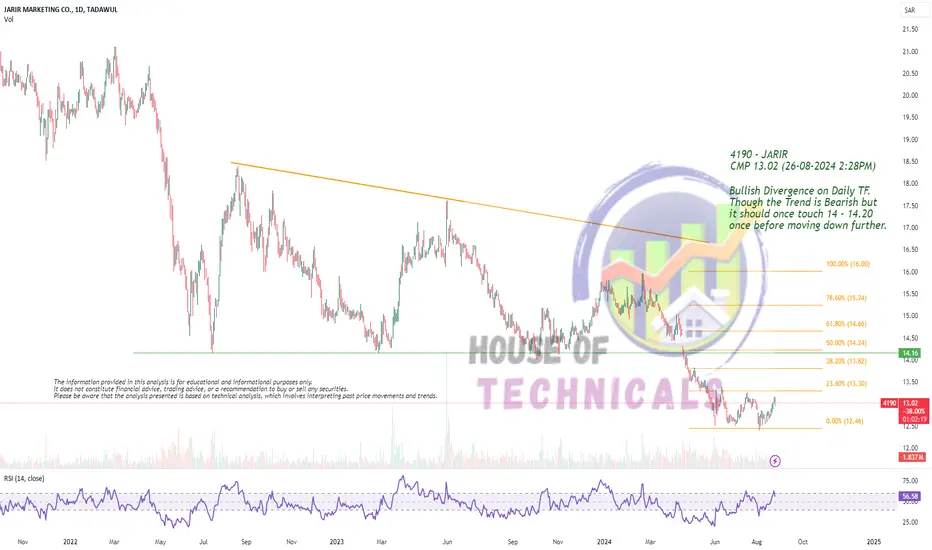
Bullish Divergence on Daily TF.Bullish Divergence on Daily TF.
Though the Trend is Bearish but
it should once touch 14 - 14.20
once before moving down further.
3091an upward trend in the prices of an industry's stocks or the overall rise in broad market indices, characterized by high investor confidence

5110an upward trend in the prices of an industry's stocks or the overall rise in broad market indices, characterized by high investor confidence

8240an upward trend in the prices of an industry's stocks or the overall rise in broad market indices, characterized by high investor confidence

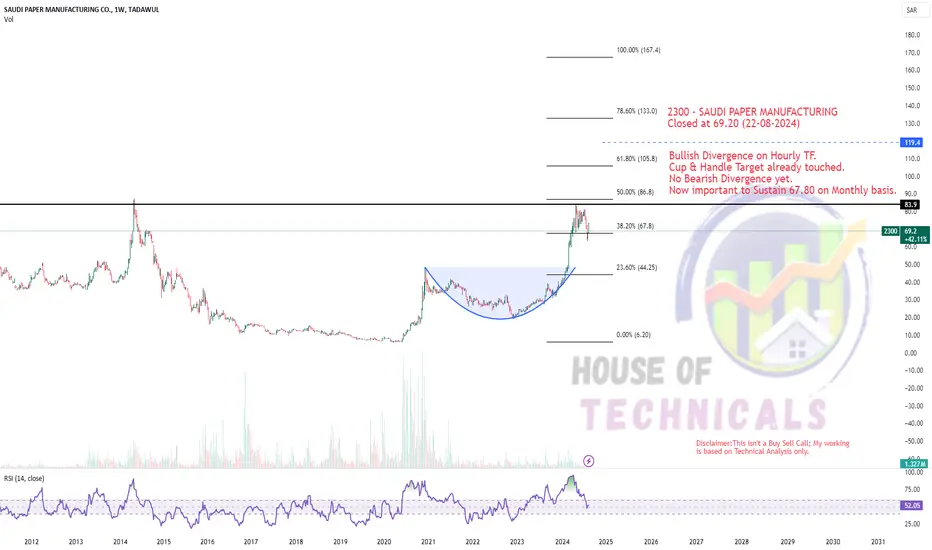
2300an upward trend in the prices of an industry's stocks or the overall rise in broad market indices, characterized by high investor confidence

Bullish Divergence on Hourly TF.
Cup & Handle Target already touched.
No Bearish Divergence yet.
Now important to Sustain 67.80 on Monthly basis.
4070an upward trend in the prices of an industry's stocks or the overall rise in broad market indices, characterized by high investor confidence

4009an upward trend in the prices of an industry's stocks or the overall rise in broad market indices, characterized by high investor confidence

I hope im wrong.I know this is a good company in sheets. But I don’t know, i hope im wrong.
If the idea works means not just a price going down it’s mean there is something wrong in there sheets. I didn’t go deeply in there sheet but they have good reputation.
+ the chart hv deep targets not only what i put in here, but i will keep them later.
This just a TA not Financial advice.
Hv good day.

Breakout on Daily TF.
Bullish Divergence on Monthly TF.
Immediate Resistance is around 18.70.
However, can wait for Closing above 18.

1111: Great Upside Potential After Correction1111 after correction has reached 61.8% fib level (Golden Pocket)
A horizontal support level is also acting as trend reversal
Formation of HH, HL are observed.
Ride the trend with trailing SL.
Manage your risk accordingly.

2281: Watchout_Double Top Formation2281 is moving nicely in an ascending parallel channel taking support from a long-term trendline support continuously.
Price has shown breakout from parallel channel and has formed double top at a critical resistance of 140.
Bulls need to break the resistance of 140 to continue the bullish trend or wait for correction.

7204: Breakout and Retest7204 was in correction for a while within descending parallel channel.
Breakout followed by retest is observed on parallel channel.
Price has started showing HH, HL formations after
taking support from horizontal line
which is also golden pocket fib level.
A Bullish divergence is also formed.
Take entry now (with aggressive or conservative SL) and ride the trend.
Do proper risk management based on your portfolio and appetite.

DON'T BUY 2222Dear Saudi Traders,
Since Tomorrow is the day most of you are going to analyze their charts and place their ordres, I'm sharing with you the markets you can't buy for this week.
The 2nd one on the list is 2222, you can see on the chart that the market has just pulled back on the strongest candle we have which plays the role of a strong level on the market.
Plus, you pay attention for the volume which is still low to ride a Bullish move on the market.
We'd be expecting the market to come lower to reach the level 26.80 before heading up again.
Follow for more!

DON'T BUY 1120Dear Saudi Traders,
Since Tomorrow is the day most of you are going to analyze their charts and place their ordres, I'm sharing with you the markets you can't buy for this week.
The first one is 1120, you can notice on the chart how the volume is giving us an indication not to buy, as the chart does when the market pulled back on the resistance level to head down to 78.7 level.
Hold your funds for now.
Follow for more!

Morning Star Formation on Weekly TF.
Weekly Closing above 23.6% Fib. Level.
However, Bearish Divergence is there on
Weekly TF. Sustaining 62 is Important for now.
Immediate Resistance is around 66 - 67.
Risk can be taken with a Stoploss of 59
on Closing basis.

2222an upward trend in the prices of an industry's stocks or the overall rise in broad market indices, characterized by high investor confidence

6040an upward trend in the prices of an industry's stocks or the overall rise in broad market indices, characterized by high investor confidence

SAUDI TELECOME The weekly chart of Saudi Telecom shows move up. After break out golden point, will be continuing move up to hit the target.

Saudi Aramco 2222 going to 25.5 at leastSaudi Aramco is having a cup and handle and going to 25.5 at least as shown in the chart.
Something to mention, is that it could still increase to the baseline. But surely technically to the ~ 25.6

4015: Neckline BreakoutPrice is moving in Cup formation (continuous formation of HH, HL)
A significant Neckline (Resistance) is broken.
Wait for retest for a conservative entry.
Trade as per risk.

Tanmiah (2281): Trendline SupportTanmiah is again at the trendline support confluence with horizontal support line.
Entry levels with SL are specified with TPs.
Manage your risk accordingly.
