SAUDI ARAMCO BASE OIL CO. WEEKLY ANALYSIS After taken liquidity sell side and rejection of fvg we will see an expansian to fill gap

8010: TAWUNIYA LONG8010: TAWUNIYA
has formed a cup and handle formation and a successful breakout of the pattern occurred recently. Long position can be taken with still room for 10-12% profit. Set SL below the breakout of handle
Good luck!!

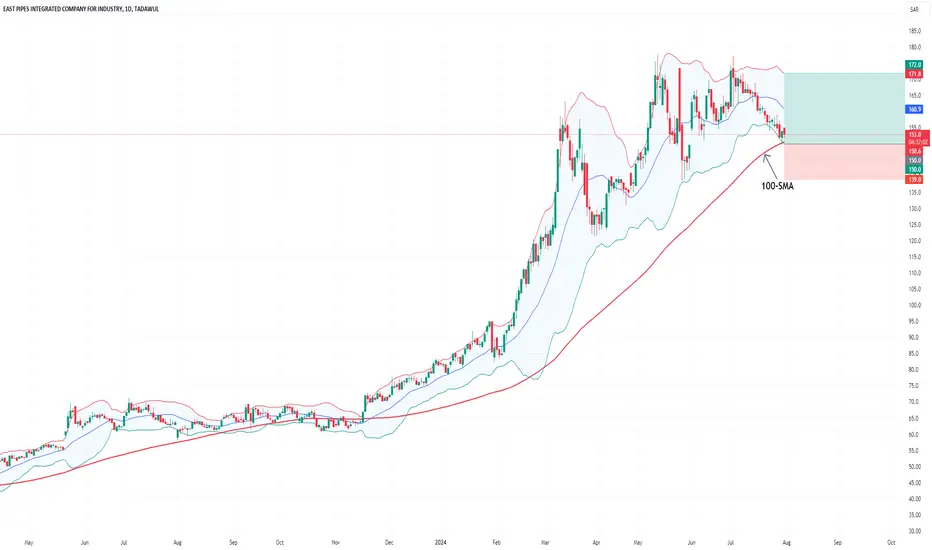
1321EAST PIPES closed at 154, staying above its 100-day SMA despite recent volatility. The RSI is at 39.65, indicating potential for a short-term increase. The stock is hovering above 200-day SMA. In the near term, the stock appears to target 160, with medium-term targets between 167 and 172. It is recommended to consider buying on weakness or as it approaches the support level, with stop losses set at 139 to manage risk effectively. Risk & Reward Ratio is 1:2
Bullish Divergence appearing on Weekly TF.
Important to Sustain 16 on Weekly basis.
Though, inverted Cup & Handle formation is
targeting way below.
But confluence of Trendlines may act as a
Good Support level around 16.30 - 16.60
It may touch 17.50 - 17.80 once atleast.

7204: AB=CD, POC, Golden Pocket7204, is in Bullish trend:
AB=CD, POC, Golden Pocket
Enter trade with specified SL
Manage your Risk
Trail SL

4004: Dallah_Weekly Support (Rising Wedge)4004 is moving within Rising Wedge pattern
Price is touching bottom support (Weekly chart)
Descending Parallel channel breakout is observed
Entry now with SL
Trail SL
Manage your risk

7203: Strong SupportELM has been in correction for a while.
Bullish trend has started in recent past (Parallel Channel breakout).
Price is in consolidation at a strong support level.
Entry can be taken now with
Conservative SL or Aggressive SL
Manage your risk and trail SL

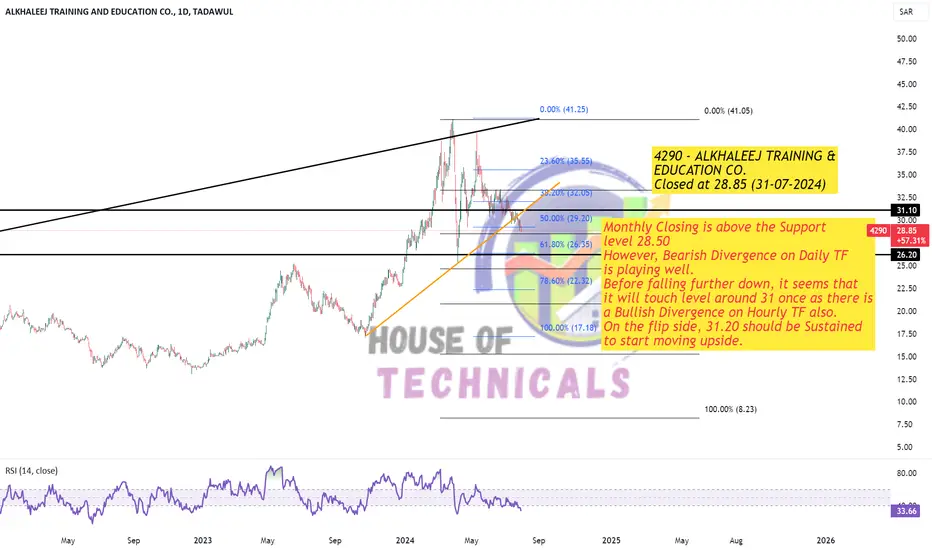
Monthly Closing is above the Support level 28.50
However, Bearish Divergence on Daily TF
is playing well.
Before falling further down, it seems that
it will touch level around 31 once as there is
a Bullish Divergence on Hourly TF also.
On the flip side, 31.20 should be Sustained
to start moving upside.

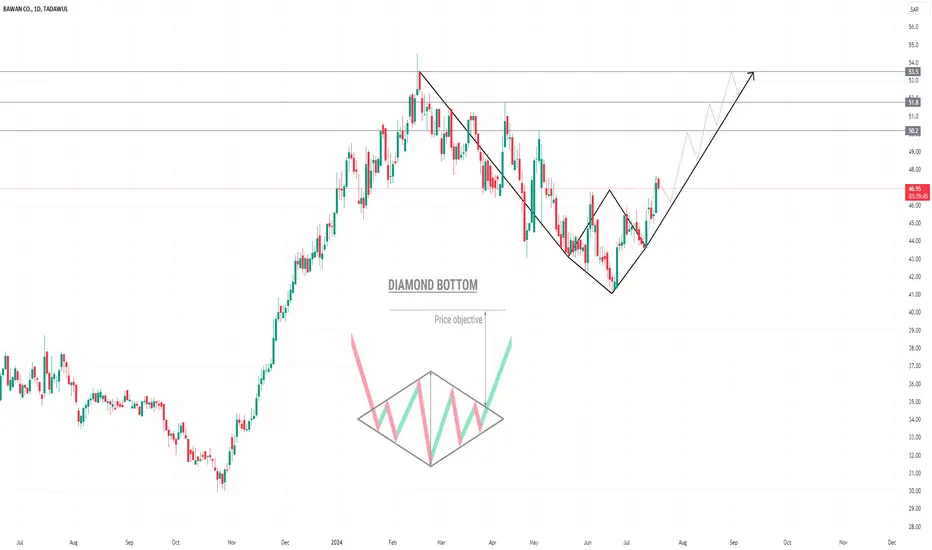
1302 | Diamond PatternThe technical chart of 1302 Bawan Company reveals a diamond pattern formation, which has recently experienced a breakout. The diamond pattern is characterized by a consolidation phase where prices initially form a narrowing range, followed by a breakout in either direction. In this case, the breakout has occurred, signaling a potential continuation of the previous trend or a reversal depending on the prevailing market conditions.
Currently, the trend is bullish following the breakout from the diamond pattern. Key resistance levels to monitor on the upside include 50.20, 51.80, and 53.50. These levels may act as barriers to further upward movement. For risk management purposes, a prudent approach would be to place a stop loss below 45, aligning with recent price support and the lower boundary of the diamond pattern.
Traders and investors may view the breakout from the diamond pattern as a bullish signal, suggesting potential further gains if the price continues to move above resistance levels. As always, monitoring price action and adjusting strategies in response to market dynamics are advisable.
Near Immediate Resistance?Immediate Resistance lies around 51.90 - 52
However, there is a Bullish Divergence on Hourly TF.
50 - 50.30 may act as a Good Support.
Next Support is around 49

Saudi Manpower BullishGood afternoon, investors! Today, we’re diving into the technical analysis of Saudi manpower , a stock that has shown promising signs of bullish momentum. We have identified key level on the carts with Strick stop loss. based on the key technical indicators and chart patterns that support our positive outlook.
DYOR # Do your own research

Two Important Support levels Important point is that it has broken
the Previous HL thus giving a Signal of Trend
Reversal on Daily Basis.
However, Two Important Support levels
Support1 around 222 - 223
Support2 around 211 - 213
targeting around 230 - 235 initially.
On the flip side, if 235 is Sustained on Weekly basis,
it may continue its Uptrend with Initial Resistance
around 258 - 260

SAUDI ARAMCO BASE OIL CO. WEEKLY ANALYSIS
After rejection price of volume imbalance two time we will see an expansion to taken previous sell side and fill previous FVG


DON'T BUY 4003As you can notice on the chart we have a high volume bearish move, which means the market will break the current level and reach the next one where we can see how the xstock will act.
The comment section is all yours for further questions!

DON'T BUY 2222I got lots of questions from people who have bought 222 and they're in losses now about if the stock will riase or no.
My answer is always NO, the price is falling down and it will keep falling to the LEVEL 26.60 where we can see what will be the next move of the price.


**Bank Saudi Fransi (BSF) 1050 - Market Update and Analysis****Bank Saudi Fransi (BSF) - Market Update and Analysis**
**Overview:**
Bank Saudi Fransi (BSF) has recently undergone a significant shift in market dynamics, capturing the attention of traders and investors alike. The bank has executed a strategic move involving sell-side liquidity grab, a change in status delivery, and the formation of a Fair Value Gap (FVG), signaling a potential buying opportunity. Here's an in-depth review of these developments and their implications.
**Sell-Side Liquidity Grab:**
In a bold move, BSF targeted sell-side liquidity, which refers to the capturing of liquidity resting below support levels where stop-loss orders are typically placed. This maneuver is often used by institutional players to trigger these stops, creating a temporary dip in prices before reversing. This liquidity grab can be seen as a strategic step to shake out weak hands and gather momentum for a more substantial move upwards.
**Change in Status Delivery:**
BSF's change in status delivery marks a pivotal point in its market behavior. This shift can indicate a transformation in the bank's trading stance or strategy, reflecting a broader market sentiment or internal revaluation. Such changes often precede significant price movements and can be an early signal for astute traders to anticipate and align their positions accordingly.
**Formation of Fair Value Gap (FVG):**
The creation of a Fair Value Gap (FVG) is particularly noteworthy. An FVG occurs when there is a price inefficiency in the market, typically seen as a gap between the closing price of one candlestick and the opening price of the next. This gap signifies an imbalance between buyers and sellers, often leading to a price correction to fill the gap. In BSF's case, the FVG indicates a potential buying zone, suggesting that prices may rise to fill the gap left by the liquidity grab.
**Buy-Side Liquidity Target:**
Following the liquidity grab and the formation of the FVG, BSF is poised to attract buy-side liquidity. Buy-side liquidity refers to the areas above current prices where buy orders are clustered, such as previous resistance levels or key psychological price points. The strategic targeting of these areas suggests a bullish outlook, with the potential for prices to climb as buying pressure mounts.
**Conclusion:**
Bank Saudi Fransi's recent market activities highlight a sophisticated approach to liquidity management and market positioning. The sell-side liquidity grab, coupled with the change in status delivery and the formation of a Fair Value Gap, presents a compelling narrative for potential price appreciation. Investors and traders should closely monitor BSF for buying opportunities, especially as the market seeks to target buy-side liquidity, potentially leading to significant upside momentum.
**Disclaimer:**
This review is for informational purposes only and does not constitute financial advice. Traders and investors should conduct their own research and consider their risk tolerance before making any investment decisions.
---
Let me know if you need any adjustments or additional information!

Making HH HL on Daily TF.
Bullish on All Time Frames.
However, Slight Bearish Divergence on Hourly TF;
which may bring the price towards 144.50 -145.50
& then around 136 - 137.
Important Resistance around 158 -159.
Sustaining 159 with Good Volumes will expose
New Highs, may be around 180s.
Note that Initial Resistance is around 153
that needs to be Sustained to neglect the
Bearish Divergence.

Play on LevelsPlan1
Buy Above 34 (if Sustained)
Sell around 39 - 41
Stoploss 33 (closing basis)
Plan2
Buy1 around 29.30 - 30.50
Buy2 around 27.30 - 28.50
TP1 around 33 - 33.50
TP2 around 35 - 36
Stoploss 26.80 (Closing basis)
