SAUDI ARABIAN OIL CO.Long trade with positive ratio.
if you have any questions do not hesitate to contact me.

Saudi Arabian Oil Co / AramcoMarhaba
Saudi Arabia stocks were lower after the close on Sunday, as losses in the Cement, Hotels & Tourism and Energy & Utilities sectors led shares lower. at the close in Saudi Arabia, the Tadawul All Share lost 0.17%.the best performers of the session on the Tadawul All Share were Wafrah for Industry and Development Company SJSC (TADAWUL:2100), which rose 5.74% or 1.75 points to trade at 32.25 at the close. Meanwhile Aramco couldn't break 32.40 now heading to lower level 31.50,as you see we still in down trend, the biggest support level for Aramco is 30$ and I think its one of the good buy zones too
Crude oil for March delivery was unchanged 0.00% or 0.00 to $80.11 a barrel. Elsewhere in commodities trading, Brent oil for delivery in March rose 1.74% or 1.46 to hit $85.49 a barrel, while the February Gold Futures contract rose 1.29% or 24.55 to trade at $1,923.35 a troy ounce.

Analyzing Current Downtrend and Strategic Trading Opportunity.Current Market Conditions
Saudi Aramco’s stock (2222.SR) has recently been showing a clear downward trend, closing at 28.20 SAR with a drop of 2.76%. This analysis aims to provide a comprehensive overview of the current technical indicators, patterns, and price action to forecast potential price movements and suggest strategic trading positions.
Candlestick Patterns and Price Action
The weekly candlestick chart reveals persistent bearish momentum. The latest candlestick pattern is a significant red candle, indicating strong selling pressure. The stock has been consistently making lower highs and lower lows, a clear indicator of a bearish trend.
Key Technical Indicators
1. Relative Strength Index (RSI): The RSI is at 23.04, which is deep in the oversold territory. This suggests that the stock is currently under heavy selling pressure, but it could also indicate a potential for a short-term rebound if buyers step in.
2. Stochastic Oscillator: The %K and %D lines are both below 20, further confirming the oversold condition. However, the lines have not yet crossed, suggesting that the bearish momentum may continue for a bit longer.
3. MACD (Moving Average Convergence Divergence): The MACD line is below the signal line, and both are in the negative territory, indicating that the bearish trend is well-established and likely to continue.
4. Moving Averages: All major moving averages (10, 20, 50, 100, 200) are indicating a sell. The stock price is below these moving averages, which act as resistance levels in the current downtrend.
5. Ichimoku Cloud: The price is well below the Ichimoku Cloud, and both the Conversion Line and Base Line are bearish, with the Leading Span A below Leading Span B, reinforcing the bearish outlook.
6. Awesome Oscillator and Momentum: Both indicators are showing negative values, indicating bearish momentum.
Market Sentiment and News
Recent news surrounding Saudi Aramco has been mixed, with market reactions to global oil price fluctuations and geopolitical tensions affecting investor sentiment. The bearish technical indicators align with broader market concerns, reflecting the overall negative sentiment.
Price Targets and Trading Strategy
Given the current technical setup, the stock appears to be in a strong downtrend. Here are the speculative price targets and suggested trading strategies:
Short Position: Enter a short position if the stock breaks below 28.00 SAR with a target price of 25.00 SAR, setting a stop loss at 29.00 SAR to manage risk.
Long Position: Consider a long position only if the stock shows a clear reversal signal, such as a bullish divergence in the RSI or a strong bullish candlestick pattern. Enter above 29.50 SAR with a target price of 32.00 SAR, and a tight stop loss at 28.00 SAR.
Conclusion
Based on the current analysis, Saudi Aramco’s stock is likely to continue its bearish trend in the short term. Traders should be cautious and look for confirmation signals before entering any positions. The suggested short and long strategies provide a balanced approach to capitalize on the stock’s movements while managing risk effectively. As always, stay updated with the latest news and market developments to adjust your trading strategy accordingly.

Alwasail industrial company My Elliott wave idea about alwasail
this is not financial advice disclaimer


BUY 2010Today I'm sharing with you one of the trades I shared with my private community,
As you can see on 2010, we have a pullback with a confirmation on the level 75.9. You can buy now with a TP and SL as sat on the chart.
For further questions and stocks to buy don't hesitate to ask!

Trade wiselyImportant Support lies around 50.50 - 51
& then around 43 - 43.50.
For Fresh Entry, either 54 should be Sustained
else, wait for the mentioned Support levels.

4200: Buy ideaBuy idea on 4200 as you see on the chart. Why do we have an idea to buy the 4200? This can be explained by three factors. It's about:
- The break of the resistance line;
- The break of the Vwap indicator.
- Finally all this is accompanied by large volumes.
Thanks!

A technical look at Al Rajhi Bank stock After the price broke its historical peak Al Rajhi Bank shares are preparing for a correctional journey with prices that are very suitable for those who are ready to invest in this bank.
Orange levels are very good to buy the stock. TADAWUL:1120

2082: ACWA POWER LONG POSITION2082:ACWA POWER seems to have potential for a long position according to ABCD Pattern BUT once price crosses 'B' level i.e. 493.4
Buy @ 493.4
SL @ 456.2; TP @ 567.8
Risk/Reward: 1:2
Good Luck!!

2222: SAUDI ARABIAN OIL CO. Probability of the end of downtrend as formation of ABCD Pattern is completed. Price may get range-bound or an uptrend can begin.
Watch out closely. Next week will clear the scenario.

bullish fractal for SABICI see a strong move from here in fractal way..
Still It is Nice weekly chart to follow ..

it should not break 84.As mentioned in analysis shared on 19-05-2024 that
85 should be Sustained on Monthly Basis; we
can see that Monthly Closing is at 89.90
Clear Bullish Divergence may act as a Reversal sign.
Now it should touch 92 - 93 once & Sustain this Level for
Further Upside.
On the Flipside, it should not break 84.

savola groupsavola group
once price tab on htf +ob> h4 market structure shift bullish i will buy, (not directly after confermation)

4015 JAMJOOMStop Buying
4015 JAMJOOM Pharma
monthly bisi>monthly imbalance created>ltf Confermation.
Target mention on chart.

Saudi Telecom Company (STC): A Promising Investment OpportunitySaudi Telecom Company (STC), a dominant player in the telecommunications sector, has experienced a recent correction in its stock price from a high of SAR 43 to the current level of around SAR 35. Market analysts identify an interesting entry level for STC between SAR 32 and SAR 34, offering potential investors a compelling opportunity to capitalize on the company’s robust market position and future growth prospects.
Additionally, STC offers an attractive dividend yield of approximately 7.08%, making it an appealing choice for income-focused investors. With its extensive infrastructure and commitment to innovation, STC remains well-positioned to benefit from the growing demand for digital services in Saudi Arabia and the broader region. Investors should consider this correction as a strategic entry point to gain exposure to a leading telecommunications provider poised for continued expansion and profitability

Jabal Omar Development Company: New Opportunities AheadJabal Omar Development Company, a leading real estate firm in Saudi Arabia, recently received approval to accommodate pilgrims, marking a significant milestone for the company. This approval is expected to boost the company's operations, particularly in the hospitality sector, catering to the influx of religious visitors.
The company's stock has seen a correction from SAR 30 and is currently anticipated to stabilize around SAR 22.5 to 21, presenting a promising new entry level for investors. This correction provides a strategic investment opportunity as the company leverages its new approval to drive growth and enhance shareholder value.
Investors should keep a close eye on Jabal Omar as it continues to capitalize on its prime location and regulatory advancements, potentially leading to substantial returns in the near future.
DR SAUD

SAUDI RESEARCH & MEDIA GROUP (4210)🚀 Stock Alert: SAUDI RESEARCH & MEDIA GROUP (4210)
📈 Investment View: Technically Bullish 📈
🔍 Quick Info 🔍
📈 Entry Range: 220
🎯 Targets : 270
⚠ Stop Loss: 200
⏳ Nature of Trade: Long Term (Swing)
📉 Risk & Reward Ratio: 1 : 2.50
📰 Technical View: In the preceding trading week, the price movement successfully breached the significant resistance level of 220 SAR, culminating in a notable total gain of 30.2 SAR (+14.60%) and concluding at 237 SAR. Additionally, the super trend indicator has signaled a bullish momentum within the weekly time frame, further corroborated by the confirmation provided by the MACD indicator. Looking ahead, the former peak at 270 SAR now functions as a resistance barrier, potentially prompting profit-taking activities. Conversely, there exists a possibility for the price to retest the 220 SAR level, transforming it into a support level, having previously served as resistance. To mitigate risks, a prudent approach involves placing a stop loss below the breach point of 200 SAR, as a reversal in momentum may occur subsequent to this breach.

4164Pull back from 0.5 (137 SAR) Fibonacci level is observed. Currently price is trading around 141.80 SAR. Resistance level lies around 151 from where selling can be expected. If is breaks and sustains then more upward can be expected. Use stop loss to manage risk below the support level of 137 SAR.

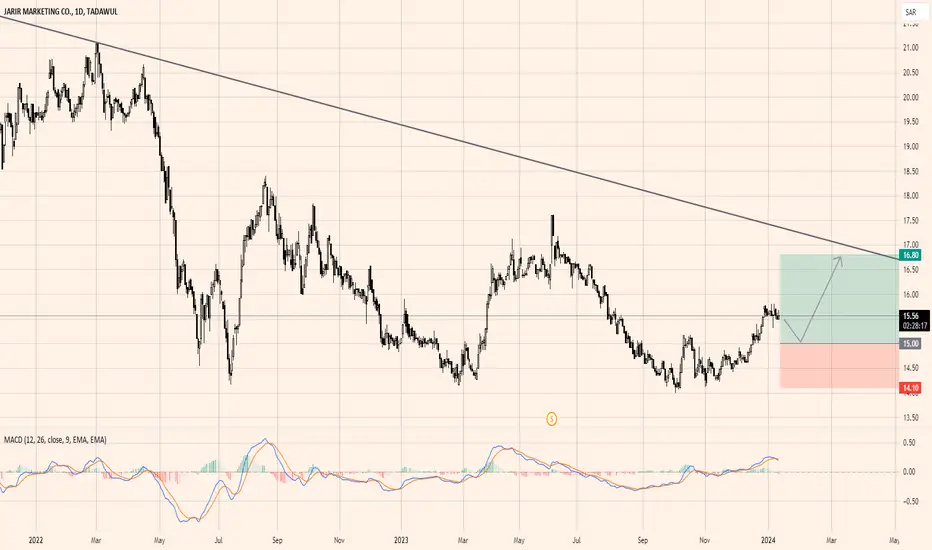
4190Jarir Marketing Company (4190) shows rejecting after cross over seemed in MACD. Support level is at 15 from where pull back can be seen. In a longer term price can test descending trend line around 16.80. To manage risk, a recommended stop-loss can be placed below 14.10.

7203The price is currently testing 200 day EMA with the closing price of 842.4 in the last trading session. Moving forward, if this level sustains then a possible pull back can be seen in its price with the initial resistance lies around 954 and secondary resistance level lies around 1,003. Use stop loss at 815 just below the recent low.

4071The price action is currently near the test of ascending trend line after got rejection from 298.4 level where bearish divergence with RSI is observed and closes at 221.4 in the last trading session. Upon sustaining the trend line support price can pull back towards its resistance levels of 240. If it breaks down ward then further bearish momentum can be seen.
