2281| TANMIAH FOOD COTANMIAH FOOD CO
Broke descending triangle
Bullish signal: Buy
Next targets: 135 > 150 > 170
Good luck!

4142The stock exhibits a rejection subsequent to reaching a peak of 122, concluding at 112 during the most recent trading session. Immediate support is delineated within the range of 106-103; the stock's ability to maintain this range may prompt a pullback, while a breakdown could lead to a test of the subsequent support near 95. Conversely, breaching the 122 level would signify the establishment of bullish momentum.

Al-Rajhi (8230)The current price movement exhibits a robust bullish trend, initiated by the breach of the former resistance point at 77, culminating in a closing figure of 84.70 during the recent trading session. Looking ahead, the subsequent target projection is positioned around 88.60. Conversely, a support level is identified around 77, denoted by its previous status as resistance.

2140| AyyanAyyan Investment
Cup and handle pattern.
Breakthrough 28 SR will take us 100 % to 55-60 SR from the bottom of the handle
Breakthrough 28 SR will take us 250 % to 100 SR from the bottom of the cup
Good luck!

FITAHI HOLDING GROUPHello to all tradingview investors, according to my previous analysis I see a great opportunity with good probability, the details are reflected in the chart, greetings and good luck to al

7204 2P - forecasted targetsA simple technical view on the Perfect Presentation Co.
No advise for buy or sell

4322 RETAL Urban Development Co.Technical view with expected target on a long term investment plan.
No advise for buy or sell.

1183 SHL Finance on double bottom continuation patternThis is a technical view, not a buy or sell advise. I express my technical view on this stock with forecasted target.


1210 - BASIC CHEMICAL INDUSTRIESPotentinal Harmonic Pattern ( Cypher) which could be devloped late to shark.
tareget are shown on chart.

Harmonic bullish pattern formedHarmonic bullish pattern formed, expecting inverse head and shoulder as well.
only for educational purpose. do your own research.

Tourism Enterprise Co| 4170📊 Tourism Enterprise
📈 Broke-out its symmetrical triangle
🏷 Current price: 0.76 SR
🎯 Targets: 0.87> 1.06> 1.19>1.32>1.49>1.75
☝️Rest of details in chart
Good luck!
🤝Please do not forget to support, cheers, likes, comments and boost!
Thanks!

6015| Americana RestaurantsAmericana Restaurants
Getting ready for departure!
Targets at: 3.5> 3.70>3.90>4.0>4.20>4.50
Good luck!

Gulf Union Alahlia on weekly closeGulf Union Alahlia has a great potential to reverse as it has a great break out of the diamond pattern. Though it has a great weekly close, we still need to move above the confirmation line drawn in chart.

Alyamamh Steal Personal View The stock is reversing an important area. Wait for the confirmation for bullish move.

Short Signal on BANK ALJAZIRA Hello,
We identified a sell signal with high probability on BANK ALJAZIRA in WEEKLY chart for a target of 16 SAR within a few weeks.
Ibrouri

4072| MBC📊 MBC
✅ All targets from last analysis achieved
💰40 % gain before price correction
🏷Price correction almost at an end and accumulating by forming a symmetrical triangle
It's an imports to watch over the next few days for breakout 📈 vs breakdown 📉
📈 Likely will breakout and then will form an uprising channels
🎯Targets and rest of details in chart
Good luck!
🤝Please do not forget to support, cheers, like, comments and boost!
Thanks!

4110: Batic Investments and Logistics📊 Batic Investments and Logistics
📈 Broke out it's descending and symmetrical triangles
🚀I think likely will keep up-trending in uprising channels
🎯 Next targets in chart
Good luck!
🤝Please do not forget to support, cheers, like, comments and boost!
Thanks!

2230| Saudi Chemical Company📊 Saudi Chemical Company
📈 Updated analysis!
💰25 % gain achieved since last analysis
Forming triple bottom and retesting for breakout. After breakout confirmation, will form uprising channels.
🏹 Targets and other details in chart
Good luck!
Please do not forget to support, cheers, like, comments and boost!
Thanks!

1820| Abdulmhsn Al-Hkr GrpAbdulmhsn Al-Hkr Grp
Since we started following; 7 % gain achieved
Here is an updated analysis> forming uprising channels
Targets in chart
Good luck!
Please do not forget to cheers, support, like, comments and boost!
Thanks!

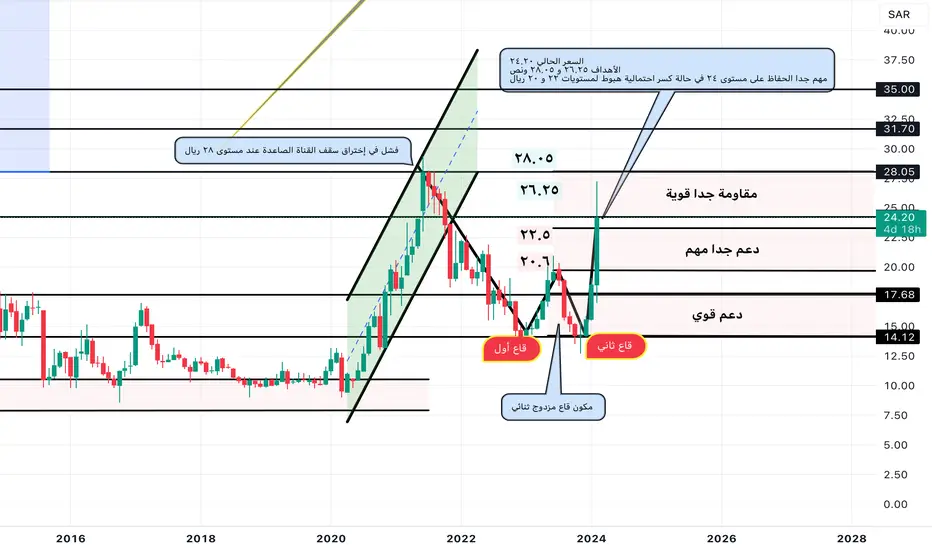
2140| AyyanAyyan
Double bottom
Trading at an important support levels
Targets: 26 and 28 SR
28 SR level is very hard and challenging resistance
22 and 20 very imports support levels
Good luck!
Please do not forget to support, cheers, like, comments and boost!
Thanks!
7201|Arab Sea Information Systems📊 7201| Arab Sea Information Systems
Broke out its descending triangle
Targets: 8.90, 10.70, 12.60, 14.70> 17.25> and 20.15 SR
Supports: 6.50 and 5.55 SR
Good luck!
Pease do not forget to support, cheers, like, comments and boost!
Thanks!

DON'T BUY 2222Aramco (2222) is one of the stocks I recieve messages about from people who have bought and now they're in loss.
You can notice on the chart that the market is currently below the strong level we have at 32.10, for now there's nothing you can do about it unless your broker allows you to enter with short trades.
My private community and I cureently are not seeking to enter on 2222 and 1120 since all there are no buying opportunities on them, anyone who have bought in them will face losses during the next days.
Don't hesitate to ask if you got any questions!
