Catering Holding (6004) formed a pattern, to target 181.5Weekly chart, the stock (6004) has formed a bullish chart pattern, and the first target is 143.6
Technical indicators RSI and MACD are positive.
Then Fibonacci extension indicates the following targets 161.4, 171.6, 181.5

ARABIAN PIPESbears are expected to take control for short term with confluence of evidence from divergence

POTENTIAL UPSIDE MOVE IN MIDDLE EAST HEALTHCARE CO. (4009)4009 is making higher highs and higher lows and it has recently broken the all-time high.


Astra Industrial Gr....TadwalAstra industries is in bullish trend...look for consolidation breakout at 1 hr time frame...Bulls can drag the levels to next level...wait for breakout

Jarir (4190) is targeting 16.10 then 17.20 after crossingDaily chart, Jarir stock is about to cross the resistance line (BLUE), then the target will be 17.20
Already a double V bottom formed and the target is 16.10
MACD is very positive, indicating upwards direction.
Stop loss below 14.9 should be considered.

7010 IS CONSOLIDATINGDear Saudi Traders and Investors,
As you can notice on 7010 chart, the market currentlt is in a consolidation area, before you decide if you can buy or sell the market must get out of the area first then you can take your chance.
For further questions don't hesitate to ask!

DON'T BUY 1120 NOWDear Saudi Traders and Investors,
As you have read on the title, don't buy 1120 this week, you can see on the chart, the price is currently on the tough resistance we have at 83.2, since it has a high volume, we must wait for the price to give us a confirmation that it will continue on its way up. If not this MIGHT be a pullback, however there's a high probability of going higher. To play it safe wait for the confirmation.
Don't hesitate to task in case you got furder questions!

DON'T BUY ON 2222Dear Saudi Traders and Investors, it's been a while since I last posted about any market.
Today I'm giving you some updates on Saudi Stocks.
Starting with 2222, as you can see on the daily chart, the price is currently on the tough support level we have at 32.85 with the highest volume we have in the period of the past 2 months. What you got to do now is you wait for the price to come back up with a confirmation of the pullback then you can get in with your position.
Don't hesitate to ask if you got further questions!

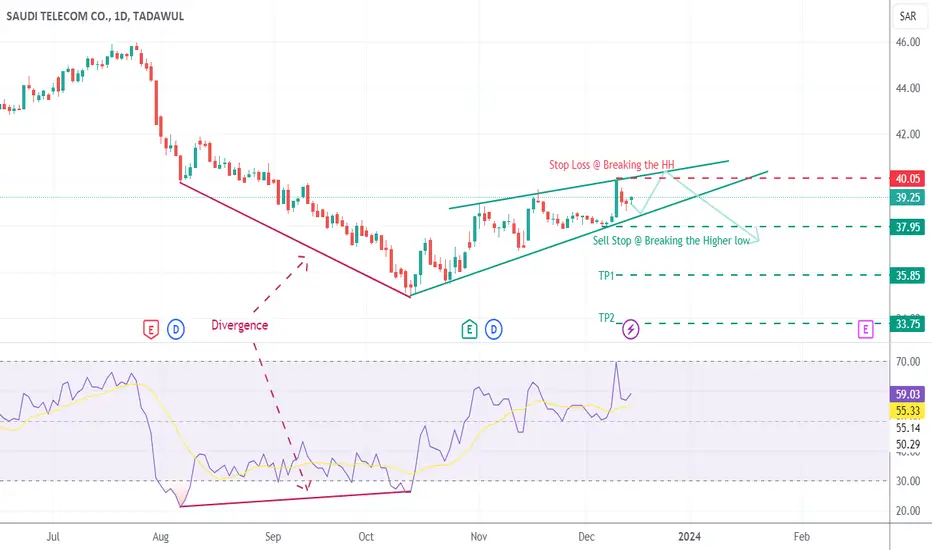
7010 Saudi telecom co. Printing Rising WedgeSTC @ Tadawul printing bearish Rising edge on Daily TF
EP, SL, and TPs marked on Dow Theory
Mouwasat Medical Services Company - 4002The price action is currently retracing towards 0.382 Fib level with support defined around 108.2 - 105.2 range. Long position is considerable at support for the target of previous resistance level of 118 with the stop loss placed below 102.

Arabian Drilling Company - 2381The chart pattern is showing a bearish crab harmonic pattern. Which indicates more downward momentum in its price. It is advised to wait for confirmation for taking a long entry. First and second support levels are 182 and 175 respectively.

4070 First move Getting the First move after recording the 5 y low it semes that they want to fix the way that they work
I see a lond for grat targt it is a good time for going long

1832 to 7.5 I believe the target is to above 7.5 and it is now in the absorption process before moving up. I have no stop loss at this stage. However you need to decide yours.

4013After confirming bullish cypher pattern, price is in uptrend and is targeting towards 305. Currently trading around 282.

1120The chart pattern shows rejection in price after testing resistance level of 77. MACD is shifting from bullish to bearish. The price can test support level around 71.

1120The Tadawul All Shares Index (TASI) closed the latest weekly session at 11,225.35 , marking a positive gain of 47.87 points (0.43%) . Currently, the index is testing desending trend line. The index shows low activity with a small candle body which indicated rejection can be seen in upcoming sessions. A bearish pattern is evident until the 10,400 support sustains. The weekly RSI stands at 53.84, while the MACD signals a weak bearish trend, poised for a bearish shift.


2360 -Tadawul stocktarget in simple terms between 77-88. could be more but we will review later when targets reached

Jabal Omar Jabal Omar is currently exhibiting a bullish trend in both daily and weekly charts, signaling a promising investment opportunity.
The company's strategic plans for expansion, coupled with the ongoing developments in Hajj and Umrah services, bolster the likelihood of robust growth.
Our target for Jabal Omar is an ambitious yet attainable 28, reflecting confidence in its future potential.
Dr saud

SAUDI ARAMCO is BullishARAMCO after successfully retesting 0.5 fib retracement level is on course for a new bullish rally with a potential target of new all time high. Targets are mentioned on the chart.

4164 (Nahdi Medical) to target 165 - And more!Daily chart, a pattern was formed, the target is 165
Stop loss at 132 or minimum the Green line.
RSI and MACD indicators are supporting the uptrend.
Above 165 for a week, the far target will be 214, passing through the shown resistance levels.

TASI: 4040 SABTCO Sometimes you have to see the big picture, the macro trend, to understand the stock movement. #TASI4040 as an example:
- Higher lows and lower highs since 2007
- accelerating time in the low phases
- buying with volume + improved profits
- public transportation sector is growing with government and private incentives.
The stock only require patience. Analysis hint to a highly likely scenario of +30% within 12 months. and even more after that. All contingent on momentum and market trend.
_________
Disclosure: this is not a recommendation for investment. This is purely a journal for me and my own learning.
