Aljazira Takaful (8012) – Bounce from Key Support, More Upside?The stock bounced from a strong support around 14.30 after a steep decline.
Currently testing 14.90 as a key breakout level.
If it holds, targets are set at 15.60 and 16.20, with a stop loss below 14.30.
If it fails, next support lies around 13.70.
Short-term analysis on the 4H timeframe.

8030, Medtrn nd Glf Cptv Insrn nd Rnsn Co SJSCHello,
there is no need for detailed explanation on this stock,
One of my favorite.
Good luck for all

8200, Saudi Reinsurance Company SJSCHello traders,
Saudi Reinsurance Company SJSC is one of the best insurance company in TASI.
Moody's has affirmed its rating at A3 Insurance Financial Strength Rating (IFSR) with Positive outlook.
P/E Ratio: 9.63
Good Luck for all

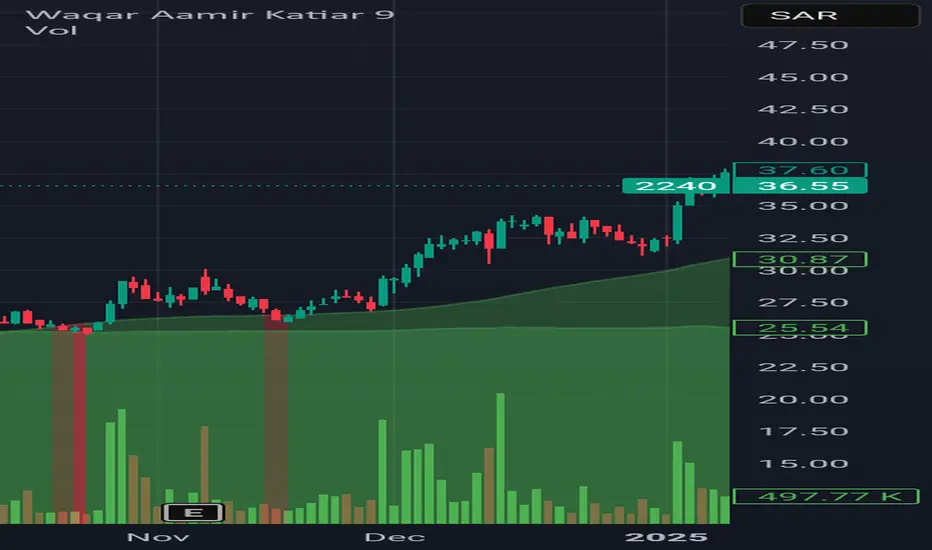
2240 (Zamil Industrial Investment) entered into bullish zone 2240 (Zamil Industrial Investment of Saudi Arabia Stock Exchange) is entered into bullish zone and may fly high.
Note, this is not a buy sell trade call. Trade at your own will.
1120 is entered into bearish zone 1120 (Saudi Arabia Stock Exchange) is entered into bearish zone. It could drop more and rapidly. Fresh buying is not recommended.
Note, this is not a buy sell trade call. Trade at your own will.

Catrion Catering Holding 6004✈️ Aviation-Themed Trading Captions
"Every flight needs a runway — the market is just taxiing before takeoff."
"Before soaring to 179.8, it’s just aligning on the runway. Fasten your seatbelts!"
"Just like a Saudi Airlines jet — a slight dip for alignment, then full throttle to the skies!"
"Descending slightly, not to fall — but to gather momentum for liftoff!"
"Markets, like planes, don’t take off from mid-air — they need the runway first."
"Runway 102.8 cleared. Destination: 179.8. Ready for takeoff!"
"Don't fear the pullback — it's just taxiing before liftoff."
"From the runway at 102.8, straight up to cruising altitude 179.8 — fasten your trading seatbelts!"

TARGET FILLED ON 1010A trade I gave to my clients the beginning of this month reached the target last week.
These are the kind of the trades we're taking, slow but profitable!
Join the community by following us!

1201 IS ONE OF THE STOKS ON MY WATCHLISTEid Mubarak Said, Now since we're getting back to work sooner, I want to share with you some of the stocks I have on my watchlist.
For 1201, you can buy as soon as the price goes through 9.53 level to target 11.14, and your stop must be at 8.59.
Follow for more!

Morning StarBeautiful Morning Star formation on Weekly basis.
Immediate Resistance is around 33 & then 36.
It should not Break 26.50 now otherwise, we may
witness More Selling Pressure.

HH PrintedIt has taken Support form 23.40 which is
a Very Strong Retracement level.
Immediate Resistance Zone is around 31.90 - 32.50.
If this Level is Crossed, we may witness 34 - 34.20
However, it should touch 40 - 41 in medium term.
Immediate Support levels are 30.30 & then 29.30
which seems to be tested.

Bullish Divergence on Monthly TF.Bullish Divergence on Monthly TF.
Weekly Support seems to be around 30.
& Important Resistance is around 32-33.
Though a re-testing of breakout done. but
Important to Sustain 24.90
As of now, Stock is in sideways movement;
& it will be Bullish once it will cross 36.
A positive point is that there are multiple
bullish / hidden bullish divergences on
different time frames.

Nahdi Medical Co. (4164) - False Breakdown & Trendline Breakout?🚨 Nahdi Medical Co. (4164) recently experienced a false breakdown below 115.6, but has since recovered above it. With the stock now testing a downward trendline, crossing this line could signal the start of a new upward move. 📈
💡 Key Points:
• Current Price: 115.2
• False Breakdown at: 115.6
• Key Resistance at: 118
• Support/Stop Loss: 111.6
• Target: Potential upward swing after breaking 118
📊 Technical Analysis: The false breakdown below 115.6 followed by a recovery signals a potential bullish reversal. If the stock breaks the downward trendline and crosses above 118, it will confirm a new upward swing.
📈 Trade Strategy: The price range between 111.6 and 118 is an ideal buying zone. A breakout above the downward trendline and 118 will confirm the start of a new upward wave. Enter with a stop loss at 111.6, and if 118 is breached, expect the rally to continue.
What are your thoughts on Nahdi Medical Co.’s price action? If you think I missed something or see a different pattern, feel free to share!🔥

SAUDI ARAMCO BASE OIL - Daily Chart (TADAWUL)SAUDI ARAMCO BASE OIL - Daily Chart (TADAWUL)
"After a long bearish phase, the market finally pauses to breathe. If the next bullish leg confirms, it will unlock the roadmap to higher targets. With strong conviction, I believe the 2025 low is already in place. Eyes on 107.4 first, then 111.8. Let price reveal the story.

Trade Idea: ALSAIF STORES (TADAWUL: 4161)📈 Trade Idea: ALSAIF STORES (TADAWUL: 4161)
Timeframe: Daily (1D)
Current Price: 7.96 SAR
Setup Type: Breakout & Retest
🔍 Trade Narrative:
Price has broken above a recent consolidation zone (marked in light blue).
Strong bullish momentum is visible after reclaiming the key level of 7.80.
Market structure shows higher lows and a push towards previous liquidity zones.
🎯 Trade Plan:
Entry Zone: 7.80 – 7.90 (retest area)
Target 1 (T1): 8.35 (Previous High / Liquidity Grab)
Target 2 (T2): 8.44 (Final Target with Heart Marker 💗)
Stop Loss: Below 7.70 (below recent structure)
📊 Risk-to-Reward:
Approx. Risk: 0.20
Reward: 0.44 – 0.64
R:R Ratio: ~2.2 to 3.2
🔧 Confluence:
Daily structure shift confirmed
Liquidity resting above 8.35
Volume spike during breakout
Potential bullish continuation if price retests successfully

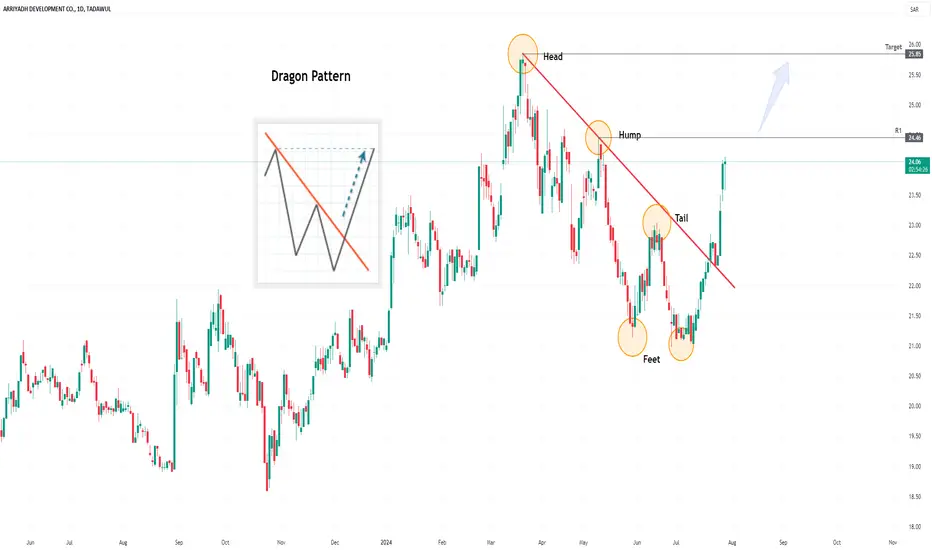
4150 | Bullish Dragon PatternArriyadh Development Company (4150) - Technical Analysis
Pattern: Bullish Dragon Pattern
Context:
Previous Trend : The stock price was in a downtrend since reaching a peak of SAR 25.85. During this downtrend, the price made lower lows and lower highs, resting around SAR 21.
Breakout : A breakout was observed from the descending trend line.
Pattern Details:
First Candle : Long bearish candle during the downtrend.
Second Candle : Small-bodied candle that gapped down.
Third Candle : Long bullish candle that closed above the trend line at approximately SAR 22.70.
Support : After the breakout, the price reset and established support around SAR 22.34.
Potential Reversal : The formation indicates a potential reversal to an uptrend.
Resistance and Target:
Initial Resistance : SAR 24.46
Target : Upon breaking the initial resistance of SAR 24.46, the price may test the previous top of SAR 25.85.
TADAWUL: 3050 (Southern Province Cement Co.)📈 TADAWUL: 3050 (Southern Province Cement Co.)
The stock has entered a long-term demand zone near 30.70–32.00, showing historical support. If this zone holds, a potential bullish reversal could take price first toward the 36.90 resistance, then to 44.00, with a final target around 46.35.
Trade Idea:
Entry: 32.00–33.00 (inside demand zone)
TP1: 36.90
TP2: 44.00
TP3: 46.35
SL: Below 29
Bias: Bullish (as long as price holds above 30.70)
Narrative: Accumulation in demand zone with a possible shift in trend.

LeejamA falling wedge is a bullish pattern with the following characteristics:
Shape: Two converging downward-sloping trendlines.
Breakout: Price breaks above the upper trendline.
Volume: Declines during formation, increases on breakout.
Target: Height of the wedge projected from the breakout point.
Stop-loss: Below the most recent swing low inside the wedge.

Trading Idea - Saudi Ceramic (2040) | Monthly Chart with Inverte🧠 Trading Idea - Saudi Ceramic (2040) | Monthly Chart with Inverted FVG
🔍 Chart Context:
Price has reacted from a Monthly Inverted Fair Value Gap (IFVG ), indicating a potential premium-level supply zone.
This rejection confirms sellers’ presence at the premium pricing zone, causing a sharp drop.
Price has returned to the discount zone, inside the Monthly FVG (Buy Side Imbalance Sell Side Inefficiency - BISI), offering a potential long opportunity.
📌 Key Technical Concepts:
✅ IFVG = Zone of Previous Supply / Institutional Sell Orders – price rejected sharply from there.
🟦 FVG = Current demand zone (discount area) with potential to support a reversal.
Liquidity above 54.3 SAR remains untouched, showing a magnet for future price movement.
📈 Trade Plan:
Accumulate in the FVG zone (28–30 SAR).
Watch for bullish confirmation (e.g., engulfing candles or internal BOS).
Ride the move towards Buy Side Liquidity @ 54.3 SAR.
🎯 Target Zones:
TP1: 36 SAR (range high retest)
TP2: 48 SAR (pre-IFVG reaction zone)
TP3: 54.3 SAR (BSL target – possible liquidity sweep)
📉 Stop Loss: Below 24 SAR (FVG invalidation zone)
💬 Narrative Summary:
Price was rejected from the Monthly IFVG (supply), now resting in a Monthly FVG (demand). This is a classic Discount → Premium cycle setup, with potential for a bullish reversal targeting Buy Side Liquidity above the recent highs.

4081 Naifat Finance (TADAWUL)📊 Trade Idea Overview – Weekly Timeframe
✅ Key Technical Levels:
Demand Zone: Clearly marked between 12.00 – 13.00, showing strong historical buyer interest.
Current Price: 13.38
Fibonacci Retracement Levels: Price is reacting near the 0.705 - 0.79 zone, which often acts as a bullish reversal area.
Target Price: 18.40 — Identified as Buy-Side Liquidity Zone (BSL) and a previous significant high.
Resistance Zone: Around 18.40, where liquidity is likely to get captured by smart money.
📌 Narrative & Market Context:
Price has shown a bullish reaction from the Demand Zone, indicating accumulation or potential bottom formation.
Fibonacci confluence with demand strengthens the bullish setup.
Once price breaks above 14.00, a bullish market structure shift will be confirmed.
The chart also visualizes a projected path toward 18.40, indicating a strong bullish impulse wave ahead.
📈 Expected Price Path (as shown in chart):
Minor pullback toward 13.00 area (retest demand / Fibonacci zone).
Breakout above 14.00 – a key structural shift.
Bullish continuation toward 18.40 Buy-Side Liquidity.
📍 Trading Plan Suggestion:
Entry Zone: Between 13.00 – 13.20 (ideal demand re-entry).
Stop Loss: Below 12.00 (invalidate demand structure).
Take Profit: 18.40
Risk-Reward Ratio: Excellent (Potentially 1:3+ R:R)

2222 – Saudi Arabian Oil Co | Long Idea – Monthly Chart Analysis📈 2222 – Saudi Arabian Oil Co | Long Idea – Monthly Chart Analysis
Price has reached a Monthly Demand Zone, where strong historical buying interest was seen. After a consistent downtrend, we are now approaching a potential accumulation zone.
🟦 Trade Idea:
Entry Zone: 23.90 – 25.50 (within Monthly Demand)
Stop Loss: Below 22.30 (Monthly swing low)
Target 1: 30.35 (Monthly Fair Value Gap – FVG)
Risk:Reward: Excellent potential with ~17.6% upside
📊 Narrative: This setup aligns with Smart Money Concepts (SMC) and ICT methodology:
Liquidity sweep at the low
Reversal from Demand
Targeting FVG imbalance above
❤️ A potential bullish move is anticipated, tapping into premium pricing around 30.35, which may act as a magnet for price.
🔔 Watch for bullish confirmation candle or a shift in structure (CHoCH) on lower timeframes for refined entry.

2310 ALMOST AT THE PRICE GAPCouple days ago, I posted that 2310 will continue going lower to reach 20.02 before starting to go higher again.
And here is the stock coming lower to our Price Gap to fill it before starting to raise.
Meanwhile, I'm waiting for the stocks I shared to my clients to get a bit far from the entry so they can make profits from them, then I can post them to the public.
Follow for more!

2222 WILL GO LOWER2222 is also one of the stocks that are showing no indication that it will come higher anytime sooner.
We'd expect from the price to drop to 23.90 before reversing, if you're welling to buy I advice you not to.
While waiting for other opportunities, my clients and I are holding on 3 other stocks I will post as soon as the market starts going higher.
Follow for more!

1120 STILL PREPARING TO COME LOWERDays ago, I posted that 1120 will come lower, and still it didn't since it kept consolidating in the LQ we have at 102.2-100.2, we'd expect the price to come at 96.0 for a LQ Grab before continuing going higher.
Meanwhile my clients and I are holding on 3 stocks which I will share to the public as soon as the market goes a bit higher.
Follow for more!
