AL-OMRAN INDUSTRIAL TRADING CO. - Bearish Signs Show some weak signs:
1- Strong down move
2- Break strong support
If support turn to resistance
target will be:
TP1: 22 level
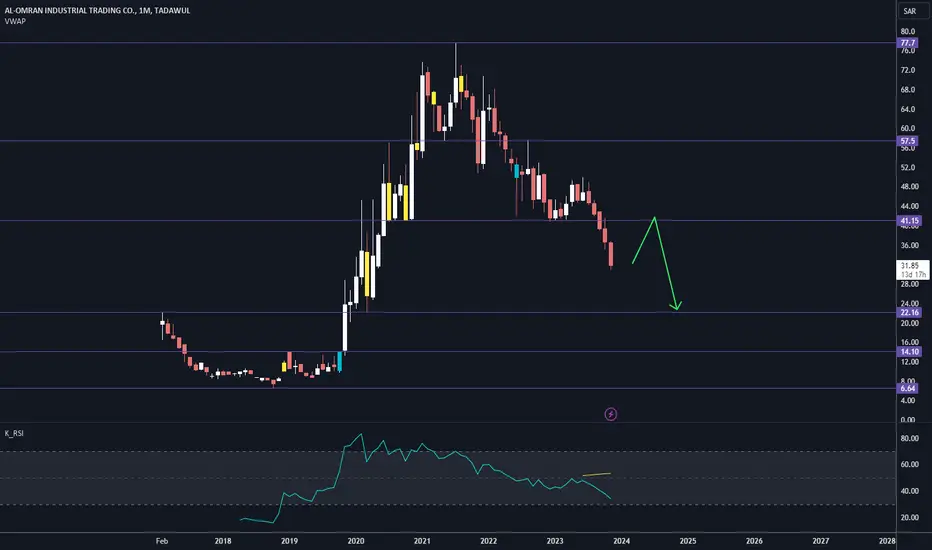
Lumi break the pattern Hello everyone…
Please refer to last video I made about lumi and potential targets.
Best of luck

ARAMCO 2222 is preparing to cross 33.7, then 35, 36.7On the daily chart, ARAMCO 2222
is preparing to cross 33.7, then 35, 36.7
The stock may test support 33 - 32.5 then rebound.
Technical indicators RSI and MACD are supporting this view.
Above 37, the next target will be 43.5 (weekly range)
Stop loss at 32.5 - 32 should be considered.

Strong Sell Signal On AL RAJHI BANK With High Probability!Hello ladies and gentlemen, according to my graphical analysis of AL RAJHI BANK, there is a high probability of a decline towards the 68 SAR level in the next few months!

2281: Watch for Breakout (Bullish)After major correction (series of LH, LL), 2281 has started formation of HH, HL (Bullish Trend).
Price is ranging in a descending parallel channel.
Breakout of parallel channel top, formation of another HH can be a profitable trade.
Ride with trailing stop loss.

4013: Watchout for trendline Breakout4013 has been in correction after making ATH.
A significant support (Ascending trendline) was broken in recent past for the first time.
After completion of Harmonic Pattern, Double Bottom formation, a short upside move is observed (formation of HH, HL).
However, ascending trendline will be acting as resistance now.
Although, breakout of trendline was observed during the recent bullish trend, but couldn't sustain.
Wathout for breakout of ascending trendline resistance for long entry.
Trade with SL

7203_Breakout (Bullish)7203 has been in bearish trend (correction) for a while after making All Time High.
Formation of LL, LH respecting a descending trendline resistance (Triangle Top)
Recently has made a double Bottom confluenced with Golden Pocket, Good Support Level.
Breakout of Descending Trendline is observed for first time in a while.
After retest, trendline is respected (acting as support).
Long position above horizontal resistance line can be taken (confirmation after formation of HH)
Bullish trend will be confirmed after formation of HL
Trade with SL

📊 2223 Shares Technical Analysis 📈📊 2223 Shares Technical Analysis 📈
🔍 On the daily timeframe, we're exploring the potential for a bull run using the "Smart Money" concept. Here's a quick breakdown:
**Trend**: The stock has been consolidating, indicating market indecision.
Remember, this is not financial advice. Do your own research and consult a professional before investing. 🚀💰💡

SAUDI ARAMCO BASE OIL CO. WEEKLY after shift market structrut and creation fo order block and fvg we see a retracement of the price to retest order block and fill fvg and retest golden zone of fibonacci so we will see a drop of the price to taken liqudity of the sell side and fill fvg of up trend

Aramco has a potential to go up more and moreHello dear investor
As you see on my chart 2222 will probably raise to reach its 32.75 and 42 levels
Keep in mind that 2222 breaths its 50% corridor evolution so when we notice breaks out of these coridors it will reach the next key levels on blue color.
Remember dear ionvestors that I am not using cristal ball to predict future markets but I try to be more efficient and more rationnal.
Good luck and if you like my posts ecourage me and feel free to ask me analysis for any market you want


saoudi basic industries holders be awarehello
first as you see on my chart resepects its evolution according to the figure so:
- if it breaks the suuport line around 65.8 it will reach 59.4 then maye be pulback toward its broken support then continue its free fall until 38.6 or more.
- otherwise it will rebond on its support and buyers can hold their stocks wishing higher levels
Remember that this support is a critical level so pay attention
NB:the horizontal blue line presents a historical level that retraces history of this stock
Keep in mind that i am not having a cristal ball predicting future but i try to be more efficient and rationnal

2223 lubref followlubref follow up and areas of interest where we explain future passable price behaver

Saudi Aramco Stock on Tadawul ExchangeSaudi Aramco made more than 94,5 billions in profits this year. This is a good order to win the situation. After last year losses this ship is going to deliver. As you can see on the presented chart, we have prepared more complex strategy for this Asset. Alpha+Beta is when interests of passive and active managers follow the same road. Sigma stayed the same. Theta, also the same. Omega+Kappa is when interests of minority investors are divided by conflict of interests for some reason. Why we think this is truth, and not a hogwash? Well, truth in numbers, try to not associate yourself with this, calculate it yourself. Good luck with Saudi Aramco Stock, investors.

LUMI raising wedge update and follow up LUMI raising wedge update and follow up where we updated chat pattern and interest levels

SAUDI BASIC INDUSTRIES CORP is Bearish with high probability!Hello ladies and gentlemen, according to my chart analysis of the SAUDI BASIC INDUSTRIES CORP stock, there is a high probability of a decline towards the level 74$ in the next days.

3003 City Cement - TASI - Long1. Price at bottom of the channel
2. Divergence at RSI at Daily TF
3. Oversold Weekly Momentum

4008 sacodivergenc
bullish trend, with prices breaking through their resistance levels. This is a sign that the rally is just getting started, and the shares could reach new highs in the coming months.

21902190 is trading in fine bullish trend and maintaining well the bullish trendline.
Whenever the price retest the bullish trendline buyers are attacking aggressively, which can be seen from the chart.
Currently the price is above trend line and touching to the inclining trendline around 21.50 ( considered for long position) and again it is being expected that the bulls are ready to attack. Risk is defined below 18. Wait for confirmation candel when price touches trend line around 21.50

7010Saudi Telecom limited is currently testing trend line and RSI pulled back from 30 level. Can be considered for a long position with stop loss below 35 (break of trend line)

DON'T BUY 2040Dear Saudi Traders and Investors,
2040 is one of the stocks I get asked about if there's an entry on it or no, and I posted about it 2 months ago and the stock is still heading down.
For now there's nothing to do since there's no sign of a squeeze or a pullback on a level, the stock will keep going down to reach the level 1 of the pitchfork.
If you don't know which stock to put your moey in or you're holding in a loss and you don't know if you will exit or you can still hold, Contact me and I will give you the assistance you will be need!

4190 Al Jarir MarketingAl Jarir Marketing shares are on the rise, with prices tapping their resistance levels and on their way to the moon.
Al Jarir Marketing shares in a bullish trend, with prices breaking through their resistance levels. This is a sign that the rally is just getting started, and the shares could reach new highs in the coming months.

4007 Al Hammadi HoldingAl Hammadi Holding shares are on the rise, with prices tapping their resistance levels and on their way to the moon.
Al Hammadi Holding shares are in a bullish trend, with prices breaking through their resistance levels. This is a sign that the rally is just getting started, and the shares could reach new highs in the coming months.
