TARGET FILLED ON 10602 months ago, I posted to buy 1060, and the stock reached our TP couple days ago for a profit of 200% invested amount.
This is an example of the trades I share to my students and clients.
For further questions don't hesitate to ask!
Follow for more!

2030 IS STILL GOING BEARISH 2030 is one of the stocks people want to buy, but to do it in the current time is a wrong decision to make, since as you can see, it kept pushng lower and lower since Sep 2023.
For now, before we can take a small trade on it, we must wait for the stock to take the LQ we have in the level 60.1. As soon as it's done, we will search to see if we have our entry point to follow it.
For any further questions don't hesitate to ask!
Follow for more!

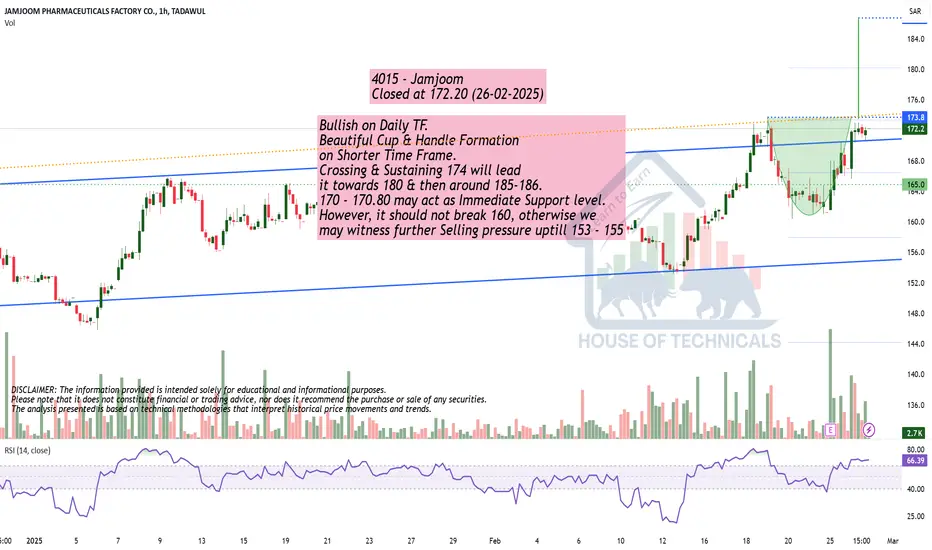
Bullish on Daily TF.Bullish on Daily TF.
Beautiful Cup & Handle Formation
on Shorter Time Frame.
Crossing & Sustaining 174 will lead
it towards 180 & then around 185-186.
170 - 170.80 may act as Immediate Support level.
However, it should not break 160, otherwise we
may witness further Selling pressure uptill 153 - 155
STC in KSA , 7010Technical analysis of the Saudi Telecom Company STC, subject to error and correctness. Just a simple look and analysis, not a recommendation to buy or sell.

A HIGH PROBABILITY 4003 WILL GO LOWERAs you can see on the chart, the price grabbed the ATH WK LQ, and now all it kept doing is giving us lower highs for the last 4 months since it grabbed the liquidity.
The wise thing to do is to sell if you're holding any shares, and if you haven't bought yet, just hold your funds and wait for the stock to give you a clear entry.
The comment section is all yours for further questions!
Follow for more!

DONT BUY 2010 YETAs you can notice on the chart, the price is still pushing lower and lower since April 2024, for now we sill don't have an entry to take or any bullish indication, the price is still pushing lower and lower.
For the next 2 weeks, we'll see if the price will give us a confirmation of a reversal or no since it is already in a liquidity zone, don't get fooled by the big movement the market is going to the in the next couple days, that's just a manipulation.
For further questions the comment section is all yours!
Follow for more!

TP REACHED ON 2040One of the trades I gave to my clients and I shared to the public is this one on 2040, as you can see, the market have reached our TP and reversed right away.
BY the grace of Allah, all of the 5 trades we took for the past 2 month have reached the tp, and all of my clients are satisfied with the return they had from them after being in big losses, the least trade had a return of 200% of the invested amount.
Don't hesitate to ask if you got any further questions!
Follow for more!

TARGET REACHED ON 7010A trade I shared to the public at the same time I gave it to my clients have reached the target a month ago.
A trade that lasted for 2 month with a return of 300% of the amount invested.
These are the kind of the trades I give to my clients to make them satisfied of my service and make them safely invest and learn.
Follow for more!

2222 IS STILL GOING DOWN | DONT BUYSince the beginning of the year, I been posting about 2222 that it will keep pusing lower and lower, however, as usual people who thinks we are just posting for views don't listen and buy lose their money and search for how to recover.
If you're reading this and you still haven't bought on 2222, don't do it since the price is still going lower and lower, you can ask me about the stocks to buy and I'll give them to you, just don't rush and throw your money in the river.
The comment section is all yours!
Follow for more!

DONT BUY 1120 YETSome days ago, I posted not to buy 1120, and still some of you texted and argued about it, if you really are an investor you won't just throw your money away on Stocks.
However, you will get a consultation to know how the movement of the market is, how the market is reacting to the level it is in... which is the real purpose of consultations, not taking your money from you as some think.
Well, now on 1120 don't make any stupidity buying, you still need to wait until the price comes lower to give us an entry that we can follow to make the right decision.
For further questions, don't hesitate to ask!
Follow for more!

2P 7204it is on down trend reaching point of interest.
this POC is strong and might come back to hit the target. I used volume profile with wedge

Bullish 4262 LumiLumi shows a strength after good quarter report. D shaped formed and this is a sign of bullish
resistance at 84SR

8200 Insurance company The stock with ticker 8200 on the Saudi TASI appears to be experiencing significant trading activity, as indicated by the high volume at the top of its recent price movement. High volume often signals strong investor interest, which can be due to positive news, earnings reports, or market speculation. However, after reaching a peak, the stock is now retracing and approaching the 47 SAR level.
This pullback to 47 SAR could indicate a key support level, where buyers might step in to stabilize the price. If the 47 SAR level holds, it could serve as a foundation for a potential rebound. On the other hand, if the stock breaks below this level, it may signal further downside, potentially testing lower support levels.
Investors should monitor the stock's behavior around the 47 SAR level closely, as well as any news or developments that could influence its direction.


8200Hello traders,
I'm looking for opportunity to re-enter this stock this week.
There is no criteria in daily chart help to decide buying it, but when I look to 1-H chart it looks like a fakey pattern.
I will depend on the first opening hour next week to decide waiting till 46-47, or buying it.
this week I will stary buying it.
Good Luck for all

1810 Seera GroupHello traders,
I'm looking for opportunity to re-enter this stock this week.
It's clear it target 26.8
Good Luck for all

8280 LivaHello traders,
I'm looking for opportunity to re-enter this stock.
this week I will stary buying it.
Good Luck for all

#3090 #Tabuk CementBased on the pattern identified on the weekly chart, a bullish flag pattern is currently forming. This suggests a continuation of the previous upward trend. Given the characteristics of the pattern, we can plan entries on a medium to long-term timeframe by closely monitoring the identified levels on the chart. Entries only a breakout.
"Non financial advice, do your own research"

at Resistance Zone but Bullish..Currently at an Important Resistance zone.
Once this Resistance is Broken, we may witness 170+

Stock is in Uptrend.Stock is in Uptrend.
0.382 fib retracement done around 36-37.
Crossing & Sustaining 49 may lead it towards 54 - 55.
Current level may act as Support.
However, Bearish Divergence is there, so better to
wait for Crossing 49.
Rectangular Box + Previous HL is around 32.80 - 33
that should not break in any case, otherwise
Trend Reversal is Possible.

SAUDI ARAMCO is BullishPrice was in a strong downtrend, however it seems that bears are exhausted and price is ready for a take-off from here. Bullish RSI divergence has emerged on both daily and weekly time frame, hinting the control of bulls. If previous lower high is broken successfully, then we can expect a bullish reversal as per Dow theory. Targets are mentioned on the chart.

Elm (TADAWUL: 7203) – Key Gann Levels in Play!Elm has been on a rollercoaster ride, experiencing a strong uptrend before hitting resistance and pulling back. The stock is now trading around 1,059 SAR, testing a key 360° Gann level at 1,015 SAR. So, what’s next? Let’s dive in!
Could be the scenario ;)
🔍 Technical Breakdown:
🔹 Resistance Levels:
1,181 SAR (405° Gann level) – A key zone that previously acted as resistance.
1,359 SAR (450° Gann level) – Breaking above this could restart the bullish trend.
🔹 Support Zones:
1,015 SAR (360° Gann level) – Crucial support currently being tested. A hold here could trigger a bounce.
862 SAR (315° Gann level) – Next potential support if selling pressure continues.
🔹 Trend Analysis:
The stock had a massive bull run before topping out and now seems to be in a correction phase.
If bulls defend 1,015 SAR, we might see another upside attempt.
🎯 Potential Scenarios:
🟢 Bullish Case:
Holding 1,015 SAR could lead to a retest of 1,181 SAR and, if momentum continues, a push towards 1,359 SAR.
🔴 Bearish Case:
A break below 1,015 SAR could signal further downside towards 862 SAR and possibly lower.
⚠️ Key Takeaway:
Elm is at a make-or-break level! Will bulls step in at 1,015 SAR, or is more downside ahead?
💬 What’s your outlook? Share your thoughts in the comments! 🔽🔥
#Elm #TADAWUL #StockMarket #GannAnalysis #TechnicalAnalysis

Saudi Arabian Amiantit Co (2160) - Trade Idea📌 Saudi Arabian Amiantit Co (2160) - Trade Idea
📊 Market Behavior:
Price always follows one of two paths:
1️⃣ Offering Fair Value – Where price stabilizes and attracts buyers/sellers at a justified level.
2️⃣ Seeking Liquidity – Where price hunts stop losses, liquidates positions, and manipulates emotions.
🔥 Current Phase:
Right now, the market is in a liquidity-seeking phase 🏃♂️💨, where it is:
✅ Shaking out weak hands (retail traders getting stopped out).
✅ Creating a manipulation leg (to trap traders before a reversal).
✅ Grabbing liquidity from key levels (before moving towards fair value).
🎯 Main Target:
🚀 The Yearly Fair Value Gap (FVG) is the ultimate target, where price is likely to rebalance and provide high-probability trading opportunities.
⚠️ Key Takeaways:
🔹 Expect volatility – market makers are engineering liquidity.
🔹 Stay patient, avoid emotional reactions.
🔹 Smart money moves in phases – follow the narrative.
💡 Execution Plan: Wait for confirmation before entry, align with smart money, and target high-probability zones! 🎯🔥
📈 Trade Smart, Stay Ahead! 💎🚀
