Agility in Arabic in 4 dimensions Hope this explanation crystal clear for you guys! your comments would be highly appreciated now we facing current strong support Volumetric Block Orders Targeting higher resistance will be update once we reach our targets successfully!


NIND: Buy ideaBuy idea on NIND as you see on the chart because we have the breakout with force the vwap indicator and the ressitance line by a big green candle with a large green volume.Thanks.

Beautiful Respecting of VOBA beautiful Previous Volumetric Order Blocks Respecting and re-test of these VOB .
Always a larger time Frame gives the true direction !

OoRedOo And the 101 LessonA Beautiful Visualization how Previous Volumetric Block Orders and Liquidity Grab Candles (highlighted in Blue & Red) acts as Strong Support and Resistance Levels now in case price passes the current Volumetric Block Order it will go next.
How to play around this!
101 lesson: NEVER make trade decision inside Volumetric Block Orders since it ONLY! belong to market makers just wait, the chances for trader to lose his trade inside these zones pretty much high! for now wait the price to settle and never make trade like rookies traders,
This What I Call IT! " SMART MONEY! " V.S " DUMB MONEY! "


KFH: AnalysisOn KFH as you see on the chart we are in an uptrend so we will have a big probability to have a continuation of an uptrend if only if we have the breakout with force the resistance line by a big green candle with a large green volume. But, in other hand we will have a downtrend if we have the breakout with force the vwap indicator and the support line by a big red candle with a large red volume.Thanks...


Correction and then launchThe stock is currently in a correction phase near the shaded area, including a rise to make a larger and final historical peak before the next major collapse.

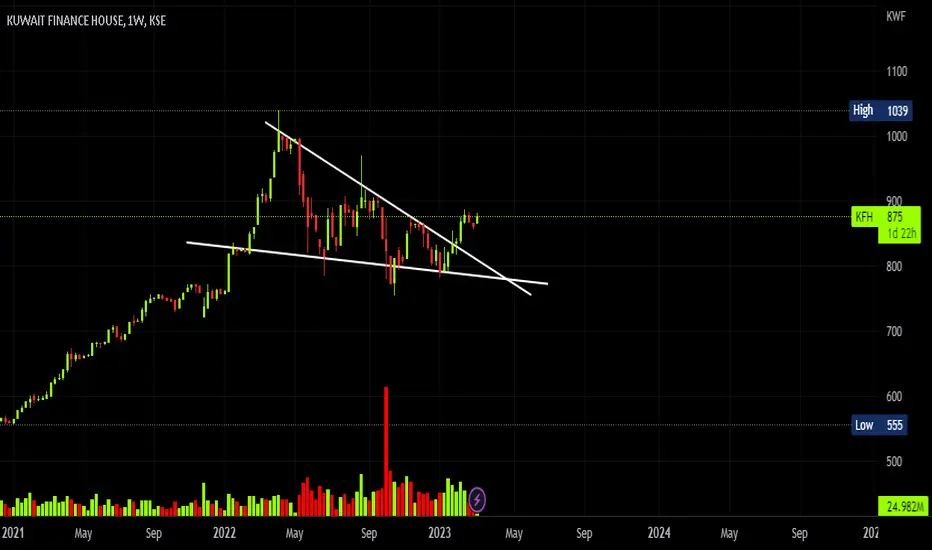
KFH weekly down trend rectangle patternKFH weekly down trend rectangle pattern (and descending triangle)
if it's breakdown 702, then break 685 confirmation the first target 650, Second target ~ 620


KFH KFH - weekly chart
I see we are in wave 4 (A) and we will rise with B wave then C
after that we will go huge money with wave 5 broken the 1000 :P

BURG: Sell ideaOn this action we can note that after the breakout of the vwap indicator we notice small candles with small wicks and small bodies making spring effects on the vwap. In addition, we also have the break of the support line by the sellers with a significant red candle and also followed by quite significant red volume as well thus confirming their supremacy over the buyers. Thank you.!

NBK: Sell ideaOn NBK as you see on the chart we have a sell idea because we have the breakout with force the vwap by a big red candle with a large red volume.Thanks!

Quick analysis on BURGAN BANKGood afternoon dear Kuwait inverstors!
I saw people on a group arguing on whether they buy BURGAN BANK stock or no, I made this analysis to share my thought with you.
You can see on the chart that the price kept going down on a channel for the past 9 years, Aug 2022 it did what we call a squeeze on the system I follow. Currently, the market is consolidating and we'll be waiting for it to break the channel to see if you must buy the stock or no.
For more questions on any market you want don't hesitate to ask and I'll be answering with pleasure!

TIME TO BUY KUWAIT FINANCE HOUSE STOCKSI sold this analysis to a custommer 3 weeks ago and after getting his autorisation to share it with public here I am sharing it.
Dear investors, as you can see on the chart the price broke the golden point after pulling back on the resistance 3 times to continue its way up.
What's stopping for not buying KFH !
For more questions don't esitate to ask
JZEERA: Buy ideaAs you see on the chart we have a buy idea because we have the breakout of the vwap indicator with force.Thanks!

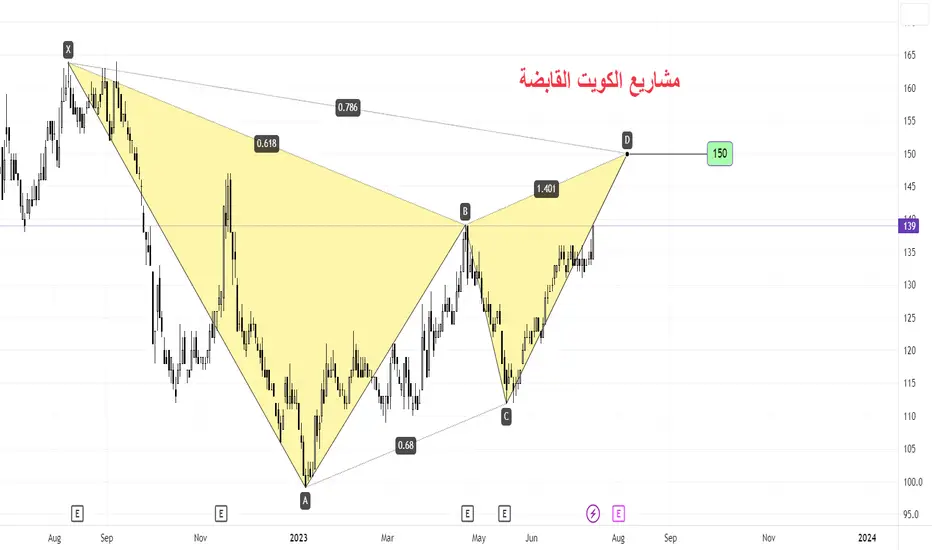
Harmonic Shark Pattern on ALOLA First InvestmentHarmonic shark pattern detected on ALOLA First Investment heading to 101 and 130 Fils levels. Stop loss should be below the last low on the chart.


