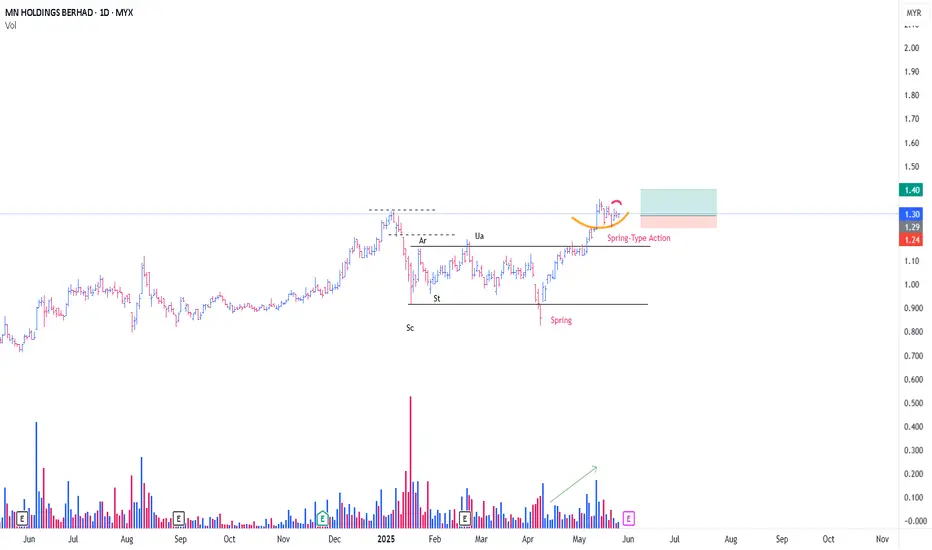
MNHLDG GOING TO CONT MARK UPI maintained my previous thesis for MNHLDG
**please refer to my previous
Just need an addition, for the formation of new 'Local Spring' *black color word
i was knocked out on last position for this
market environment dragged MNHDLG despite with a positive surrpise earning
Based on Spring Setup,
looks like Test Of The Spring success at the moment
i initaited position as attached with tight cut loss
PureWyckoff

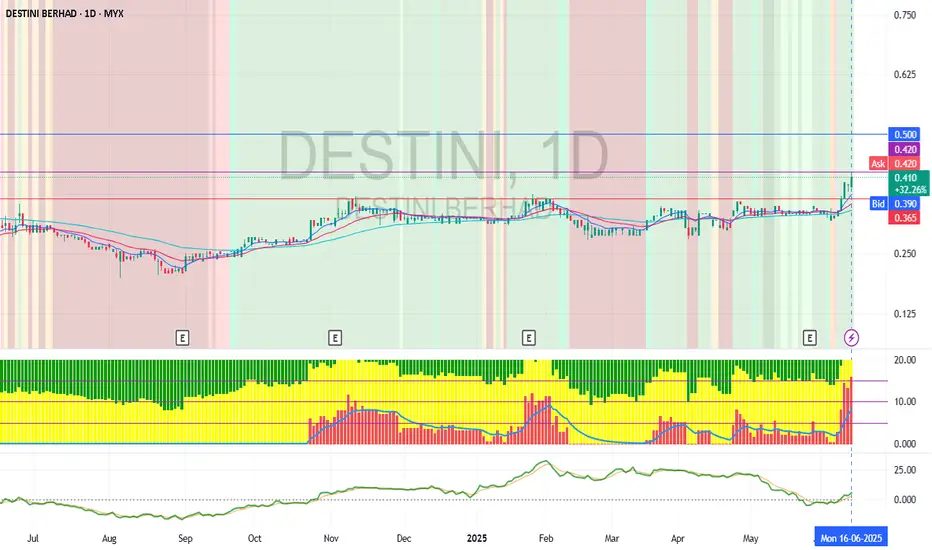
Will Destini change to uptrend Technically we can see that Destini has a breakout and an uptrend. It is trying to change the trend, and will it stay uptrend for a longer period? Let us watch. SL: 0.365 BO: 0.465 TP: 0.5
Dialog follow the sentiment trendSL: 1.48 BO: 1.67 TP1: 1.91, TP2: 2.01. All the oil-related fields are following the trend because the war has broken trade with caution and for a short time only.

Hibiscs BDTLHibiscs just BDTL today, following the sentiment of war and trying to BDTL, and we dont know until when the price is following the trend. The best thing to do is to make it a short-term trade at the moment. SL:1.62 BO:1.9 TP1:2.14 TP2:2.57

Deleum will ride the sentimentFrom the sentiment of war from the Iran and Israel the commodities of oil and gold will rise because of the fear and supply has been reduced.The chart shows that deleum has breakout from sideways and will follow the sentiment trend at the moment. SL:1.55 BO:1.69 TP:1.9

TELEKOM MALAYSIA going to rm8based on research report by
2025-06-13 TM
TELEKOM MALAYSIA BHD
6.60 8.15 +1.55 (23.48%) BUY RHB-OSK
now retracing to 0.618
predicting that it will go for the third wave untul 1.618 at RM8

SUNWAY GOING MARK UPFor Sunway, This is an Atypical Re-ACcmulation Schematic #1
-I maintained my prev hypothesis
(Position triggered Stop Loss Level, probably i was too early for this)
*refer my prev post
I view sunway as a Top Competitor, which my no.1 pick would be Gamuda (Refer my prev post)
-Both of which are Insti. Fav
As for the dropping in earnings, the technical side is too beautiful to ignore
Formation of Feather's Weight (Blue LIne)
Along with Possible SpringBoard (Red Line) in action
Would be good sign, if today & upcoming Bars/Candlesticks, succesfully closing above the suply
on 10/6/25 (Red Arrow)
Position initiated with very tight Risk
PureWyckoff


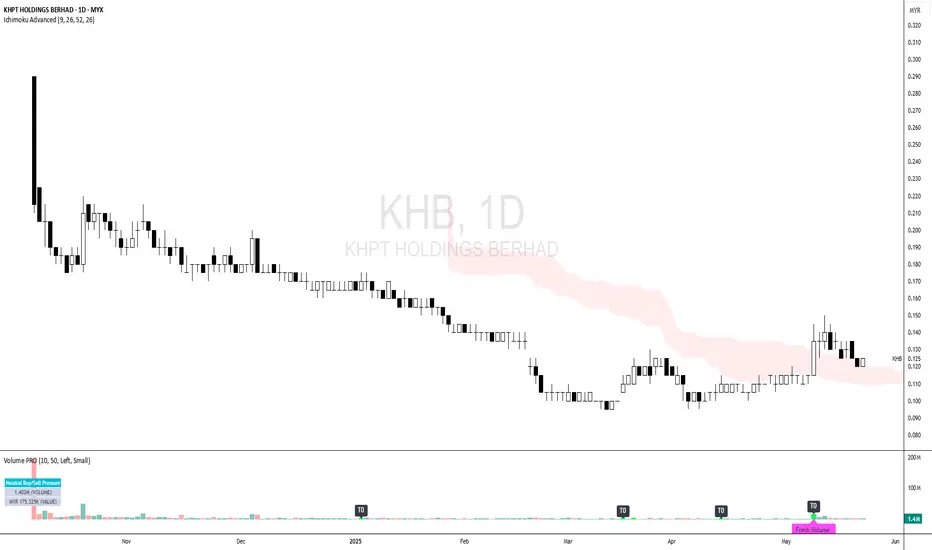
KHB - Downtrend Phase is FINISHED ?KHB - CURRENT PRICE : RM0.125
KHB was in downtrend since its listing day on 08 OCTOBER 2024. Recently the stock price rise with a bullish candlestick on 09 MEI 2025. The stock is making higher high and higher low. This indicates that the downtrend may end. At current price, it gives an attractive RISK REWARD RATIO.
ENTRY PRICE : RM0.125
TARGET PRICE : RM0.140 (+12%) and RM0.150 (+20)
SUPPORT : RM0.115 (-8%) --- The low of long white candle
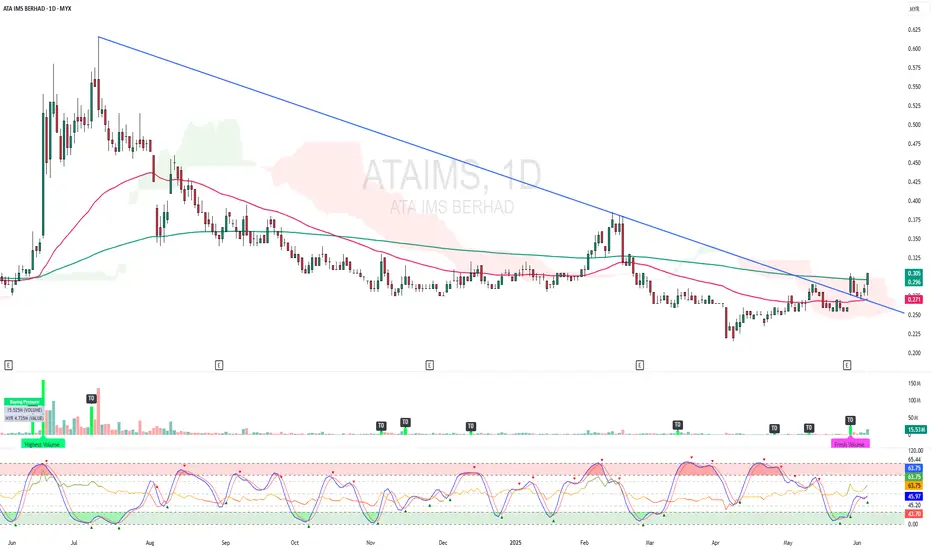
ATAIMS - BREAKOUT EMA 200 and CLOUD !ATAIMS - CURRENT PRICE : RM0.305
ATAIMS is bullish as the price is above EMA 50 and 200. The stock broke above EMA 200 and ICHIMOKU CLOUD on last FRIDAY (06 JUNE 2025) with high volume. Supported by technical reading in RSI heading upward, the stock may continue to move higher in the upcoming session.
ENTRY PRICE : RM0.300 - RM0.305
TARGET PRICE : RM0.340 and RM0.370
SUPPORT : RM0.270
RAMSSOL MARKING UPA rising bottom type of re-accumulation
With the influx of demand (Red Arrow)
Followed by very short term SpringBoard (4/6/25, Black Arrow)
- #1 Springboard, absoprtion Type
**Atypical Type of Springboard
position initiated today based on the Trigger Bar with a very tight risk
Purewyckoff

SCGBHD WILL CONTINUE MARKING UPThis is just a continuation from my previous trading idea for SCGBHD
**Refer below
I was liquidated from the position yesterday
Now, looks like at the minimum, i was too early for this stock previously.
With the formation of Spring-Type Action ,
And the On-Going absoprtion especially supply from 28/5 (Black arrow)
I initiated my position as attached
PureWyckoff

TANCO: Is correction wave is coming? Elliott Wave Count - Impulsive Phase
Wave (1): Begins from the breakout in mid-2023, this early-stage portrays institutional accumulation.
Wave (2): A sharp corrective retracement—likely a zig-zag—testing the conviction of early entrants.
Wave (3): The strongest and most extended wave, characterized by increased volume and price acceleration (a classic signature of a third wave).
Wave (4): A complex sideways correction that found support near a previous resistance-turned-support zone.
Wave (5): Final leg up, shows signs of weakening momentum and potential exhaustion—divergences can likely be spotted on RSI or MACD.
Elliot Wave Correction Wave Phase
Wave (A): Initial sell-off that breaks the parabolic uptrend line—often fast and steep.
Wave (B): A deceptive bounce that retraces some of Wave A but typically lacks conviction.
Wave (C): A final capitulation leg, often equal or larger than Wave A in depth—projected to target RM0.69 area.
Chart pattern possible formation: Head & shoulders formation, with the neckline sitting approximately at RM0.69. This pattern often aligns with Wave C's completion and acts as a major structural pivot.

GAMUDA CONT MARK UPThis is a continuation of my prev post
**Refer link below
In Wyckoff Methode , The Formation of BUEC is a sign that further price advancement will continue
to the phase E (Marking up outside the Trading Range)
The BUEC in this formation, coincide with a Local Spring
On Top of that, with a Feather's weight & Springboard in it
With a Trigger Bar today, position initiated as attached
PureWyckoff


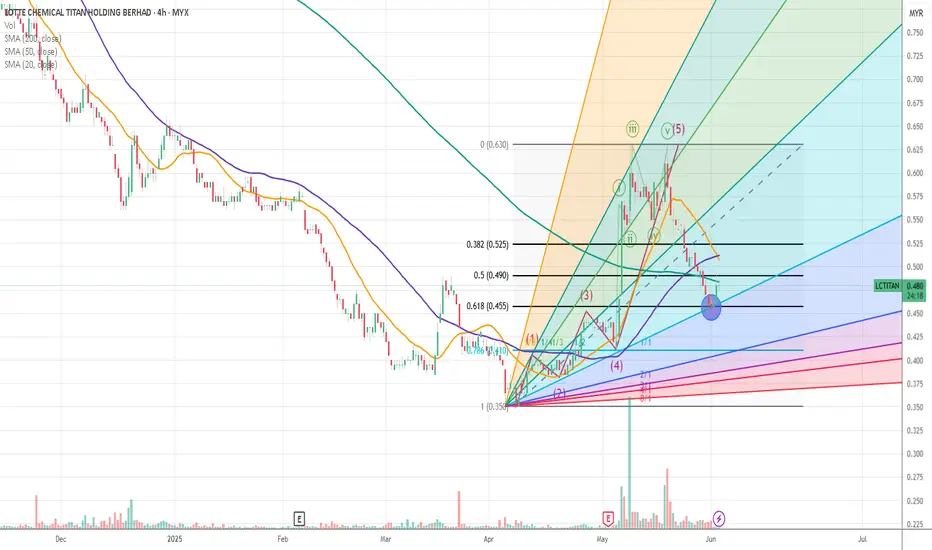
LCTITAN retrace 2nd wave before SUPER 3rd waveretracement happens at 0.618
got volume spike after earnings announcement
quarter loss is improving, likely will turn to black (profitable) next quarter
we'll see whether will follow gann fan or not
SCGBHD TO CONT MARK UPThis is a continuation trade idea from my prev post
***refer to link below
Since the BUEC , Price advancing for about 45%..
Not qualified for a Power Play by the way
**(Or can consider Semi Power Play)
With a formation of Feather's Weight (Red Line)
SpringBoard sign prompted me to initiate position as attached
Tight Risk
PURE WYCKOFF

CAPITALA to add or enter after 0.94using gann fann, it seems that it is currently at upper border
price currently retraced at 23.6% an uncommon level
for this stock, i will wait and see

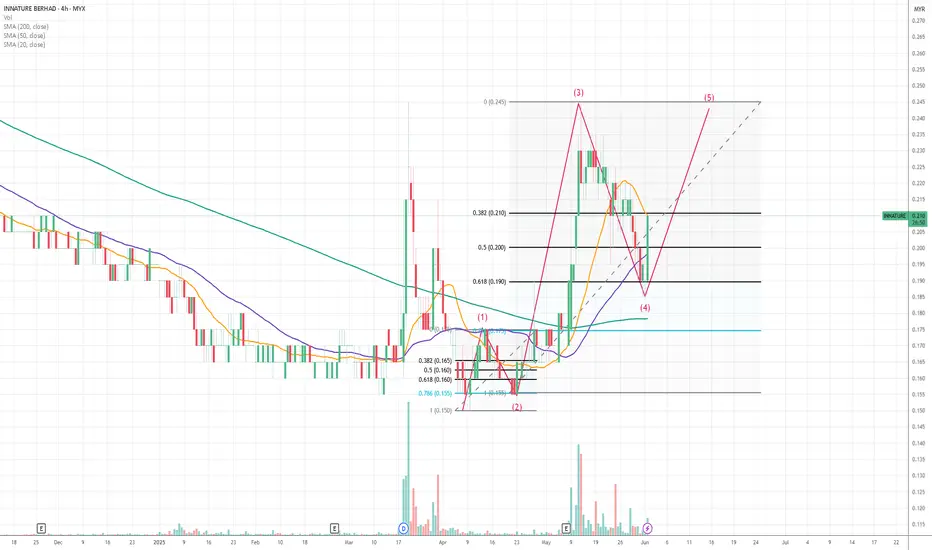
INNATURE creating 5th wave2nd wave retraced at 78.6% while
4th wave retraced to 61.8%
now forming the 5th wave that can be either same or truncated or maybe elongated (extended)
MNHLDG CONT TO MARK UPA rare schematic, of Type #1 Accmulation
This is a Power Play
-Since Spring, price soaring high with influx of demand (Green Arrow)
With a Possiblity of Feather's Weight ( Yellow LIne)
-Position initiated @ Spring Board (Red Line)
-Plus with additional Local Spring Type Action
Position intiated as attached
Tight Risk
PURE WYCKOFF
NATGATE - Attractive RISK REWARD RATIO ?NATGATE - CURRENT PRICE : RM1.57
On 08 MAY 2025, the stock made a small gap up and closed higher at RM1.58 - with high trading volume. From there the share price rises few days and touched intraday high at RM1.81 on 15 MAY 2025.
Then the stock retrace and now it bounced from the small gap zone. The small gap zone may acts as strong support level. At the same time, there is also EMA-50 support. STOCHASTIC OSCILLATOR shows an oversold situation (which indicates rebound may happens in near term) while RSI is still above 50 (BULLISH).
At current moment this trade gives an attractive RISK REWARD RATIO. My entry price will be RM1.55 - RM1.58.
For target price, there are two strong resistance.
1. EMA 200
2. The high of LONG BLACK CANDLESTICK (03 MARCH 2025 candle)
One of my trading technique is I would take profit one or two bids below the actual RESISTANCE LEVEL. As such, my 1st target for NATGATE will be RM1.73 (below EMA 200) and 2nd target is RM1.85 (below actual RESISTANCE RM1.87 - The high of 30 MARCH 2025 long black candlestick).
ENTRY PRICE : RM1.55 - RM1.58
TARGET PRICE : RM1.73 and RM1.85
SUPPORT : RM1.50
Notes : Please be aware also that the company is going to announce its QUARTER EARNINGS approximately end of month.

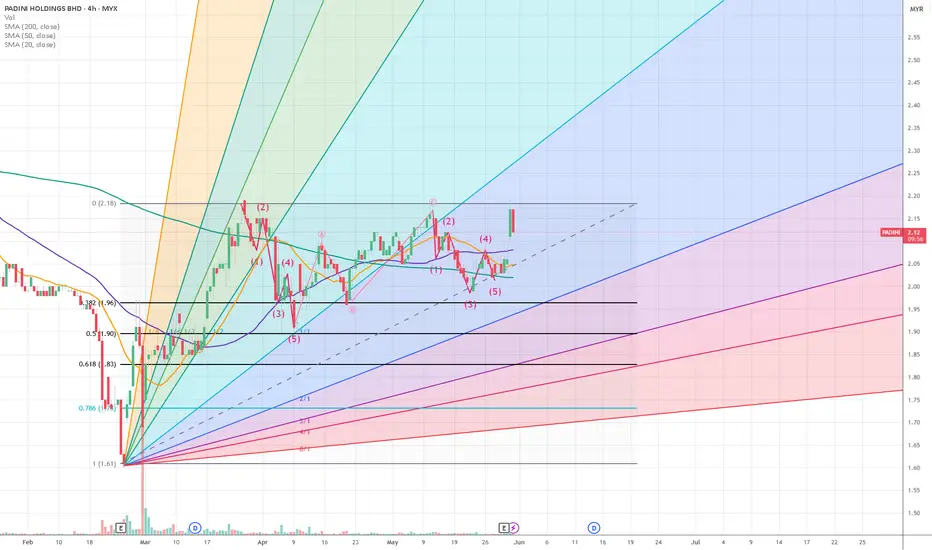
PADINI is moving to 3rd wavealready retraced to 0.5 level during retracement of 2nd wave
tried to calculate the wave ... seems like ABC correction of 5-3-5 already finished
will give dividen albeit a bit lower than previous
but still a good fundamental company