ARMADA WAITING BREAKOUT AND GOOD VOLUMEThis Weekly FORECAST
Opportunity for ARMADA. This setup is my trading idea/plan, if you want to follow: trade at your own risk (TAYOR).
Risk Factors:
1. Market conditions, unexpected news, or external events could impact the trade.
2. Always use risk management strategies to protect your capital.

NOTION AT WATCHLISTThis Weekly FORECAST
Opportunity for NOTION. This setup is my trading idea/plan, if you want to follow: trade at your own risk (TAYOR).
Risk Factors:
1. Market conditions, unexpected news, or external events could impact the trade.
2. Always use risk management strategies to protect your capital.

CTOS COUNTER TO SEE AND STUDYThis Weekly FORECAST
Opportunity for CTOS. This setup is my trading idea/plan, if you want to follow: trade at your own risk (TAYOR).
Risk Factors:
1. Market conditions, unexpected news, or external events could impact the trade.
2. Always use risk management strategies to protect your capital.

DIALOG WAITING FOR BREAKOUT AND VOLUMEThis Weekly FORECAST
Opportunity for DIALOG. This setup is my trading idea/plan, if you want to follow: trade at your own risk (TAYOR).
Risk Factors:
1. Market conditions, unexpected news, or external events could impact the trade.
2. Always use risk management strategies to protect your capital.

MY: CloudPoint Analysis 31.12.24Technical Analysis shows in uptrend inside parallel channel. Looking upside with TP 1.00 with Entry at 0.93.
Disclaimer: Not a Buy / Sell. Please do due diligence before entering any trades. Investing in high-risk instrument can incur partial or full loss. Traders' discretion involves subjective decision-making and carries inherent risks, and past performance is not indicative of future results; always conduct your own research and seek professional advice before making any trading decisions.

DAYANG STAGES PATTERNWhen it comes to bear market, we have to see what the price will move.
Just predict based on technical analyst .
Dayang i just want to add for my watchlist.

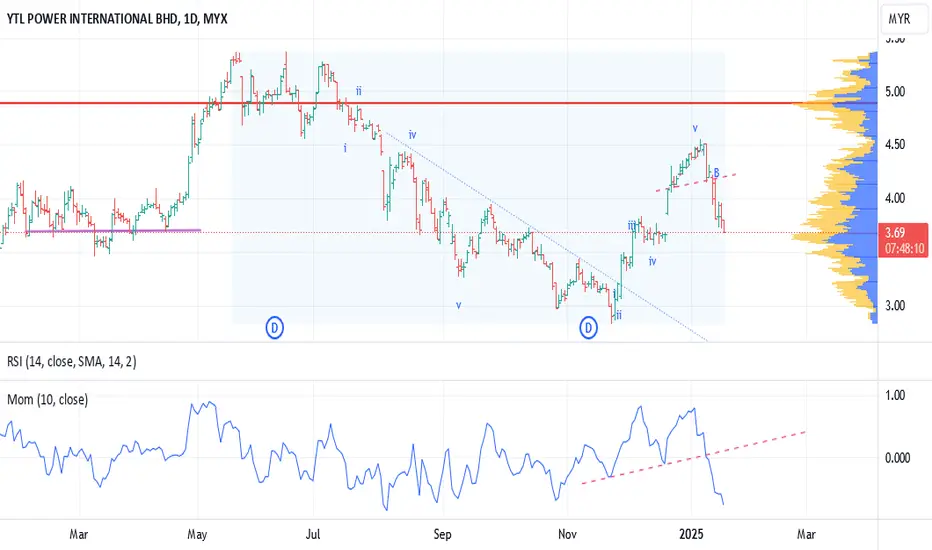
YTL Power finished its wave 5YTL Power completed its wave 5 and is in a correction mode. Its target seems to be covering the gap

Simple13 Trading IdeaTo me, NationGate remains one of the strongest tech stocks and a key player in the Data Center theme. Despite the recent 20% drop from its peak, I see this as an opportunity rather than a concern.
📉 Current Situation:
The stock price has experienced strong selling momentum, likely driven by macro issues and profit-taking by traders.
This presents a potential buying opportunity, especially for those who believe in its long-term growth story.
📈 My Strategy:
1️⃣ First Entry:
At RM 2.20, which aligns with the Fibonacci 0.5 retracement support level.
2️⃣ Second Entry:
At RM 2.00, near the Fibonacci 0.618 retracement support level.
3️⃣ Additional Investment:
If the stock doesn’t fall to RM 2.00, I will add to my position near the trendline support.
💡 For New Investors:
If you don’t currently hold NationGate, this recent price drop might be a good entry point for investment or portfolio addition.
🔮 Why I’m Optimistic:
I believe NationGate’s fundamentals remain strong, and its future growth prospects in the tech and data center industries are solid.
The current pullback is temporary and largely influenced by external factors.
Disclaimer: This is not financial advice. Conduct your own research before making investment decisions. MYX:NATGATE

MICROLNLong Term 1 year invesment
return roi 299%
best entry 0.230
daily above ema7 & 21
weekly beautiful candle ema 7 & 21
inprogress golden cross ema7 & 21
must closed candle gap down at 0.505 TILL 0.530
52wh 0.900 ath 1.130

UUE - Looking for a bullish continuationN wave with E, V, N & NT projection.
The price is above the Kumo, indicating a bullish trend.
The Tenkan-sen is above the Kijun-sen, suggesting bullish momentum.
Chikou Span is above the price candles, supporting the bullish outlook.
The price has formed a higher low (A to C), signaling an upward trend.
A breakout above point B would confirm the N wave continuation.
Currently, the price is trading near 0.815, close to resistance but still supported by the NT level at 0.790.
Immediate support is at 0.790 (NT level).
Resistance levels are at 0.860 (N), 0.900 (V), and 0.930 (E).
Enter a long position on a confirmed breakout above 0.820 (previous swing high) with strong bullish momentum and volume.
Place a stop-loss below 0.790 (NT level) or the Tenkan-sen for tight risk management.
Volume: Watch for increasing volume during the breakout for confirmation.
Risk Management: Adjust position size according to the stop-loss distance and risk tolerance.
Trend Reassessment: If the price falls below 0.760 and the Kumo, reassess the bullish bias.

MAHSING - BULLISH HAMMER CANDLESTICK ?MAHSING - CURRENT PRICE : RM1.81
MAHSING is bullish as the share price is above 50 and 200 days EMAs. After declining for two days, today the stock made a bullish hammer candlestick. This scenario may indicate that potential bottom had reached. Aggresive trader may decide to buy on this hammer candle.
ENTRY PRICE : RM1.79 - RM1.81
TARGET PRICE : RM1.92
SUPPORT : RM1.74 (the low of hammer candle)
Notes : MAHSING forged key partnerships with Bridge Data Centres (BDC) to drive the development of state-of-the-art data centre facilities. The Mah Sing DC Hub@Southville City, Bangi currently holds 300 MW of secured power capacity, with an additional 200 MW earmarked for future collaborations, solidifying its role as a major regional data centre hub.

NOTION will rebound from 0.382?Looking at the chart for Notion VTec Berhad, here's my analysis:
Current Price Action:
- Trading at RM1.25, down 0.97%
- In wave iv of a larger Elliott Wave structure
- Price finding support at key Fibonacci levels
Elliott Wave Analysis:
- Completed waves i through iii
- Currently in wave iv correction
- Wave v target projected around RM1.45
Key Technical Levels:
1. Support:
- Major support at RM1.09 (0.618 Fibonacci)
- Secondary support at RM1.00 (0.786 Fibonacci)
- Critical support at RM0.870 (wave i low)
2. Resistance:
- Immediate resistance at RM1.23 (0.382 Fibonacci)
- Major resistance at RM1.45 (wave v target)
- Trend line resistance around RM1.35
Key Points:
- Price bounced from RM1.16 support level
- Moving averages beginning to turn upward
- Volume showing potential accumulation phase
- Trading within an ascending channel
Trading Considerations:
- Wave iv appears to be completing
- Stop loss could be placed below RM1.16
- Risk/reward favorable for wave v setup
- Watch for break above RM1.23 for confirmation

MYEG will be Sideways for a whileLooking at the chart for MY E.G. Services Berhad, here's my analysis:
Current Price Action:
- Trading at RM0.965, up 0.52%
- Currently in a complex corrective pattern
- Price consolidating above moving averages
Elliott Wave Analysis:
- Completed waves (i) through (iv)
- Currently in wave (v) with ABC correction
- Key levels:
* Wave (a) support at RM0.930
* Wave (b) resistance at RM0.975
* Wave (c) target potential at RM0.940
Technical Levels:
1. Support:
- Strong support at RM0.930 (0.382 Fibonacci)
- Secondary support at RM0.870 (0.618 Fibonacci)
- Moving average support around RM0.950
2. Resistance:
- Immediate resistance at RM0.975
- Major resistance at RM1.00 (psychological level)
- Previous wave high at RM0.990
Pattern Analysis:
- Forming a complex correction pattern
- Higher lows indicating underlying strength
- Volume profile showing accumulation
Trading Considerations:
- Watch for break above RM0.975 for bullish confirmation
- Stop loss could be placed below RM0.930
- Risk/reward favorable for long positions
- Volume increasing on recent moves

HARTA finished making wave 4?Looking at the chart for Hartalega Holdings Berhad, here's my analysis:
Current Price Action:
- Trading at RM3.65, up 3.40%
- Recently pulled back from wave iii peak
- Price holding above key moving averages
Elliott Wave Analysis:
- Completed waves i through iii
- Currently in wave iv correction
- Wave v target projected around RM4.08
Key Technical Levels:
1. Support:
- Strong support at RM3.54 (0.382 Fibonacci)
- Secondary support at RM3.39 (0.5 Fibonacci)
- Critical support at RM3.23 (0.618 Fibonacci)
2. Resistance:
- Immediate resistance at RM3.76
- Major resistance at RM4.08 (wave v target)
- Previous high around RM4.00
Financial Events:
- September 2024: MYR-14.633M (-152.96%)
- June 2024: MYR27.628M (+223.48%)
- March 2024: MYR-22.374M (-68.23%)
Trading Considerations:
- Wave iv correction appears nearly complete
- Volume profile supporting potential reversal
- Risk/reward favorable for long positions
- Stop loss could be placed below RM3.39

GCB wave 3, should enter before thisLooking at the chart for Guan Chong Berhad, here's my analysis:
Current Price Action:
- Trading at RM4.11, up 5.12%
- Currently in an uptrend following bottoming pattern
- Price above all major moving averages
Elliott Wave Analysis:
- Completed waves i through iv
- Currently in wave v of the upward move
- Potential target around RM4.32 (wave v projection)
Key Technical Levels:
1. Support:
- Strong support at RM3.68 (0.382 Fibonacci)
- Secondary support at RM3.48 (0.5 Fibonacci)
- Critical support at RM3.29 (0.618 Fibonacci)
2. Resistance:
- Immediate resistance at RM4.26 (recent high)
- Major resistance at RM4.32 (wave v target)
- Previous high around RM4.40
Financial Events:
- September 2024: MYR-436.425M (-6.41%)
- June 2024: MYR-410.132M (+40.40%)
- March 2024: MYR-688.184M (-129189.60%)
Trading Considerations:
- Strong upward momentum
- Volume confirming price action
- Risk/reward favorable at current levels
- Stop loss could be placed below RM3.68

MYEGThis Weekly FORECAST
Opportunity for MYEG. This setup is my trading idea/plan, if you want to follow: trade at your own risk (TAYOR).
Risk Factors:
1. Market conditions, unexpected news, or external events could impact the trade.
2. Always use risk management strategies to protect your capital.

NOTIONThis Weekly FORECAST
Opportunity for NOTION. This setup is my trading idea/plan, if you want to follow: trade at your own risk (TAYOR).
Risk Factors:
1. Market conditions, unexpected news, or external events could impact the trade.
2. Always use risk management strategies to protect your capital.

Ytlpwr, pullback in making?YTLPWR is showing a strong bearish signal as the RSI, MACD, and even the Moving Averages (MA) lines have all formed a death cross. This pattern suggests a high probability of further downward movement. Investors should remain cautious and closely monitor the next price actions to navigate the potential volatility ahead.
The markets took a sharp dive today, with the red wiping out the gains painstakingly accumulated over the past week. Amid the turbulence, the winners were predominantly the big players — those with deep pockets and steady strategies.
For the smaller players, it’s a sobering reminder that the market is not a place for pity but a battleground where knowing the rules and playing wisely are the keys to survival. In this high-stakes game, every move counts, and resilience often separates those who thrive from those who merely survive.
Disclaimer: The mentioned stocks are based solely on personal opinions for educational and discussion purposes only. There are no buy or sell recommendations. Trading involves financial risk, and you are responsible for your own decisions. The author shall not be responsible for any losses or lost profits resulting from investment decisions based on the information contained herein.

ANCOM Buy indicator. Swing trading idea.ANCOM financial healthy. . EBITA is positive over 5 years. MACD is on up trend. Up coming QR report is on 13 Jan 2025. Buy at 1.02. Profit taking at 1.10.

HAWK, still can fly?Currently, the price is trailing below both the Moving Average (MA) lines, which indicates a bearish trend.
The Relative Strength Index (RSI) and Moving Average Convergence Divergence (MACD) have also formed a death cross, signaling potential downward momentum.
Should the price dip below RM0.440, it could signal an even steeper decline and suggest a challenging market environment ahead.
We cannot control how much we win. But we can control how much we lose. Focus on what you can control!
Disclaimer: The mentioned stocks are based solely on personal opinions for educational and discussion purposes only. There are no buy or sell recommendations. Trading involves financial risk, and you are responsible for your own decisions. The author shall not be responsible for any losses or lost profits resulting from investment decisions based on the information contained herein.

SKYGATE testing MA200 and reboundLooking at the chart for Skygate Solutions Berhad, here's my analysis:
Current Price Action:
- Trading at RM1.03, up 6.19%
- Strong breakout from downtrend
- Price moving above all major moving averages
Technical Analysis:
1. Support/Resistance:
- Major support at RM0.900
- Stop loss level at RM0.130 (12.62% risk)
- Resistance around RM1.04 (recent high)
2. Trading Setup:
- Target price: RM1.26
- Risk/Reward ratio: 1.73
- Position size suggestion: 1538 shares
- Good volume confirmation on breakout
Key Financial Events:
- September 2024: MYR12.577M (+24.29%)
- June 2024: MYR10.119M (+170.49%)
- September 2024: MYR3.583M (-1032.07%)
Volume Analysis:
- Recent volume spike supporting breakout move
- Above average volume indicating strong buying interest
- Money flow indicator turning positive
Trading Considerations:
- Breakout from downtrend confirmed
- Moving averages beginning to turn upward
- Strong momentum with volume support
- Clear risk/reward parameters established

WASCO long time no seeLooking at the chart for Wasco Berhad, here's my analysis:
Current Price Action:
- Trading at RM1.15, up 8.49%
- Breaking out from recent consolidation
- Price testing key moving average resistance
Key Technical Levels:
1. Support:
- Major support at RM0.960 (recent low)
- Stop loss level identified at RM0.190 (16.52% below)
- Support zone around RM1.00-1.05
2. Resistance:
- Immediate resistance at RM1.15 (current level)
- Target price at RM1.51 (31.30% upside)
- Risk/Reward ratio: 1.89
Volume Analysis:
- September 2024: MYR109.098M (-30.54%)
- June 2024: MYR157.061M (+751.44%)
- Recent volume supporting breakout attempt
Notable Events:
- September 2024: MYR23.683M (-46.66%)
- March 2024: MYR101.085M (-2531.5%)
- Showing signs of business improvement
Trading Setup:
- Entry around current levels (RM1.15)
- Stop loss at RM0.960
- Target at RM1.51
- Position sizing suggestion: 1052 shares
