MI Technovation Trading IdeaTechnical Setup:
The stock previously rebounded from both the uptrend line and the Fibonacci 0.618 retracement level, indicating strong support.
However, if the uptrend line breaks, it could signal a weakening of the bullish trend.
Entry Strategy:
Buy MI Technovation shares in the entry zone between RM 1.74 and RM 1.90. This range offers a favorable risk-reward ratio based on historical support levels and Fibonacci analysis.
Profit Taking:
If the price rises to RM 2.75, take profit, as this is a potential resistance level. The upside from RM 1.90 to RM 2.75 represents a 44.7% gain.
Risk Management:
If the price drops below RM 1.74 or if the stock breaks the uptrend line, exit the trade to manage risk effectively. Breaking the uptrend line could signal a reversal in trend, adding to the sell rationale.
Risk-to-Reward Ratio:
The upside from RM 1.90 to RM 2.75 is about 44.7%.
The downside risk from RM 1.90 to RM 1.74 is about 8.4%.
With the potential of an uptrend line break as an additional risk factor, this strategy offers a solid risk-to-reward ratio of 1:5.3, making it a favorable setup.

KUB - Monitor for the price action.N wave with E, N, V & NT projection.
Price is hovering at the edge of down Kumo and Senkou-Span B (0.780) as an immediate resistance.
The Chikou Span crossing above the candle price showing a bullish signal.
Price needs to stay above NT level to keep the continuation of bullish momentum. Considering for entry at above NT level and failing to breakout this level could invalidate the setup.
R1 - 0.780 (Senkou-span B)
R2 - 0.790
S1- 0.765 (Senkou-span A)
S2 - 0.735
Note:
1. Analysis for education purposes only.
2. Trade at your own risk.

Engtex - Need strong momentum to for bullish sentimentY wave, target (E) within stipulated range.
Price just crossed Kijun-sen but still below Kumo indicating the bearish sentiment, though a potential reversal may be underway.
The Chikou Span is below the price and Kumo, signaling that the bearish momentum might still be in play.
After wave (C), the price has been consolidating. The recent upward momentum could push the price toward the Y wave target at (E).
R1 - 0.660
R2 - 0.670
S1 - 0.610
S2 - 0.600
A potential breakout above 0.640 could signal bullish momentum for a move toward the Y wave target at 0.660 to 0.670.
Given the price's position relative to the Kumo and resistance levels, a cautious bullish approach can be taken if the price breaks above 0.640. However, if the price fails to hold above the Kumo, the bearish sentiment may continue.
Note:
1. Analysis for education purposes only.
2. Trade at your own risk.

NATGATE - Potential Pullback on the Horizon?The stock has just closed above the key RM1.80 level, maintaining its position in line with the Hull Moving Average (HMA), suggesting some strength in the current trend. However, it's worth noting that the MACD remains in a downtrend (DC), signaling that momentum could still be weak. Investors should keep a close watch for any signs of a pullback, especially if the stock struggles to gain further upward traction.
It's crucial to not only know the right time to buy but, more importantly, to be ready and willing to sell when the time comes!
Disclaimer: Please be informed that all stock picks are solely for educational and discussion purposes; they are neither trading advice nor an invitation to trade. For trading advice, please consult your remisier or dealer representative.

Simple13 Short Term Trading Idea (KOSSAN)Current Price: RM 2.08
Profit Target: RM 2.30
Buy Zone: RM 1.95 - RM 2.08
Entry Strategy:
Start accumulating KOSSAN shares in the buy zone between RM 1.95 and RM 2.08. This range offers a favorable risk-reward ratio.
Profit Taking:
If the price reaches RM 2.30, take profit, as this area is considered a resistance level or the stock may be overbought, and it might be prudent to lock in profits. This translates to a potential upside of 10.6% from the current price.
Risk Management:
If the price drops below RM 1.95, exit the trade to limit losses. This sets the downside risk at approximately 6.3% from the current price.

VELESTO at SupportVelesto has come to the support zone. A potential zone to collect some of the shares.

SDS GROUP BERHAD
The stock is in a strong uptrend since mid-August 2024, as indicated by the series of higher highs and higher lows.
A noticeable increase in volume has occurred recently, supporting the upward price movement.
High volume in the last few sessions suggests strong buying interest, further validating the breakout above the previous resistance around MYR1.15.
Support: The previous resistance of MYR1.15 now acts as support. If price retraces, this level may provide some buying interest.
Resistance: The current price level of MYR1.23-MYR1.25 may act as near-term resistance, especially since the price has reached the upper Bollinger Band.
The recent candlesticks are relatively bullish, showing strong upward momentum.
Bullish momentum is strong, supported by increasing volume and the price trading above the moving average.
Caution may be warranted due to the price touching the upper Bollinger Band, which could lead to a short-term pullback or consolidation.
The MYR1.15 level is key support, while the MYR1.23-MYR1.25 zone could act as near-term resistance.

PEKAT GROUP BERHAD
The price action is moving towards the upper band, which could signify the start of a short-term bullish movement if the price breaks out above the upper band.
Price Action: After a significant rally in May, the stock retraced and found support near MYR0.85. This was followed by a period of sideways movement, indicating consolidation.
Resistance: The most immediate resistance is the upper Bollinger Band, near MYR0.95. A break above this could signify a continuation of the previous uptrend.
Support: The lower Bollinger Band near MYR0.88 and a key price level at MYR0.85 serve as immediate support.
Bullish Breakout: If the price breaks above the upper Bollinger Band and volume picks up, we could see a retest of previous highs near MYR1.00 or more.
Bearish Rejection: If the stock faces resistance at the upper Bollinger Band and fails to break higher, it could retrace back to the MYR0.88-MYR0.85 support zone.
Consolidation: If the price continues to move sideways within the Bollinger Bands, expect continued consolidation with reduced volatility until a breakout occurs.
Short-term: The stock is consolidating with reduced volatility. A breakout above the upper Bollinger Band could lead to another bullish leg.
Mid-term: The trend is neutral to slightly bullish, given that the stock remains above its 20-day moving average.
Support/Resistance: Immediate support is MYR0.88, while resistance lies near MYR0.95.

SOUTHERN CABLE GROUP BERHAD
The price is currently touching the middle band (20-day moving average) of the Bollinger Bands.
The upper band (resistance) around MYR0.92–MYR0.93 seems far from the current price, implying there is some room for upward movement.
The lower band around MYR0.75 acted as support during the previous downtrend.
A tightening of the bands suggests a period of low volatility, which could be a precursor to a breakout either to the upside or downside.
Volume on this uptick is relatively modest, around 4.08M, which indicates that the current upward movement may lack strong conviction. However, sustained increases in volume on the next few bullish candles could support a potential trend reversal.
Immediate Resistance: The first key resistance level is around MYR0.880, which coincides with recent highs and the upper Bollinger Band. A break above this would expose the stock to test levels near MYR0.92–MYR0.93.
Immediate Support: The stock is holding support around MYR0.800–MYR0.815, where buyers seem to have stepped in recently. A failure to hold this support could lead to a retest of MYR0.750, near the lower Bollinger Band.
A reversal pattern could be forming, especially if the stock continues to trade above the middle Bollinger Band and breaks above the 50-day SMA.
Bullish Signals: Holding above the middle Bollinger Band and potential moving average support could be early signals of a trend reversal. The next few sessions will be key to determining whether the stock can break resistance levels.
Bearish Risks: A drop below MYR0.815 could lead to a retest of MYR0.750, which may indicate continued bearish pressure.

KUMPULAN KITACON BERHAD
The price has recently touched the upper band, suggesting that the stock is experiencing upward momentum.
Over the last few sessions, the stock has shown a steady upward trend, with higher highs and higher lows.
The increased volume supports the upward movement and may indicate strong market participation.
Resistance: The next major resistance level can be identified near MYR0.785, which is the high of today’s session.
Support: As mentioned, MYR0.74 could act as a support level, followed by a stronger support around MYR0.70, which aligns with previous lows.
Bullish outlook in the short term, with momentum pushing the price towards the upper Bollinger Band. However, overbought conditions could lead to a pullback.
Watch the volume and price action around the MYR0.785 resistance. If the stock breaks this level with strong volume, further upside can be expected.
A reversal or correction might happen if the price gets rejected at the resistance or if it starts pulling back below the MYR0.74 support.

UNIQUE FIRE HOLDINGS BERHAD
Trend: The overall trend appears to be bullish in the medium term. After reaching a low in March, the stock has been making higher lows and higher highs, indicating an uptrend.
Moving Averages: The stock is currently trading above both the short-term (blue line) and long-term (green line) moving averages, which is typically a bullish signal. The moving averages are also sloping upwards, confirming the uptrend.
Support and Resistance: Key support levels appear to be around MYR0.320-MYR0.330, while resistance seems to be around MYR0.440-MYR0.455 based on previous price action.
Price Action: The stock has shown volatility, with several large candles both up and down. Recent price action shows a pullback from the August highs, but the stock seems to be finding support and potentially resuming its upward movement.
Momentum: While there was strong upward momentum from June to August, it has slowed recently. The current candle (green) suggests a potential resumption of bullish momentum.
Patterns: There's a potential cup and handle pattern forming from July to September, which if confirmed, could be bullish.
Overall, the technical indicators suggest a cautiously bullish outlook. The stock is in an uptrend but experiencing some consolidation. Traders might watch for a breakout above recent resistance levels as a potential entry point, while also being aware of the support levels for potential stop-loss placement.

FAJARBARU BUILDER GRP BHD
The price has bounced off the lower Bollinger Band, indicating the possibility of an oversold condition, and is now moving toward the middle band (likely the 20-day moving average).
Volume shows an uptick during this bounce, which is bullish, as it suggests that buyers are stepping in at this level.
Support: Around MYR0.380, where the price found a recent base.
Resistance: The immediate resistance seems to be around MYR0.420–MYR0.440 (the middle Bollinger Band and previous price action zone). Further resistance lies around MYR0.500 where the upper Bollinger Band currently resides.
Short-term bullish, with the potential for further upside as the price moves toward resistance levels.
Aggressive traders: May consider entering long positions near current levels, with a target around MYR0.440 and a stop loss below MYR0.380.
Conservative traders: May want to wait for a confirmed breakout above the 50-day SMA or middle Bollinger Band before entering a long position.

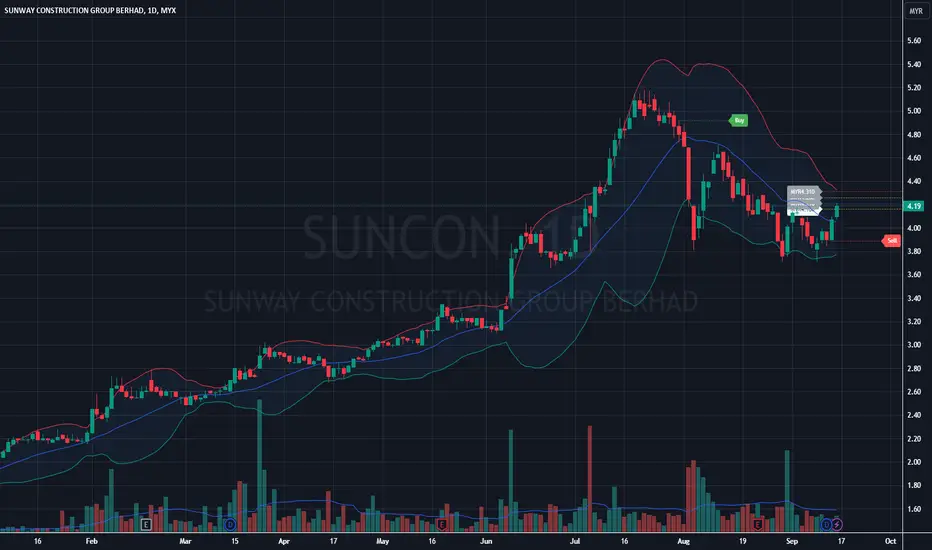
SUNWAY CONSTRUCTION GROUP BERHAD
Recently, the stock appears to be rebounding from the lower levels (around MYR4.00), currently trading at MYR4.19.
The current rebound shows the price nearing the middle band (which typically represents the 20-period moving average).
Support is observed around the MYR4.00 level, where the price has rebounded recently.
Resistance is likely to be around MYR4.40 to MYR4.50, the region of the middle Bollinger Band and the moving average.
Strong resistance is also seen at MYR5.20, the high from late July.
The stock is currently in a recovery phase after a significant correction. A break above the 50-day moving average and the middle Bollinger Band could signal further upside potential. However, the low volume during this rebound suggests caution. Traders may want to wait for a confirmation of increased volume and a solid break above key resistance levels for a stronger bullish signal.
MAGNA PRIMA BHD
Recent candles show consolidation with relatively small body candles, reflecting indecision. There are no clear bullish or bearish patterns in the last few sessions, which suggests the market may be waiting for a catalyst.
The most recent candlestick is a green one, indicating slight buying pressure. However, the small size suggests that buyers haven’t fully taken control yet.
The volume is relatively low during the most recent trading sessions. This low volume might suggest a lack of conviction from both buyers and sellers. A breakout accompanied by higher volume could be a strong signal for the next move.
Resistance: Around the MYR0.680 - MYR0.700 level, where previous candles touched the upper Bollinger Band but failed to break through.
Support: Near the MYR0.600 level, which aligns with the middle Bollinger Band and previous price bounces.
The stock is consolidating within the Bollinger Bands. Watch for a potential breakout either above the upper band (bullish) or below the lower band (bearish). A breakout with high volume would strengthen the signal.
The moving averages also indicate slight bullish momentum, but confirmation is needed, especially with more convincing volume and stronger candlestick patterns.

The stock is trying to recover after a downtrendBollinger Bands :
The price is currently near the upper Bollinger Band, which suggests a bullish sentiment.
Trend and Momentum :
The current upward movement might face resistance at RM0.60, which could act as a psychological or technical level for traders.
Support and Resistance :
Support: Around RM0.55 and RM0.50 appear to be strong support levels. Price bounced off from this area multiple times.
Resistance: The RM0.60 level is a significant resistance, as it has capped the price recently. A clean break above this level could lead to further upside, possibly testing RM0.64 (where there was a high in early July).
Outlook :
Bullish case: A close above RM0.60 with strong volume might push the stock toward the upper resistance levels at RM0.64 and higher.
Bearish case: A failure to break above RM0.60 could lead to a pullback toward the midline of the Bollinger Band (around RM0.58) or even lower.
Overall, the current chart is indicating a potential breakout attempt, but confirmation with volume and a sustained move above RM0.60 will be key to continuing the uptrend.
The short-term trend appears to be upwardBollinger Bands :
Middle Band: The price is above the middle band, suggesting bullish momentum in the short term.
Volume :
Recent volume is lower but steady, which shows no excessive buying or selling pressure.
Price Action :
Currently, the price is consolidating in a sideways range after the latest upward move, which may indicate a potential breakout or pullback.
Conclusion :
Bullish Bias: The price is trending upwards with support from the moving average, and it's currently near the upper Bollinger Band, so some profit-taking might occur soon.
Watch for Breakout: If the price breaks above the recent high (~3.40), there could be a continuation of the uptrend. However, if the price fails to sustain and drops below the middle Bollinger Band or the moving average, a pullback or correction could follow.
PMHLDG - Require a strong bullish momentumN wave with E, N, V & NT projection.
The price has slightly crossed above the down Kumo, which indicates a potential shift in momentum from bearish to bullish. However, this needs confirmation by staying above the key levels.
The Chikou Span crossing above the candle price is a bullish signal, showing that current price action is stronger than it was 26 periods ago, further hinting at a potential upward move.
NT level (0.395): This is the immediate resistance. A close and sustained price action above this level will confirm the bullish breakout. If the price closes above the NT level (0.395), it will confirm the bullish trend. A potential entry could be considered around 0.395–0.400.
The price needs to maintain its position above the NT level to confirm the continuation of bullish momentum. Any reversal below NT could invalidate the setup, so close monitoring is crucial.
Note:
1. Analysis for education purposes only.
2. Trade at your own risk.

The stock is in an uptrend on the daily chartCandlestick Patterns :
The price hit a high of MYR2.50 and closed at MYR2.48 (+3.33%) on the daily timeframe.
Bollinger Bands :
The price is currently near the upper band, suggesting potential overbought conditions. However, since the price is continuing to rise, it could signal a strong bullish trend if the price remains close to the upper band.
Trend Analysis :
The overall trend seems bullish as the price is making higher highs and higher lows. It’s supported by the price staying above the moving average.
A continuation of the uptrend would depend on the price breaking through the MYR2.50 level.
Possible Scenarios :
Bullish Case: If the price breaks above MYR2.50, the next potential targets would be the next psychological round numbers, such as MYR2.60 or higher.
Bearish Case: If the price fails to break the MYR2.50 resistance and falls below the moving average (around MYR2.25), it could signal a shift in momentum toward a correction or consolidation phase.

EVERSENDAI CORPORATION BERHADTrend :
Current Situation: The recent price action shows a slight rebound from the lows, with price pushing above the moving average.
Indicators :
Bollinger Bands : The price is currently touching the middle of the Bollinger Bands. This usually indicates that the stock is in a neutral zone after rebounding from the lower band. The upper and lower bands suggest a period of volatility expansion earlier, but currently, the bands are contracting, indicating a period of low volatility or consolidation.
Key Support and Resistance Levels :
Resistance: Around MYR0.60 (past peak levels from July and early August).
Support: Around MYR0.480 (recent low in early September), also aligning with the lower Bollinger Band.
Possible Scenarios :
Bullish Case: If the price continues to rise above the moving average and heads toward the upper Bollinger Band, breaking the resistance around MYR0.60, there could be a potential move higher toward MYR0.65 and beyond.
Bearish Case: If the price fails to sustain above the moving average and breaks below MYR0.50, it may retest the recent low of MYR0.480 or lower.

SENDAI - Analysis on potential of price movementY wave, target (E) within stipulated range.
The price is at 0.520, showing consolidation near a potential minor resistance zone after a short-term bullish reversal from the turning point (D).
The price has crossed Tenkan-Sen and Kijun-Sen but needs to stay above both lines to confirm continued upward momentum.
A possible entry can be considered if the price manages to break above 0.525 with strong volume, confirming a continuation of the bullish reversal. Ensure to wait for a clear break and close above this level. Watch for increasing volume and momentum as the price approaches the 0.525 level. Failure to break this level could lead to further consolidation or a potential pullback to the support at 0.500.
In summary, the market has the potential for a bullish continuation if it stays above 0.525, targeting the 0.595 and 0.610 levels. However, close attention to volume and price action is essential to confirm the move.
R1 - 0.525
R2 - 0.540 (Senkou-Span B)
R3 - 0.570 (C)
S1 - 0.500
S2 - 0.425
Note:
1. Analysis for education purposes only.
2. Trade at your own risk.

SEAL - Need a strong momentum to maintained bullish continuationN wave with E, V, N & NT projection.
The stock is trading at 0.815, slightly above the NT projection of 0.800. A breakout above 0.855 could confirm the continuation of the bullish trend. 0.800 (NT) as immediate support and this level must hold to prevent a bearish reversal.
This strategy assumes a bullish continuation above the current price, with critical support at 0.800 needing to hold to maintain bullish momentum.
R - 0.855
S1 - 0.800
S2 - 0.780
Note:
1. Analysis for education purposes only.
2. Trade at your own risk.

TEXCYCL Wave 3My Predication using method Elliot Wave, Trendline, Fibonacci Extension, Chart Pattern, BODTL

MYEG - BullishMYEG - Bullish
Technically, this stock continues its bullish trend in 2024 from retracement in 2023 and came back to retracement and close at 0.915. Price remains in a bullish channel and stays above Kijun Sen level, which can be considered a healthy bullish trend at this moment.
Fundamentally, based on recent reports: -
Innovative Services and Blockchain Adoption:
MYEG expects to continue introducing innovative services by leveraging new technologies, specifically blockchain or Web 3.0. This forward-thinking approach aims to drive organic growth for the current financial year.
In the second quarter of 2024, MYEG’s net profit surged to RM165.42 million, up from RM111.56 million in the previous corresponding period. Revenue also grew significantly to RM242.28 million from RM184.88 million a year earlier.
Contributions from services provided by MYEG’s Zetrix blockchain platform, such as ZCert and Digital ID registration and transactions, played a significant role in this growth. Additionally, the sale of Zetrix tokens further boosted their financial performance.
Contract Extension with JPJ:
The Road Transport Department (JPJ) extended the service contracts of MYEG and its wholly-owned unit, MY EG Sdn Bhd (MYEGSB), for three years. These extended contracts will run from May 23, 2023, to May 22, 2026.
Historical Context:
MYEG, originally MY E.G. Services Sdn Bhd, changed its status to a public limited company and assumed its present name, MY E.G. Services Berhad, in conjunction with its listing on the MESDAQ Market. Later, in 2009, it successfully completed its transfer listing to the Main Board of Bursa Malaysia Securities Berhad.
MYEG’s commitment to innovation, blockchain adoption, and sustained financial growth positions it as a dynamic player in the Malaysian business landscape. Keep an eye on their developments.
