CUSCAPI - Potential target analysis for price movementN wave with E, N & NT projection.
The current price is at MYR 0.270, sitting below the Kumo, which suggests bearish momentum. The price recently attempted to break above the Kumo but was rejected, indicating the cloud is acting as a significant resistance level.
If the price breaks above the 0.285 level with strong volume. This would indicate the price has the potential to reach the N and E targets.
R - 0.285
S1 - 0.25
S2 - 0.23
Note:
1. Analysis for education purposes.
2. Trade at your own risk.

SDS PROBABLY MARKING UPAs plotted, This looks like Typical Re-Accmulation (Rising Bottom, Schematic #2)
What interesting to me, is that the incoming supply is reducing and evaporating as evidence by vol @ 29/7/24 (Black Arrow)
-As mentioned by David weiss : Probably this is The Contraction
Thus i humbly initiated my position as attahced
Pure Wyckoff, Anything can happen

YTLPOWR, the DC theme still on?The stock remains below the downtrend line, and the MACD is still in a bearish crossover.
While both the MACD and RSI are showing positive divergence, the strength of this signal remains uncertain. For a sustained move, the price needs to break out of the current downtrend; otherwise, it may just be suitable for a quick FIFO trade.
It's essential to seek at least three confirmations before making a move—anything less is simply gambling.
Disclaimer: The mentioned stocks are based solely on personal opinions for educational and discussion purposes only. There are no buy or sell recommendations. Trading involves financial risk, and you are responsible for your own decisions. The author shall not be responsible for any losses or lost profits resulting from investment decisions based on the information contained herein.

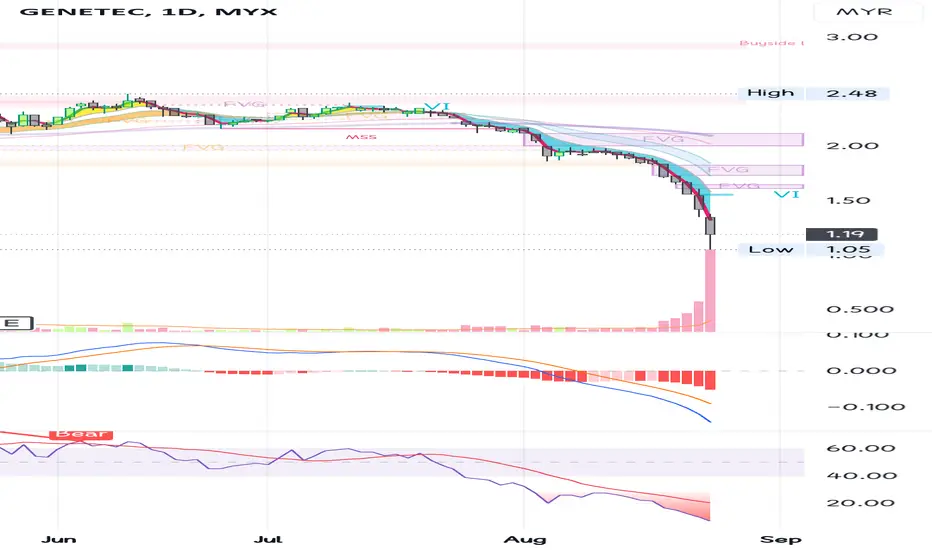
GENETEC, what next?Despite the bearish signals, many are still attempting to catch the falling knife that is GENE. The MACD first registered a downward crossover at the end of June 2024, and the RSI is currently in the oversold zone.
However, it's crucial to remember that an oversold condition doesn't automatically make the stock a good buy.
Oversold and overbought levels don't always signal an imminent reversal; sometimes, they reflect the underlying strength of the current trend.
Disclaimer: Please be informed that all stock picks are solely for educational and discussion purposes; they are neither trading advice nor an invitation to trade. For trading advice, please consult your remisier or dealer representative.
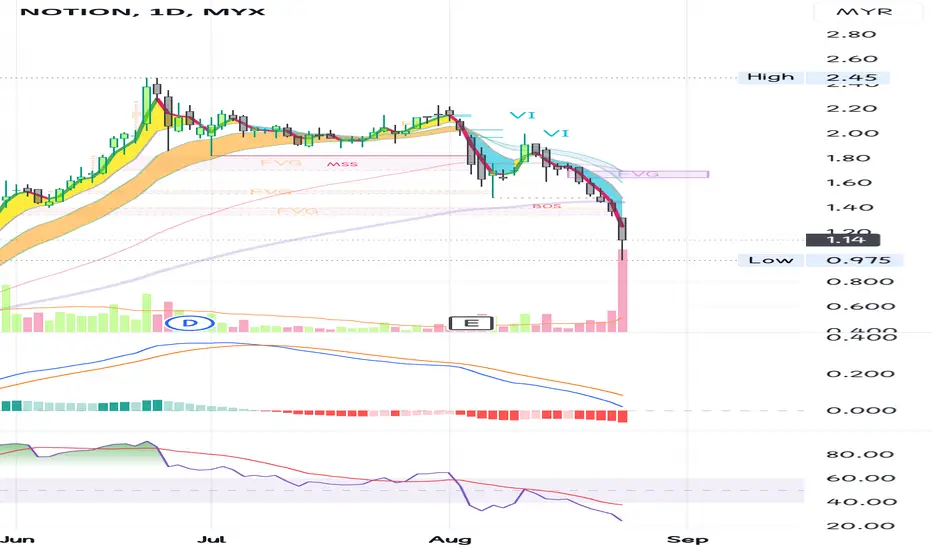
NOTION the end game?The stock has encountered a MACD bearish crossover and has dipped below the most of the EMA lines.
These indicators suggest a bearish trend, making it prudent to avoid this stock for the time being.
Make sure you're in the RIGHT SECTOR (right place at the right time) like FengShui 🤩
When the wind is not blowing, no point sitting there waiting, position ourselves in place of most opportunities. When the tide comes in, all the boat will rise (unless that boat is a sinking boat - poor quality stock)
Disclaimer: The mentioned stocks are based solely on personal opinions for educational and discussion purposes only. There are no buy or sell recommendations. Trading involves financial risk, and you are responsible for your own decisions. The author shall not be responsible for any losses or lost profits resulting from investment decisions based on the information contained herein.
MITRA - Potention on price movement analysisMITRA 1D
Y wave, target (E) within stipulated time. Reaching this target is require a bullish momentum strong enough to break 52w high.
N wave with N, V & NT projection. Price is currently inside up Kumo, indication a consolidation phase with potential for a breakout. A golden cross has occurred which is generally a bullish signal, though slightly weaker since it occurs within the cloud. This signal is stronger if price manages to break above the up Kumo.
R1 - 0.345 (senko span A)
R2 - 0.36
R3 - 0.385 (52w high)
S1 - 0.33 (kijun sen)
S2 - 0.325 (senko span B)
Note:
1. Analysis for education purposes only.
2. Trade at your own risk.

AZRB - Potential price movement analysisAZRB 1D,
Y wave, target (E) within stipulated time. The price must break 52w high to reach this target (E), indicating the potential bullish breakout.
N wave with E, N, V & NT projection. Since the price is below up Kumo, a strong bullish momentum is required to break through identified resistance levels.
R1 - Tenkan sen
R2 - Kijun Sen
R3 - 0.295 (Senko span B
S - 0.23

MBMR GOING FOR MARK UP
In the background of plummeting KLCI (Bursa Index), this stock rising above
Classic Type 1 Re-Accmulation
Price succesfully overcome the suply on 5/8/24 (red arrow)
-Wyckoffian call it 'COMPOSITE OPERATOR ROTATION'
Plus, with the 'Spring' !
I put my trust on the setup
position as attached
PureWyckoff
Anything can happen

PERDANA PETROLEUM BERHAD - [PERDANA]Bollinger Bands :
Upper Band: The price recently touched the upper Bollinger Band, indicating that the stock might be overbought in the short term.
Middle Band (SMA): The price is currently above the middle band, which typically acts as a support during an uptrend.
Lower Band: The price has moved away from the lower Bollinger Band, indicating a reversal from recent lows.
Volume Analysis :
There's been an increase in volume on the latest green candlestick, which is a bullish sign, as it suggests strong buying interest.
Previous periods of high volume seem to coincide with significant price movements, which should be monitored for future confirmations of trends.
Price Action :
The recent candlestick pattern shows a strong upward move, closing near the high of the day. This is indicative of bullish sentiment.
The overall trend from February to July has been upward, although there has been some consolidation in recent months.
Support and Resistance Levels :
Support: Around MYR0.420, where the price previously found support.
Resistance: Around MYR0.510, which corresponds to the upper Bollinger Band and previous highs.
Trend Direction :
Short-Term: The recent bullish candlestick and increasing volume suggest a possible continuation of the uptrend in the short term.
Long-Term: The longer-term uptrend appears intact, with the potential for further gains if the price can sustain above the moving averages.
Conclusion:
The stock is currently exhibiting bullish characteristics with the potential for further upward movement, especially if it can break through the resistance around MYR0.510. However, caution is advised as the price is near the upper Bollinger Band, which may lead to a short-term pullback.

SKBSHUT 1D - Potential price movement analysisY wave, target (F) within stipulated range. Price still above up Kumo, if there is a strong momentum and the occurrence of a golden cross, then the potential for the price to continue upward will occur. The price needs to break turning point (B) and 52w high to reach the target price.
R1 - 1.00 (Kijun sen)
R2 - 1.06
R3 - 1.20 (52w high)
S1 - 0.915 (Senko span A)
Note:
1. Analysis for education purposes only.
2. Trade at your risk.

UNIQUE - Analysis on price movementN wave with E, N & NT projection. A golden cross just occurred above up Kumo and if the strong momentum keep continue, the price shall break 52w high
R - 0.455 (52w high)
S - 0.39
Note:
1. Analysis for education purposes only
2. Trade at your own risk

SEALINK 1D - Potential price targetN wave with E, N, V & NT projection. Price need to break 52w high to reach all target. A golden cross just occurred above up Kumo and may a good sign to have momentum to push the price upward.
R - 0.415 (52w high)
S- 0.345
Note:
1. Analysis for education purposes only
2. Trade at your own risk

ATAIMS - Potential on price movementY wave targeted (E) within stipulated time.
A death cross has occurred and need strong momentum to breakout minor downtrend line if price need to continue upwards. Expected golden cross to be happen if momentum keep upward and price must breakout 52w high to reach (E) and complete the Y wave.
R1 - Senkou Span B
R2 - Tenkan Sen
S - 0.34
Note:
1. Analysis for education only
2. Trade at your own risk

ATAIMS - Updated on price analysis movementY Wave, target (E) within stipulated range. Need to breakout turning point (C) (52w high) to reach the target (E)
N wave with NT, N, V & E projection.
S - 0.405 (Tenkan sen)
R - 0.445 (Senko span B)
Note:
1. Analysis for education purposes only.
2. Trade on your own risk.

M&G - Analysis on price movementY wave, target (E) within stipulated range.
N wave with V, N & E projection. Golden cross may happen if there is a strong momentum to push the price upward.
R - 0.410 (52w high)
S1 - 0.340 (Tenkan sen)
S2 - 0.320 (Senko span B)
Note:
1. Analysis for education purposes only.
2. Trade at your own risk.

KGW, 1D - Analysis on price movementY wave, target (E) within stipulated time.
Price has crossed down up Kumo which shows strong selling pressure is in position. Nearest resistance is Senko span B and Tenkan sen.
S - 0.19
Need strong momentum with high volume to push price upward but need to breakout 52w high (0.295) to reach price target (E).
Note:
1. Analysis for education purposes only.
2. Trade at your own risk

UNIQUE, DC theme still there?Successful breakout 0.400 and up further 10%
Right now it must cross above 0.440. or else will go for pullback...
Let see how to go.
Maximize profits by protecting the downside and minimize losses by seeking the best price.
Disclaimer: The mentioned stocks are based solely on personal opinions for educational and discussion purposes only. There are no buy or sell recommendations. Trading involves financial risk, and you are responsible for your own decisions. The author shall not be responsible for any losses or lost profits resulting from investment decisions based on the information contained herein.

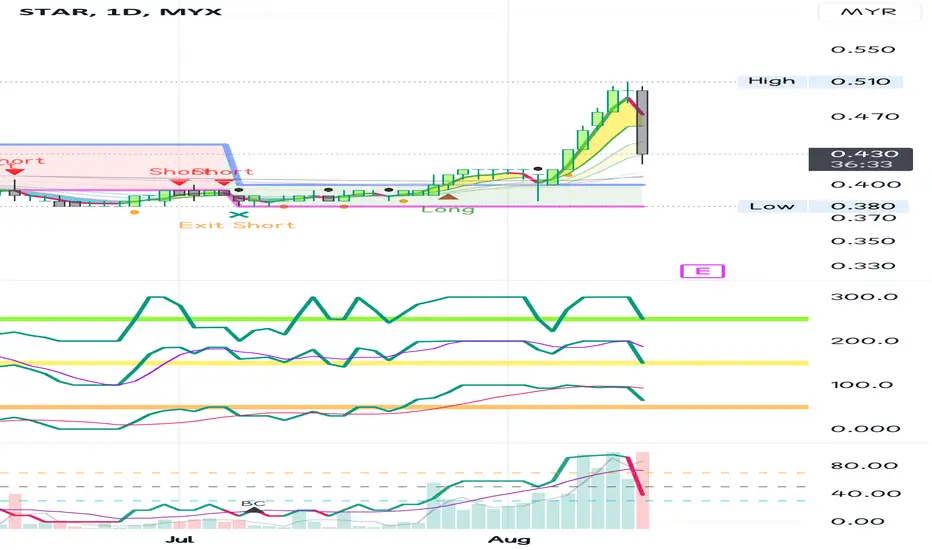
STAR, time to say goodbye?Was a huge selling candlestick -14% within a day.
>> Price below Hull MA
>> 0.420 as nearest support
Seek at least 3 confirmations. Anything less is gambling.
Disclaimer: The mentioned stocks are based solely on personal opinions for educational and discussion purposes only. There are no buy or sell recommendations. Trading involves financial risk, and you are responsible for your own decisions. The author shall not be responsible for any losses or lost profits resulting from investment decisions based on the information contained herein.
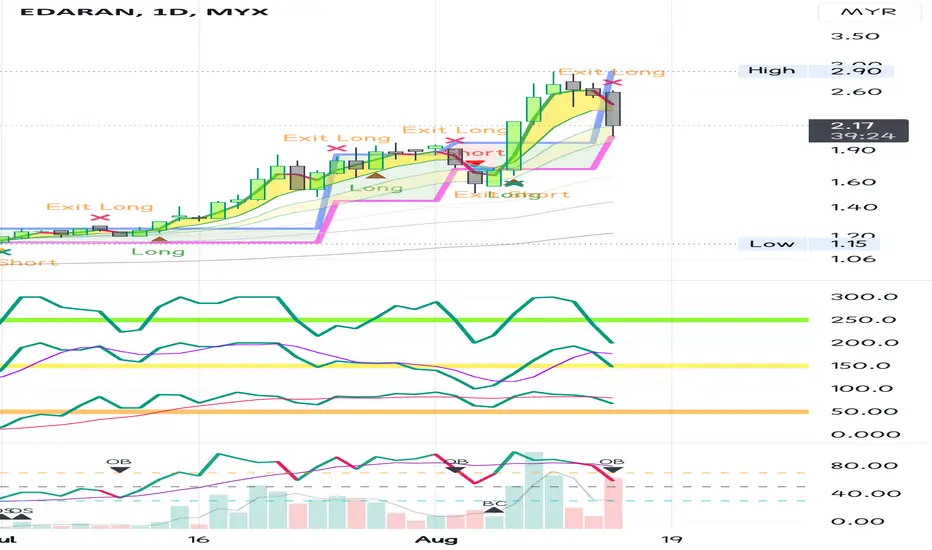
Operator dumping EDARAN?Heavy selling pressure on the second half, -15% and keep counting.
> Only collect if we have the CFK (catch Falling Knife) skill.
>> Price below EMA, the place which I often avoid.
>> 2.050 as latest support. Broken will go down further.
There are many ways to trade the market and make money. You don’t have to master them all. You just have to find your way.
Disclaimer: Please be informed that all stock picks are solely for educational and discussion purposes; they are neither trading advice nor an invitation to trade. For trading advice, please consult your remisier or dealer representative.
PGlobe: 0.475?PGlobe is on an uptrend move. Based on the indicator, current trend and volume, I' m expecting it will move higher targetting 0.475 soon.
TAYOR!

time to rise?I have drawn 2 downtrendlines. one trendline colored red and one colored blue. the red trendline has been broken. so, I think the price will find the next trendline which is the blue trendline. trade at your own risk. this is just an idea, and not financial advice or a buy call.

uptrend in daily time frameThe technical chart shows an upward trend where I have identified 4 important points to identify an upward trend which is L-H-HL-HH... So, in my opinion, this counter has the potential to go higher. Do your own fundamental research. This analysis is only based on technical analysis only. T-A-Y-O-R
