TENAGA, AlgoSignal reveals potential uptrendSeveral indicators within my algorithmic system are signaling a potential uptrend. These include:
- Increased volume: Activity is picking up, suggesting growing interest and potential momentum.
- Mid- to long-term uptrend: Both the 50-day and 150-day exponential moving averages are pointing upward, indicating a sustained positive trajectory.
These factors collectively point towards the possibility of an upward movement in the near future

MBSB. AlgoSignal reveals potential uptrendSeveral indicators within my algorithmic system are signaling a potential uptrend. These include:
- Increased volume: Activity is picking up, suggesting growing interest and potential momentum.
- Mid- to long-term uptrend: Both the 50-day and 150-day exponential moving averages are pointing upward, indicating a sustained positive trajectory.
These factors collectively point towards the possibility of an upward movement in the near future

MRCB. AlgoSignal reveals potential uptrendSeveral indicators within my algorithmic system are signaling a potential uptrend. These include:
- Increased volume: Activity is picking up, suggesting growing interest and potential momentum.
- Mid- to long-term uptrend: Both the 50-day and 150-day exponential moving averages are pointing upward, indicating a sustained positive trajectory.
These factors collectively point towards the possibility of an upward movement in the near future

WELLCALL. AlgoSignal reveals potential uptrendSeveral indicators within my algorithmic system are signaling a potential uptrend. These include:
- Increased volume: Activity is picking up, suggesting growing interest and potential momentum.
- Mid- to long-term uptrend: Both the 50-day and 150-day exponential moving averages are pointing upward, indicating a sustained positive trajectory.
These factors collectively point towards the possibility of an upward movement in the near future

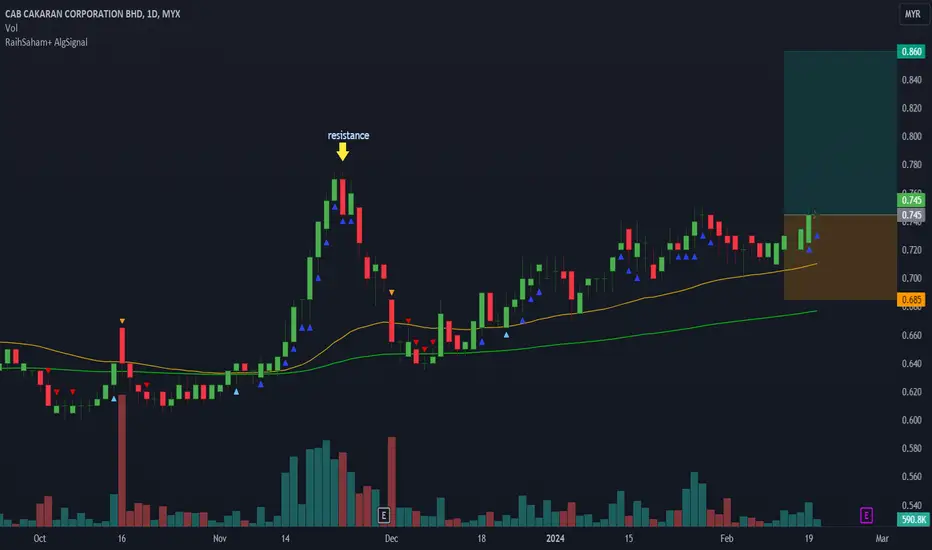
CAB, AlgoSignal reveals potential uptrendSeveral indicators within my algorithmic system are signaling a potential uptrend. These include:
- Increased volume: Activity is picking up, suggesting growing interest and potential momentum.
- Mid- to long-term uptrend: Both the 50-day and 150-day exponential moving averages are pointing upward, indicating a sustained positive trajectory.
These factors collectively point towards the possibility of an upward movement in the near future
NotionSeveral indicators within my algorithmic system are signaling a potential uptrend. These include:
- Increased volume: Activity is picking up, suggesting growing interest and potential momentum.
- Mid- to long-term uptrend: Both the 50-day and 150-day exponential moving averages are pointing upward, indicating a sustained positive trajectory.
These factors collectively point towards the possibility of an upward movement in the near future

PENERGY, Uptrend based on AlgoSignal StrategyThe current point exhibits promising upward signals according to my algorithmic system, meeting various criteria. These include rising trading volume, an upward trend indicated by prices above EMA20 and EMA50, and the closing price surpassing VWAP. As a result, the present conditions suggest a potential upward trend.

POWERWELL, Uptrend based on AlgoSignal StrategyThe current point exhibits promising upward signals according to my algorithmic system, meeting various criteria. These include rising trading volume, an upward trend indicated by prices above EMA20 and EMA50, and the closing price surpassing VWAP. As a result, the present conditions suggest a potential upward trend.

CLOUDPOINT. Uptrend based on AlgoSignal StrategyThe current point exhibits promising upward signals according to my algorithmic system, meeting various criteria. These include rising trading volume, an upward trend indicated by prices above EMA20 and EMA50, and the closing price surpassing VWAP. As a result, the present conditions suggest a potential upward trend.

Frontkn-WB . Uptrend based on AlgoSignal StrategyThe current point exhibits promising upward signals according to my algorithmic system, meeting various criteria. These include rising trading volume, an upward trend indicated by prices above EMA20 and EMA50, and the closing price surpassing VWAP. As a result, the present conditions suggest a potential upward trend.

HEGROUP FAKEY FORMATIONI can see the potential for Bullish when it break .545
FAKEY pattern is recognized, but the volume I can see it is not have much. So, quite dangerous. However, my personal target is around 60 cent.
All the best!

RL Buy, possible return +10%+Time Frame: 4H
Sentiment: Overbought
Forecast: Bullish
We can see a strong support and buying momentum around 0.31-0.315, selling power is weak.
Bar price action and the volume, showing buyers' power increase.
expecting it can break the resistant level 0.34-0.35, and reach 0.38
Write your thought in the comment session :)
P.S
Please, note that an oversold/overbought condition can last for a long time, and therefore being oversold/overbought doesn't mean a price rally will come soon, or at all.
Like my works? Please hit the Like, Follow and Share or tip me a coin :)
Thanks!
Disclaimer
This information only serves as study references, does not constitute a buy or sell call.


GFM BreakoutGfM breakout with volume.
A lot of big volume coming in.
Strong buying enter into the zone.
Anyhow stop loss is 7% if failed and otherwise its gonna hurt you 15-20% floating and to need to wait for rebound.
Hopefully buying momentum keep that high

Fajar Breakout About to break 0.355.
Good setup.
Malas nak taip panjang2. Tapi tradingview suruh taip panjang2. Grrrrr

SAMAIDEN Cup & Handle pattern. TP 30%++ SAMAIDEN is forming a perfect cup & handle pattern.
Time Frame: 4H
Sentiment: Bullish
Risk reward 1:2
Entry 1.3
Expecting it will breaking up previous new high, around RM 1.36, and going all the way up.
Write your thought in the comment session :)
P.S
Please, note that an oversold/overbought condition can last for a long time, and therefore being oversold/overbought doesn't mean a price rally will come soon, or at all.
Like my works? Please hit the Like, Follow and Share or tip me a coin :)
Thanks!
Disclaimer
This information only serves as study references, does not constitute a buy or sell call.

Gpharos The PyramidThe first glance it's sound like a pharaoh
I smell something here...
If break 0.545 then it will be interesting
But if it is interesting on the market depth you don't need to wait for breakout
The risk it's about 10% on DTF but its too high if wait on a breakout area
You may consider risk SL @ 3-4% (0.505) if the price consider on 0.525
But this guy pattern its like ...i will tell you on update
#This is not a buy call. Trade at your own risk. Your capital it's your own responsibility

IS PECCA GOING UPWARDToo many stepping stone
Yellow box indicate of what David Weiss termed as 'Battering ram of castle door' --- The line of Least Resistance
A classic sign of absorption
with the assumption of Re-Accmulation (Shcematic #2) is on going,
position initiated as attached
Pure wyckoff

Dayang Continuation of Mark UpThe Gap up today mark the continuation of mark, Breakout of BUEC
*refer prev analysis
In view of that, Position initiated as attached
Pure Wyckoff

KJTS start pullback >> Pullback in the making....
>> monitor whether it will stay above or below 0.555 area.
When the market moves where, and how, and if - these are all unknown. The only thing which we can control is our risk. Focus on risk management!
Keep the long term vision.
Disclaimer :
Please be informed that all stocks pick are solely for education and discussion purpose; it is neither a trading advice nor an invitation to trade. For trading advice, please speak to your remisier or dealer representative.

Forecasted INFOTEC's Revenue For Financial Year 2024Forecasted INFOTEC's Revenue For Financial Year 2024
APEX SECURITIES
(26.2.2024)
= RM 120.5 Millions
RHB Small Cap Asean Research
(07.9.2023)
= RM 123.0 Millions
Pretty impressive!

RSAWIT near to euphoria area?Elliot Wave: how many waves already?🤔
>> Was gained more than 80% from latest bottom.
>> I will choose to protect downside (if trade).
>> Once brake the EMA lines will ugly.
Make sure you're in the RIGHT SECTOR (right place at the right time) like FengShui 🤩
When the wind is not blowing, no point sitting there waiting, position ourselves in place of most opportunities. When the tide comes in, all the boat will rise (unless that boat is a sinking boat - poor quality stock).
Disclaimer: Mentioned stocks are solely based on own opinions for education and/or discussion purpose only. There's no buy and/or sell recommendation. Trading involve financial risk on your own. The author shall not be responsible for any losses or lost profits resulting from investment decisions based on the use of the information contained herein.

Conservative Extrapolation Financial 2024Conservative Extrapolated Revenue Growth Factor 2024
= (1,836+5,216+788)÷(1,404+4,445+358)
= 1.2630900596
Conservative Extrapolated Revenue 2024
= 71.929×1.2630900596
= 90.8528048977m
Conservative Extrapolated Net Profit 2024
= 90.8528048977×0.294
= 26.7107246399m
Conservative Extrapolated EPS 2024
= 26.7107246399÷363.229
= RM 0.0735368724
Extrapolated Dividend Payouts
= 0.0232÷0.053
= 43.77358491%
Conservative Extrapolated DPS 2024@43.77358491% Payout
= 0.0735368724×0.4377358491
= RM 0.0321897253
