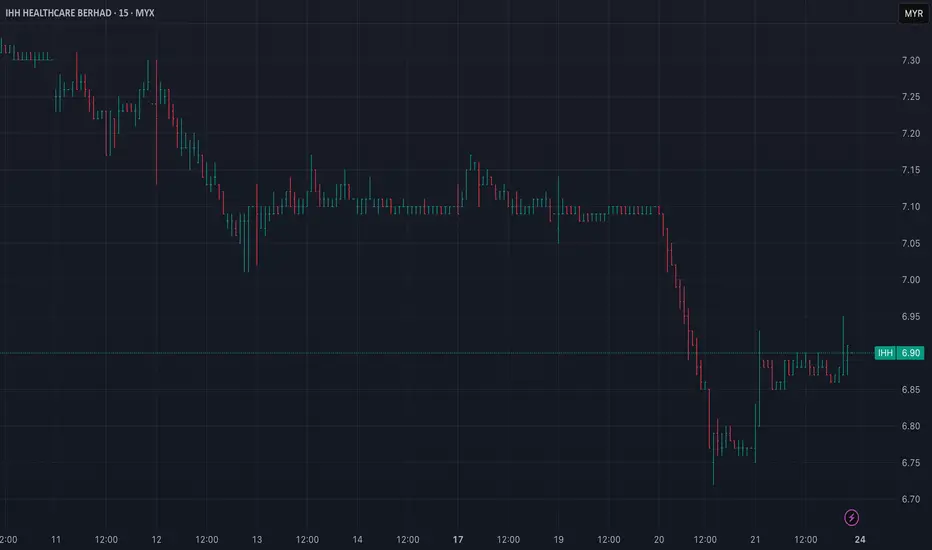
IHH Trading Plan: Simple 2:1 Strategy for Steady GainsIHH Trading Plan
Entry Price (EP): RM6.87
Take Profit (TP): RM7.01 (2% gain)
Stop Loss (SL): RM6.80 (1% loss)
Risk-Reward Ratio: 2:1
Strategy:
Enter at RM6.87 on bullish confirmation (e.g., breakout or strong buying momentum).
Exit at RM7.01 for profit or cut losses at RM6.80.
Risk only 1-2% of total capital for controlled exposure.
Tip: Watch for sector news or earnings updates to support bullish momentum.
TENAGA Trading Plan: Simple 2:1 Strategy for Consistent GainsEntry Price (EP): RM13.56
Take Profit (TP): RM13.83 (2% gain)
Stop Loss (SL): RM13.42 (1% loss)
Risk-Reward Ratio: 2:1
Strategy:
Enter at RM13.56 with bullish confirmation.
Exit at RM13.83 or cut losses at RM13.42.
Risk only 1-2% of total capital.
Tip: Monitor news and market sentiment for better timing.

IJM - Completion of Corrective Wave EMajor Trend : Retracement
Minor Trend : Retracement
Note: In my opinion, the Wave C of Wave E is completed. Next wave could be Wave 1 of new uptrend.
This is just my point of view. Not recommended to buy or sell.

CBHB...The MACD is still below zero, while both the RSI and Stochastic RSI are in the overbought zone. This suggests that a pullback could be on the horizon, so caution is advised. After the pullback, watch for signs of a base forming, as this could indicate a potential rebound. Monitor closely for possible FIFO (First In, First Out) opportunities.
Disclaimer: This is not financial advice. Always conduct your own research and consult a professional before making any investment decisions.

Still UNIQUEThe MACD is still below zero, while both the RSI and Stochastic RSI are in the overbought zone. This suggests that a pullback could be on the horizon, so caution is advised.
Disclaimer: This is not financial advice. Always conduct your own research and consult a professional before making any investment decisions.

NORTHERN MYX:NORTHERN
📊 Short-Term Bias: Neutral to Bullish (Consolidation with Breakout Potential)
🔎 Decision Point: RM 0.565 - 0.580 → If it breaks above, expect bullish momentum towards
0.630 (IPO Price)
📢 Risk Management: If price falls below 0.525, the bullish setup is invalidated.
📢 Disclaimer
The trading ideas and analysis provided are for informational purposes only and do not constitute financial advice. Trading involves risk, and past performance is not a guarantee of future results. Always conduct your own research and use proper risk management. I am not liable for any financial losses.
📌 Trade responsibly. Invest only what you can afford to lose.

UEMS Elliott Wave: Wave (iii) Setup in ProgressUEMS Elliott Wave Update: Price completed a 5-wave move, peaking at 1.19 MYR, followed by an ABC correction to 0.81 MYR (key support). Holding above 0.81 MYR may trigger wave (iii) towards 1.50 MYR. A break below invalidates the count. #ElliottWave

SPSETIA, found support?The price has rebounded from a major support level, raising the possibility of a test against the downtrend line. If the price fails to break above this resistance, it may retrace back to the support zone. A breakdown below the support level could lead to further downside movement.
From a technical perspective, confirmation of a breakout above the downtrend line is essential for a potential trend reversal. Key indicators such as RSI and MACD should be monitored, if RSI remains neutral and MACD fails to turn positive, the current downtrend may persist. Additionally, volume analysis will help determine whether the rebound is backed by strong buying interest or just a temporary relief rally.
In such market conditions, risk management remains crucial. Securing profits on rebounds and protecting capital against further downside risk can help navigate potential volatility. Waiting for a confirmed breakout or breakdown before making major decisions can reduce unnecessary exposure.
Disclaimer:
This analysis is for informational purposes only and should not be considered financial advice. Always conduct independent research and consult with a professional before making investment decisions.

SAMAIDAN, where the next low?The price has broken through multiple support levels, showing continued weakness with no strong reversal signals yet. The downtrend remains intact, and unless a solid base is formed, further downside movement is possible.
Key Considerations:
Support & Reversal Area: As no significant buying pressure has emerged, the next key level to watch is where price stabilizes and forms a potential reversal pattern, such as a double bottom, bullish divergence on RSI, or strong volume accumulation.
RSI & MACD Signals: If RSI reaches oversold conditions with bullish divergence while MACD starts to turn upward, it could indicate a possible reversal. However, confirmation is needed before considering an entry.
Trend Strength: The current price action suggests weak momentum, and blindly accumulating at this stage carries high risk. Waiting for clearer signs of stabilization or a confirmed breakout is a more prudent approach.
Should You Start Collecting?
For myself, I wouldn’t rush into accumulating blindly. Instead, I would:
1. Wait for a Base Formation: Look for strong support and consolidation before considering entry.
2. Watch for Volume Confirmation: Increased buying volume at support can indicate institutional accumulation.
3. Monitor Key Indicators: Oversold RSI, MACD crossover above zero, or bullish candlestick patterns could signal a potential turnaround.
Potential Trade Plan:
If a strong support emerges, look for confirmation before entering.
If the downtrend continues, stay patient and wait for a reversal signal.
Avoid catching a falling knife.... let the market show clear signs of strength first.
Disclaimer: Please be informed that all stock picks are solely for educational and discussion purposes; they are neither trading advice nor an invitation to trade. For trading advice, please consult your remisier or dealer representative.

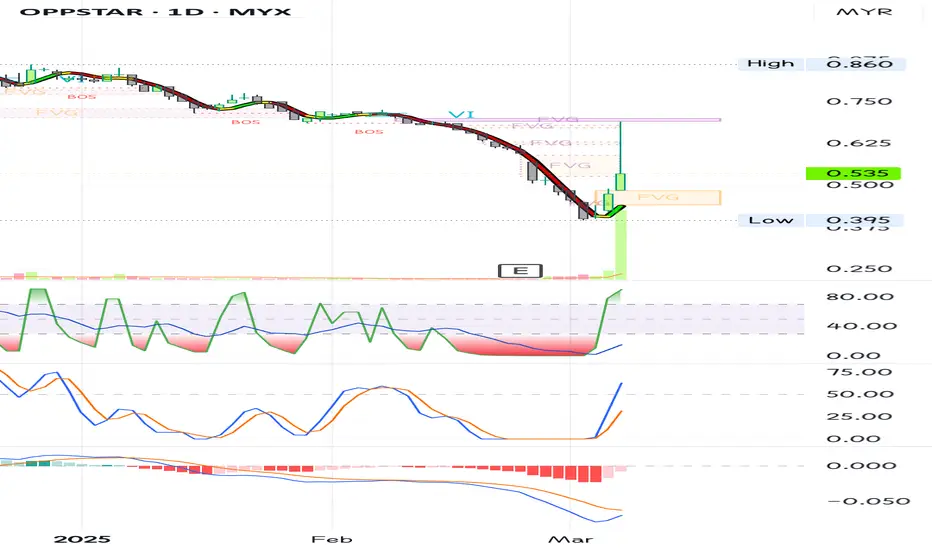
Oppstar, come already?The price action briefly tested the 0.690 level before retracing, signaling potential resistance at this area. The RSI reaching overbought territory suggests that buying momentum may be overextended, increasing the likelihood of a pullback or consolidation before any further upward move.
Despite this short-term bullish push, the MACD remains below 0, indicating that the broader trend is still weak, and upward momentum lacks confirmation. A bullish MACD crossover above the zero line would strengthen the case for continued upside.
Key Levels to Watch:
Resistance: 0.690 (recent high)
Breakout Confirmation: A sustained move above 0.690 with increasing volume could signal further upside, while failure to break could lead to further downside.
Potential Scenarios:
Bullish Case: If the price consolidates and the MACD turns positive, it could support a stronger upward move beyond 0.690.
Disclaimer: The mentioned stocks are based solely on personal opinions for educational and discussion purposes only. There are no buy or sell recommendations. Trading involves financial risk, and you are responsible for your own decisions. The author shall not be responsible for any losses or lost profits resulting from investment decisions based on the information contained herein.
Pentamaster, Is the downtrend getting weaker ?As you can see, Daily Chart is making chart pattern QM (Quasimodo). Buy at current price better because it is not high liquidity (hard to match price). With risk reward 1:3.

Dnex Impulsive move complete?Daily chart show an impulsive upward movement, if this movement is valid signal for uptrend. Anticipate 50% retracement with 1:2 risk reward ratio. Stop loss below current low.

MFCB super strong support line around 3.85This is a life time opportunity to add massive MFCB position to your portfolio when it drop to around 3.85

AEMULUS create spring, currently only strong holder
1. **Accumulation and Distribution Phases**:
- There's a clear accumulation phase between November 2023 and February 2024, showing price consolidation at lower levels.
- A distribution phase appears from June to August 2024, with price making higher highs before reversing.
2. **Wyckoff Schematics**:
- The chart shows a "Spring" around March 2023 (when price broke below support then quickly reversed).
- Several "Tests" of resistance levels are visible, particularly around June-July 2024.
- The "Sign of Strength" rally is evident from February to May 2024.
3. **Volume Analysis**:
- Volume increased during the early 2024 uptrend (accumulation confirmation)
- The May 2024 peak showed high volume (distribution), followed by decreasing volume as price declined.
- Recent selling has occurred on increased volume (bearish confirmation).
4. **Price/Volume Relationships**:
- Price rises on increasing volume (bullish)
- Price drops on increasing volume (bearish)
- Several instances of "effort vs. result" divergence, where large volume (effort) produced minimal price movement (result).
5. **Current Positioning**:
- The stock appears to be in a re-accumulation or possibly continued distribution phase.
- The recent lower highs and lower lows suggest continued weakness.
- The multiple "Sell" signals on the chart align with Wyckoff's distribution concept.
The Fibonacci retracement levels (0.382, 0.5, 0.618) shown on the chart support the Wyckoff analysis, with price respecting these key levels during both advances and declines.

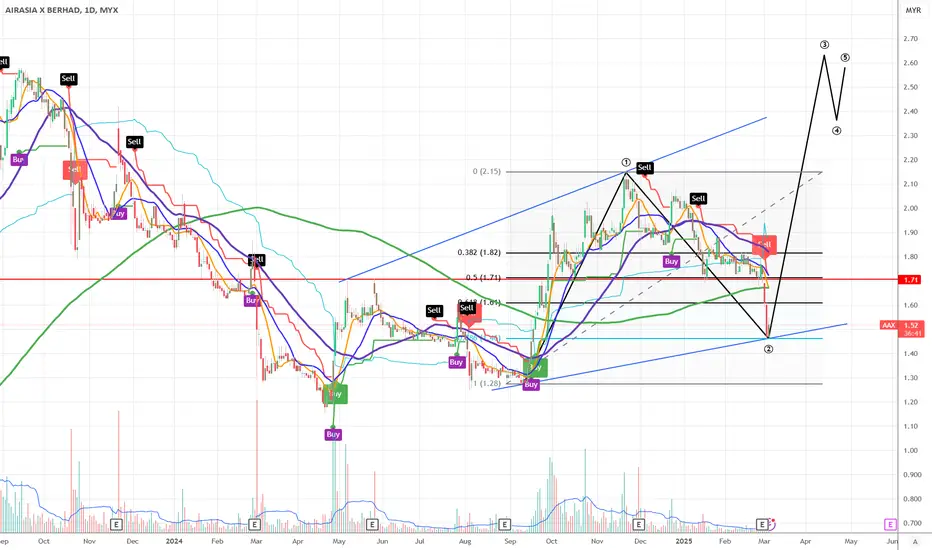
AAX recalculate wave - current is wave 2wave 2 and it retraces to 0.786, quite deep retracement
provides excellent risk and reward ratio
the wave will be invalid if current price managed to break support of rm1.28
Current price around 1.52-1.53 MYR with sell/buy buttons visible
Multiple buy and sell signals marked throughout the chart
A downward trend followed by consolidation and potential reversal pattern
Support and resistance levels marked (including 1.71 level)
Elliott Wave counting visible with numbered points (1-5)
Moving averages (multiple colored lines) showing trend direction
Volume indicators at the bottom of the chart
Time frame appears to be 1-day (1D) chart showing data from 2023-2025
The chart suggests analysts are projecting a potential upward movement after the current price consolidation, with targets marked significantly higher than current levels. Recent price action shows the stock is trading near support levels after a period of decline.
MCLEAN - Looking for a strong bullish momentumN wave with E, N & NT projection.
The price indicates bullish momentum as it has recently pushed upward.
The Tenkan-sen is above the Kijun-sen, indicating a bullish trend. The price has broken through the cloud, confirming further upward movement.
Consider entering a long position around 0.310, especially if the price shows a breakout above the NT projection (0.325) with strong volume.
Confirmation: Look for a bullish candlestick close above 0.325 to validate this entry.
Set a stop-loss at 0.295, just below the previous swing low, to manage risk effectively.
Monitor market news and trends that could impact McLean Technologies, particularly in the tech or manufacturing sectors.
Watch for confirmation from volume indicators; increasing volume on upward price movements will help validate bullish sentiment.
Keep an eye on the Kumo for any potential shifts in market structure, particularly if the price breaks above it decisively, which would indicate a strong bullish outlook.
Note:
1. Analysis for education purposes only.
2. Trade at your own risk.

CLOUDPT - Monitoring the market direction.N wave with E, N, V & NT projection.
The price is currently above the Kumo, indicating a bullish market sentiment.
Tenkan-sen is above the Kijun-sen, reinforcing the bullish outlook.
The Kumo itself is green, suggesting continuation of the upward momentum. Watch for price action near the upper edge of the cloud for potential breakout signals.
Consider entering a long position near 0.915 (current price) or on a confirmed breakout above 0.930, which aligns with the projected resistance levels.
Confirmation: Look for strong bullish candlestick patterns or a break above the Kumo with increased volume to validate the long entry.
Set a stop-loss at 0.860, below recent swing lows, to manage risk in case the price moves against the position.
Monitor wider market trends and any news that could affect the technology sector in Malaysia.
Keep a close watch on volume; a surge in volume accompanying price increases would strengthen the bullish sentiment.
Stay alert for any changes in the Kumo structure, as a shift to a thicker Kumo might indicate future volatility.
Note:
1. Analysis for education purposes only.
2. Trade at your own risk.

KAREX - Bullish sentimentThe price is trading above the Kumo, indicating a bullish sentiment.
The Tenkan-sen and Kijun-sen have a bullish crossover, supporting upward momentum.
The Chikou Span is above the price, reinforcing bullish confirmation.
NT (0.900): This level is immediate support and has been tested as a pullback area. The price has bounced above it, validating its strength.
Increasing volume near the breakout suggests strong buyer interest.
Consider entering near the current price (0.930) if bullish momentum sustains.
Place a stop-loss below the NT level at 0.890 to minimize risk.
If the price closes below NT (0.900) with high volume, the bullish scenario could be invalidated.
Note:
1. Analysis for education purposes only.
2. Trade at your own risk.

MYEG - Analysis of potential market movement.N wave with E, V, N & NT projection.
The price has broken above the Kumo, signaling a shift to bullish momentum.
The Tenkan-sen and Kijun-sen lines are in a bullish crossover, supporting upward momentum.
The Chikou Span is above the price, confirming the bullish sentiment.
NT (0.905): This is the immediate support level, with the price sustaining above it after testing it during the correction phase.
The Kumo thickness indicates support around the NT level (0.905), serving as a strong area for potential bounce back.
Increasing volume during the breakout above the Kumo indicates strong buyer interest.
Consider entering a long position near the current price of 0.945, preferably on a confirmed breakout above the N level (0.970) with a strong volume.
Confirmation: Look for bullish price action (like a breakout candle) to confirm the entry, ideally watching for a close above the resistance level of 0.970.
Set a stop-loss around 0.895, just below the NT level, to protect against downside risks and to account for normal volatility.
Monitor overall market sentiment and any news related to MYEG or the Malaysian tech sector that could impact trading behavior.
Volume analysis is crucial; increases in volume while approaching breakout levels will validate bullish sentiment.
Keep track of potential volatility as the price approaches projected resistance levels, adjusting stop-loss orders to lock in profits upon favorable movement.
Note:
1. Analysis for education purposes only.
2. Trade at your own risk.

AWANTEC - Looking for bullish continuationN wave with E, V, N & NT projection.
The price has broken above the Kumo, indicating a potential shift to bullish momentum.
Chikou Span is above the price and Kumo, confirming a bullish bias.
Tenkan-Sen and Kijun-Sen show bullish alignment, with Tenkan-Sen above Kijun-Sen.
N at 0.380: A nearest resistance target providing insight into trade exits.
NT at 0.355: which acts as immediate support. The price is currently trading above this level, suggesting a continuation of the upward trend. A drop below this would signal a shift in a market sentiment and potential trend reversal.
The downtrend line has been broken, signaling a reversal to an uptrend.
There is a noticeable increase in volume, which supports the breakout above the Kumo and the trendline.
Entry: Around the current price of 0.370, ensuring the price stays above the NT level of 0.355.
Stop-Loss: Below 0.345, just under the NT support level and Kijun-Sen.
If the price falls below 0.355, it may indicate a false breakout. Reassess the trade setup if this occurs.
Note:
1. Analysis for education purposes only.
2. Trade at your own risk.

CORAZA - Bullish continuationEntry & exit strategy with Fibonacci retracement line.
The price has experienced a significant rally, indicating bullish momentum.
52w High (0.675): This is a critical resistance level that the price has tested. A confirmed breakout above this level indicates bullish strength.
The price is currently trading above the Kumo, suggesting a bullish trend.
Chikou-span is above the price and Kumo, further confirming the bullish sentiment.
The Tenkan-Sen and Kijun-Sen lines are trending upwards, supporting the bullish momentum.
Fibonacci Retracement Levels:
Entry 1: 50% retracement at 0.600.
Entry 2: 38.2% retracement at 0.580.
These levels offer potential buy zones in case of a pullback.
Stop loss below 0.540 (14.4% Fibonacci level).
Note:
1. Analysis for education purposes only.
2. Trade at your own risk.

CABNET - Looking for strong bullish momentumN wave with E, V, N & NT projection.
The price is above the Kumo suggesting a shift in momentum towards bullishness.
NT level (0.470) acts as immediate resistance. A breakout above NT level with a strong volume confirming a potential bullish momentum.
The Kumo is green, suggesting that the future trend may continue to be bullish if the price closes above the Kumo.
Enter a long position at 0.430 if the price holds above this level with bullish candlestick.
Set a stop-loss at 0.400, just below the immediate support and recent lows, to manage risk effectively.
Note:
1. Analysis for education purposes only.
2. Trade at your own risk.
